

Create your own custom telemetry UI
If you can think it, you can build it. Use vibe coding tools like Lovable or V0 to create custom telemetry UIs on top of Bronto's APIs.


Your data, your UI, your rules
Start from a template or a blank canvas, then build exactly the telemetry experience your team needs.
Build from templates
Start fast with ready-made dashboards and tools the community has already built and shared.
Spin off your own
Fork any template, tweak the prompt, and make it yours in minutes, no starting from scratch.
Highly specific views
Create dashboards tuned to your exact services, customers, and workflows instead of one-size-fits-all.
Features you won't find elsewhere
Build capabilities no off-the-shelf product ships, if you can describe it, you can ship it.
Share across your team
Publish your internal tools so everyone works from the same purpose-built interface.
Powered by Bronto's APIs
Everything sits on Bronto's REST API and MCP server, so your UI always has live, full-fidelity data.
Pick your tool and start building
Build on Bronto with Lovable or v0, same flow, your choice of tool.
Start from Bronto's Lovable baseline template, it already wires up Search, tracing, dashboards, and usage views against the Bronto API, so you can go straight to shaping the workflow you need.
Remix the baseline template
Open Bronto's Lovable baseline template and remix it to start with Search, tracing, dashboards, and usage already connected.
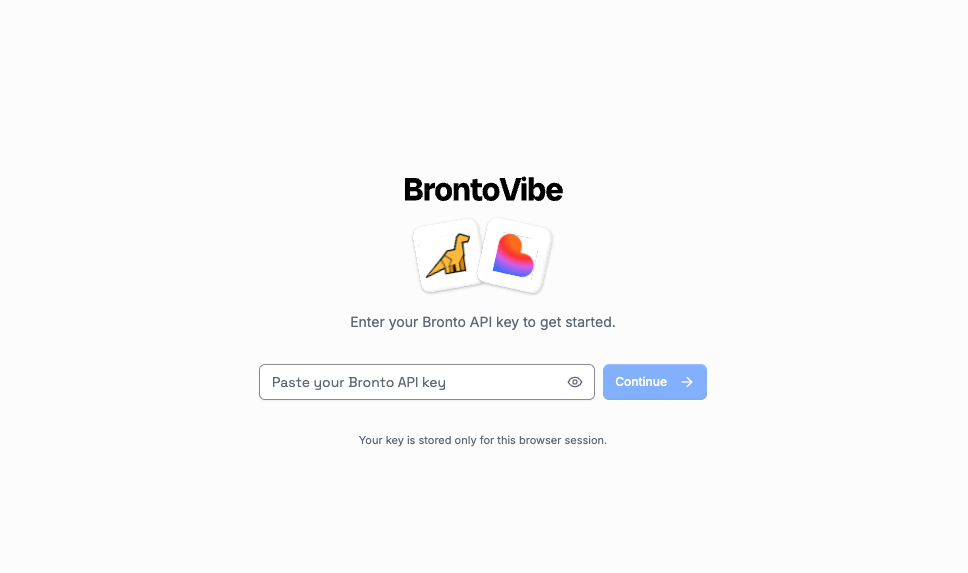
Generate a Bronto API key
Create a dedicated API key for your app with access to the features your interface uses (Search, tracing, dashboards, usage).
Customize with prompts
Describe the user, the workflow, the Bronto API behind it, and the charts or tables you want, then let Lovable build it.
Link back into Bronto
Keep the UI focused. When users need deeper context, link them straight into Bronto search or trace exploration.
Examples of what you can build
Real telemetry UIs teams have spun up on top of Bronto's APIs, from dashboards to bespoke internal tools.
Custom Service Maps
Trace requests from frontend to checkout API, surfacing errors, failed checks, and red metrics across services.
Agent token spend tracker
Follow the full lifecycle of each agent and see exactly how many tokens, and how much money, it's spending.
Visual live tail
Watch logs flow as bubbles in real time, turning a raw live tail into something you can actually make sense of, powered by our live tail API.
Error deployment tracker
Follow error spikes against each deployment, so you can instantly see when a new version introduced problems.
Pick a use case, copy a prompt, start building
Browse use cases and copy a ready-made prompt into Lovable or v0 to spin up a custom Bronto UI in minutes.
Latency outlier workbench
Build a latency workbench on the Bronto API where I pick a service and time window, see the p95/p99 trend, then click any spike to expand the slowest traces in that bucket, group them by endpoint and status, and pin the worst offenders to a shortlist with a one-click link back into Bronto trace exploration.
Compare any two windows
Create a side-by-side comparison canvas that lets me select two arbitrary time windows (for example today vs last Tuesday), runs the same Bronto timeseries aggregation for both, and renders request rate, error rate, and latency as overlaid charts with a computed percentage delta and an auto-generated 'what changed' summary line per metric.
Saved view builder
Build a dashboard tool where I compose panels by choosing a Bronto dataset, a group-by field, and an aggregation, then save the whole layout as a named view in local state so I can switch between 'Checkout team', 'API gateway', and 'Edge' configurations from a dropdown without rebuilding anything.
Deploy-overlay scrubber
Create a timeline view that plots error rate and latency from Bronto and overlays deploy markers I enter or paste in, with a draggable scrubber that shows the before/after numbers around the selected deploy and flags it red if error rate rose more than a threshold I set.
Drill-through traffic explorer
Build an explorer that starts with total Bronto request volume and lets me click to progressively drill down by region, then service, then endpoint, keeping a breadcrumb of the filters applied and letting me jump back to any level, so I can chase a traffic anomaly to its source.
Endpoint watchlist
Create a watchlist app where I add specific endpoints I care about, and for each one it polls the Bronto API on an interval to show a live mini-chart, current error rate, and a status dot, with the ability to reorder, remove, and collapse rows into a compact strip.
Recurring slowness finder
Build a view that pulls 7 days of latency from Bronto bucketed by hour-of-day and day-of-week, renders it as a heatmap, and then computes and lists the recurring slow windows in plain language (for example 'consistently slow Mondays 09:00 to 11:00') instead of leaving me to read the grid.
Status-code storyboard
Create a storyboard that breaks Bronto traffic down by status code over time and, whenever the 4xx or 5xx share crosses a threshold, automatically captures a sample of matching log lines for that moment so I get an annotated narrative of how the error mix shifted across the day.
Service health scoreboard
Build a scoreboard that computes a single composite health score per service from Bronto error rate and latency percentiles, ranks all services from healthiest to worst, colour-codes them, and lets me expand any row to see the three metrics that pulled its score down.
TV wallboard with rotation
Create an office-TV wallboard from Bronto that cycles automatically through a set of big-number tiles and sparklines for each major service every few seconds, pauses rotation on hover, and flashes a tile when its metric breaches a threshold I configure.

If you can think it,
you can build it
Spin up custom telemetry UIs on top of Bronto's APIs with the vibe coding tools you already love.