
Aug 1, 2026Metrics
Metrics
Metrics Explorer
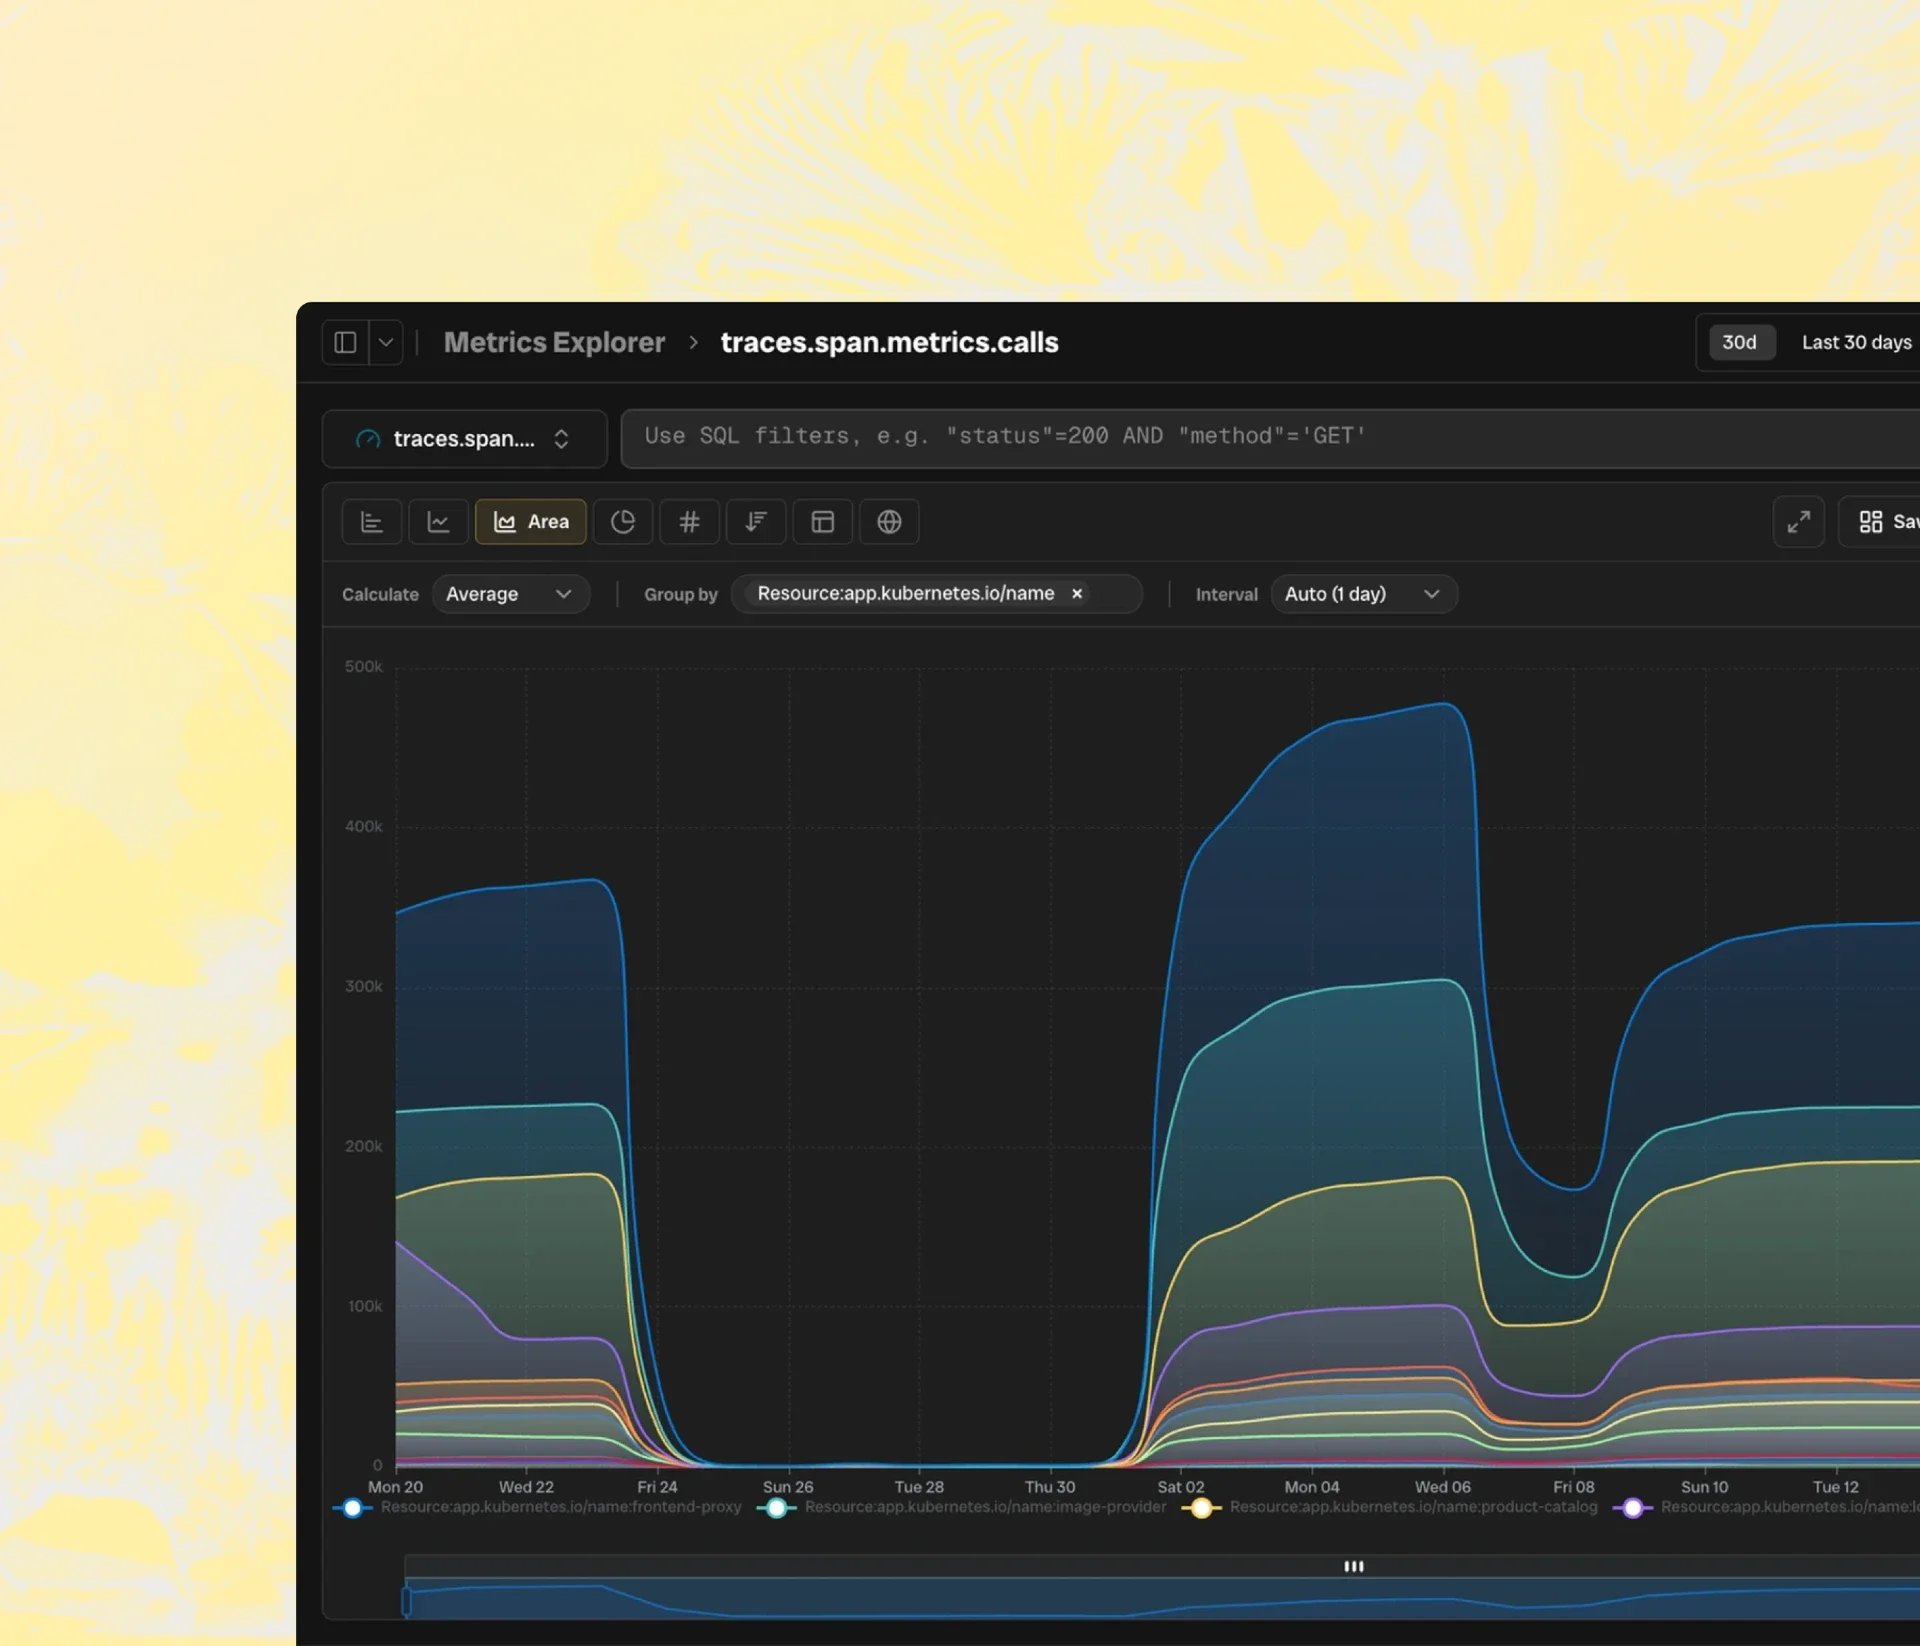
Bronto now supports metrics alongside logs and traces. Use the Metrics Explorer to query any metric, filter with SQL, group by attributes, and visualize trends over time — all retained for 12 months.

Product updates, improvements, and new capabilities, shipped continuously.
Bronto now supports metrics alongside logs and traces. Use the Metrics Explorer to query any metric, filter with SQL, group by attributes, and visualize trends over time — all retained for 12 months.
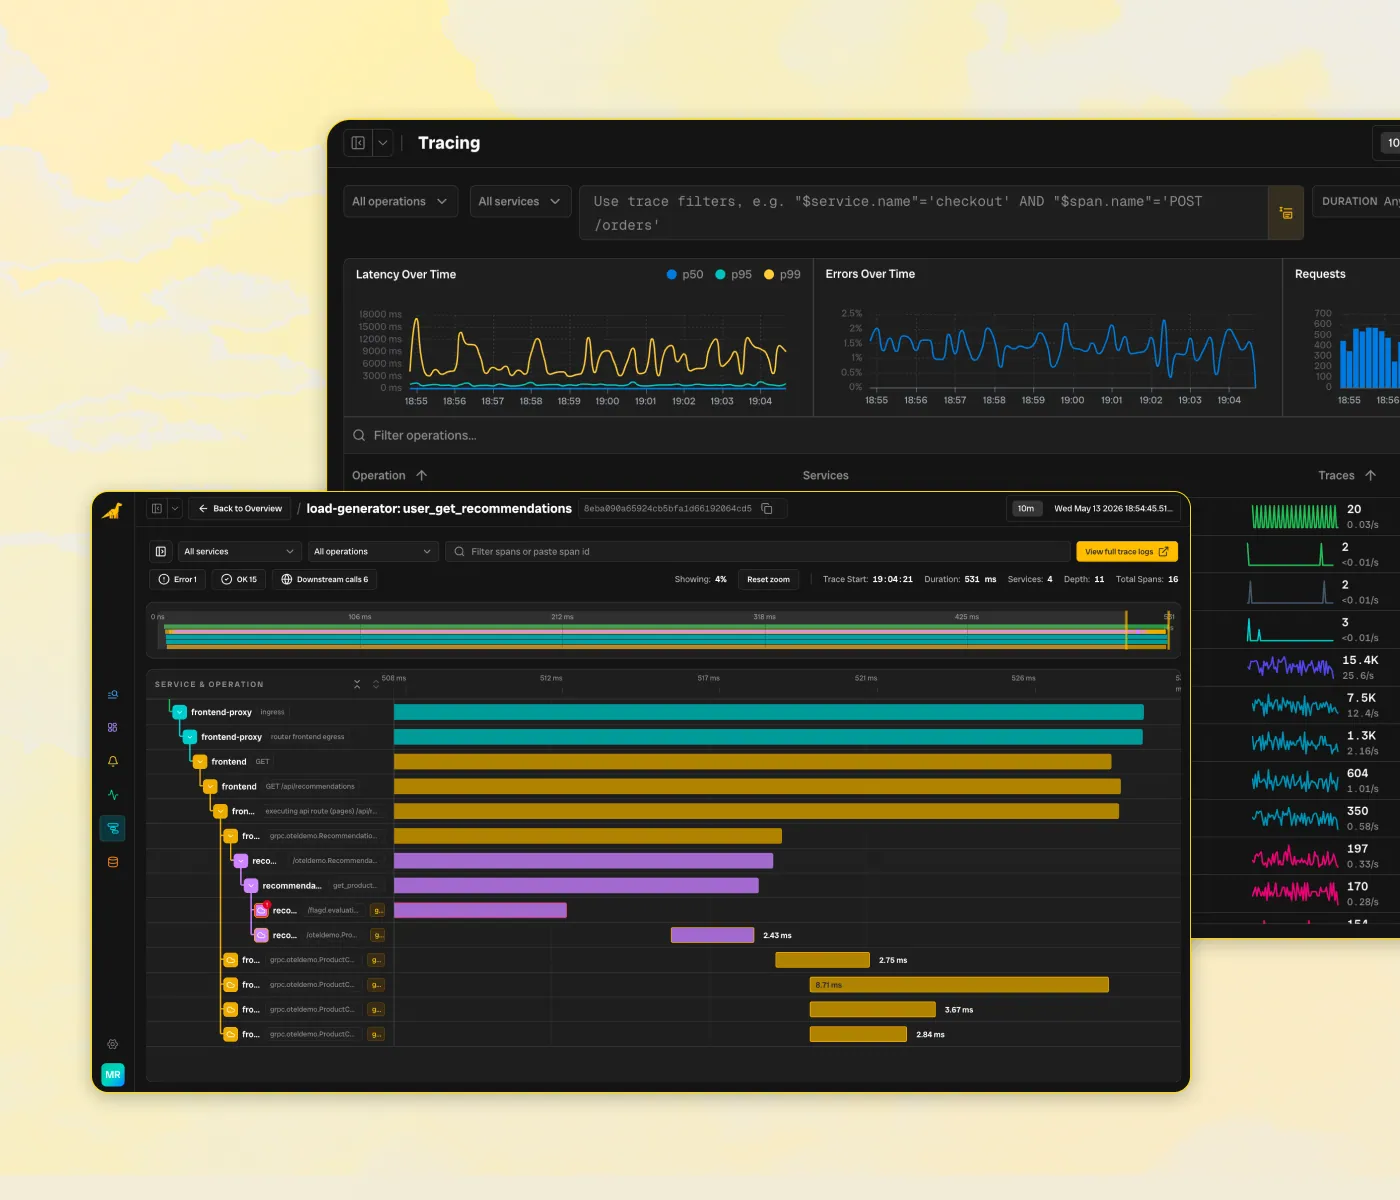
Bronto now has a full tracing experience with spans, latency and error trends over time, and drill-downs. Traces and logs are bidirectionally correlated so you can jump seamlessly from a span to its logs and back.
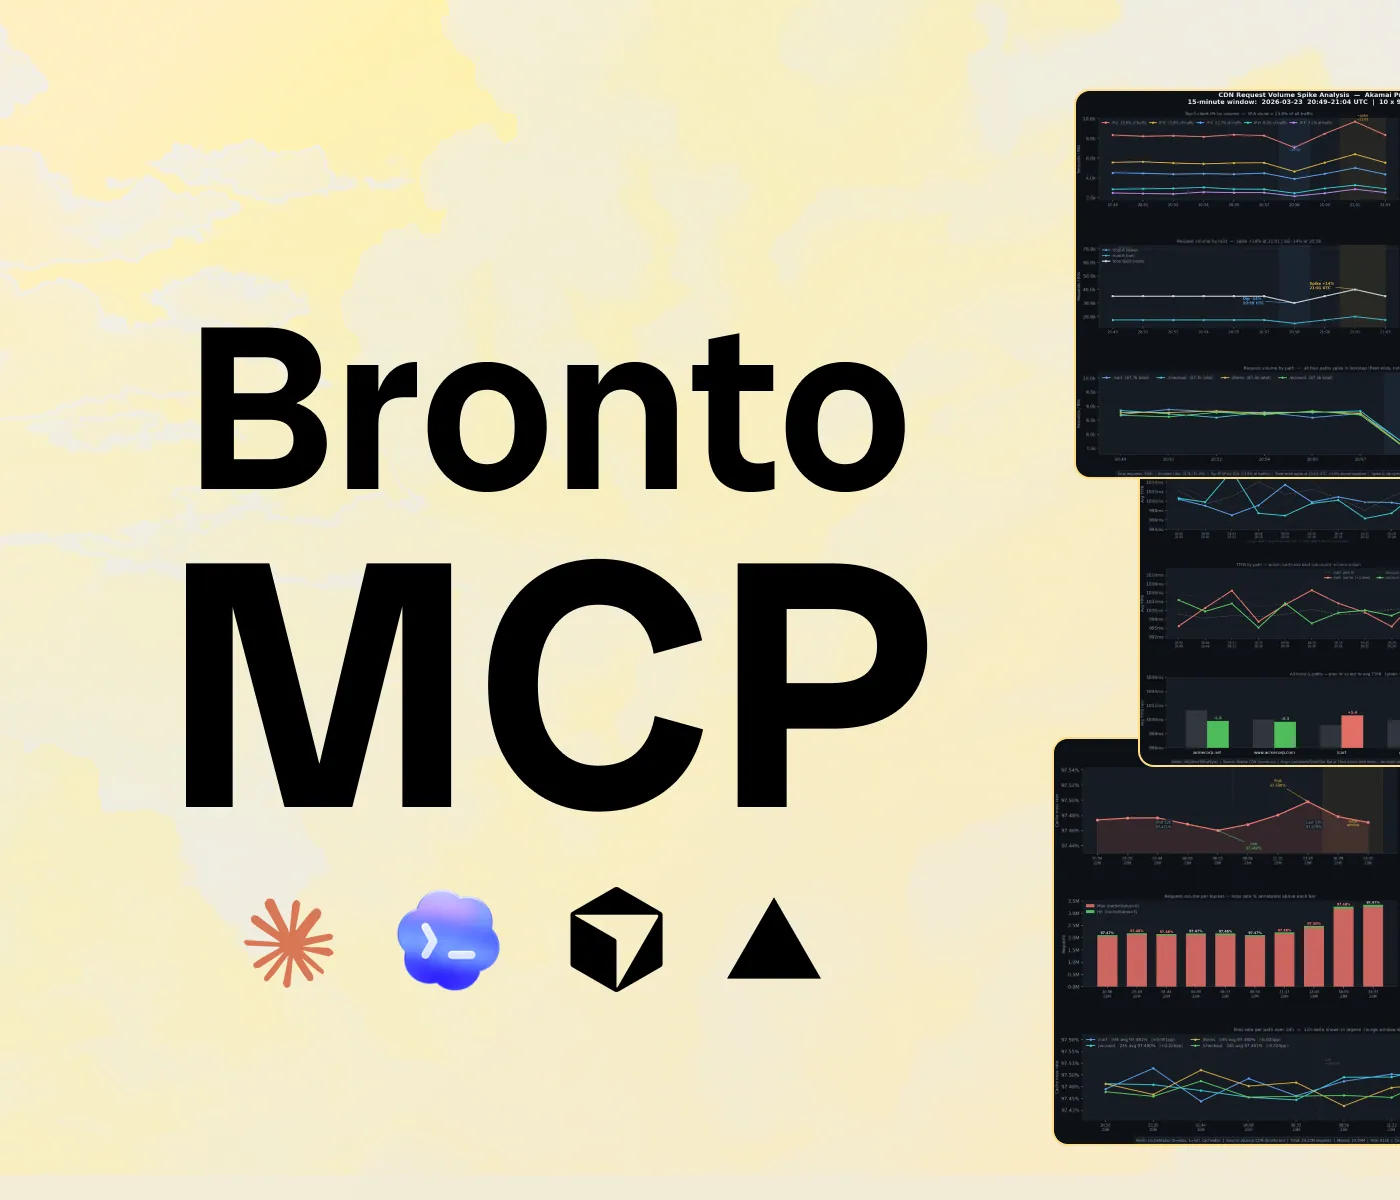
Connect Claude Code, Codex, Cursor, Vercel, or any MCP-compatible client to Bronto in seconds — no local setup required.
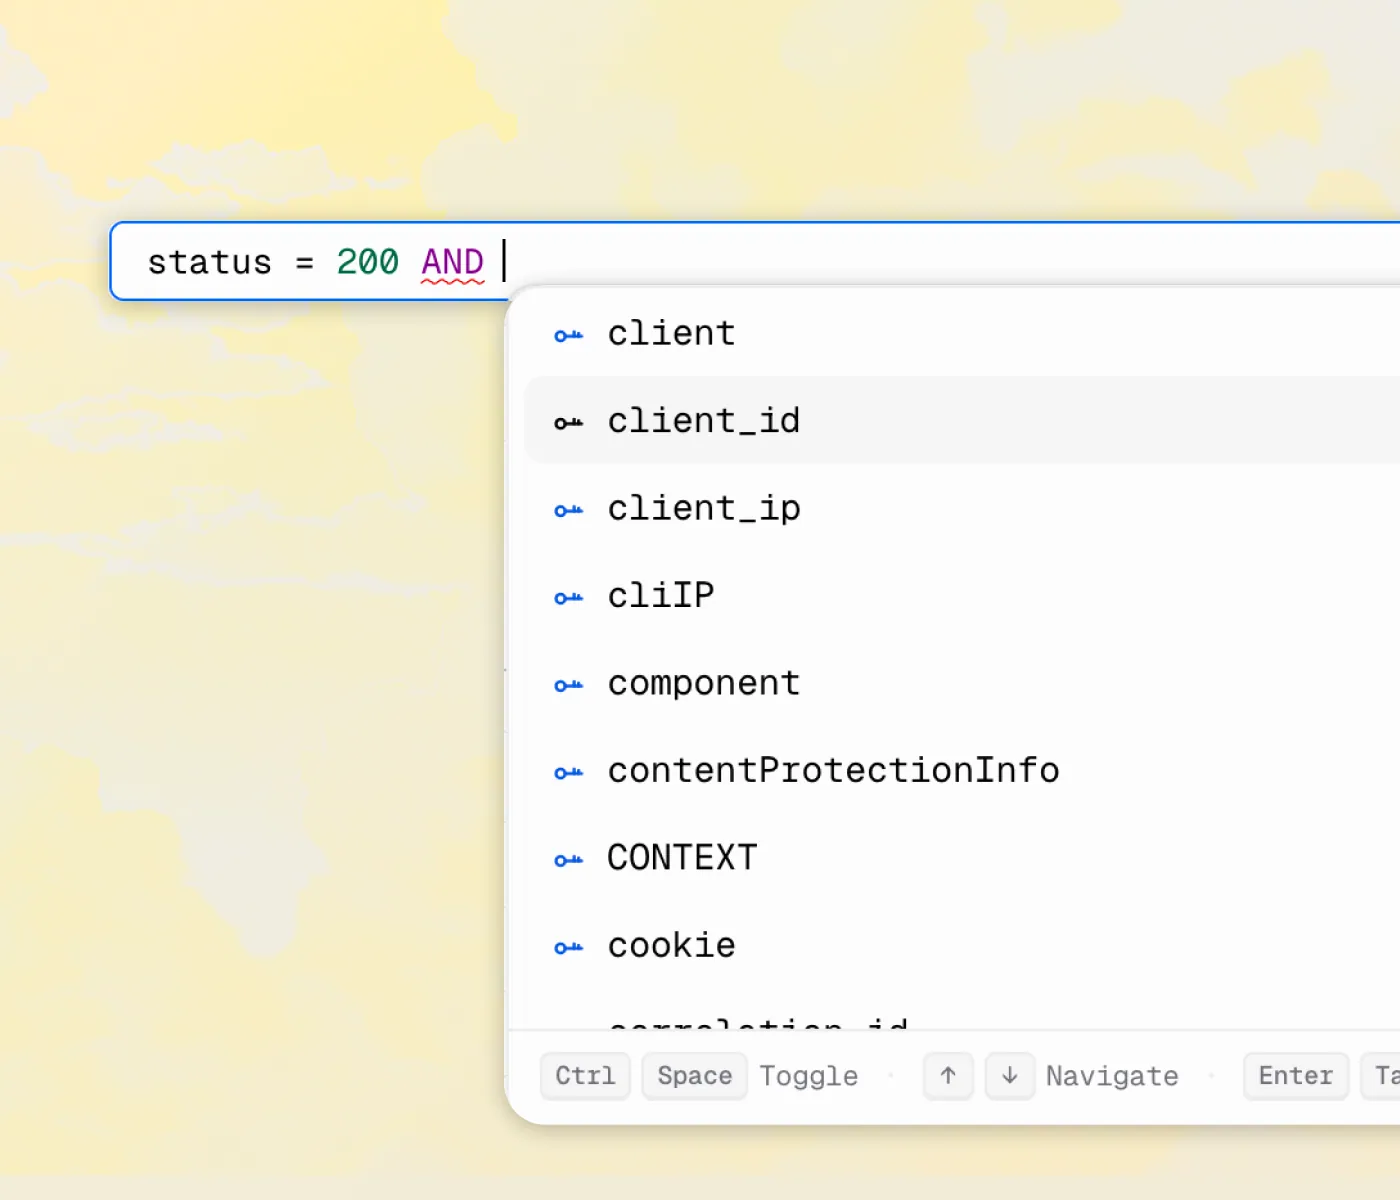
We unified the smart builder and search into a single SQL-powered mode with autocomplete and keyboard shortcuts, making filtering across the platform faster and smoother.
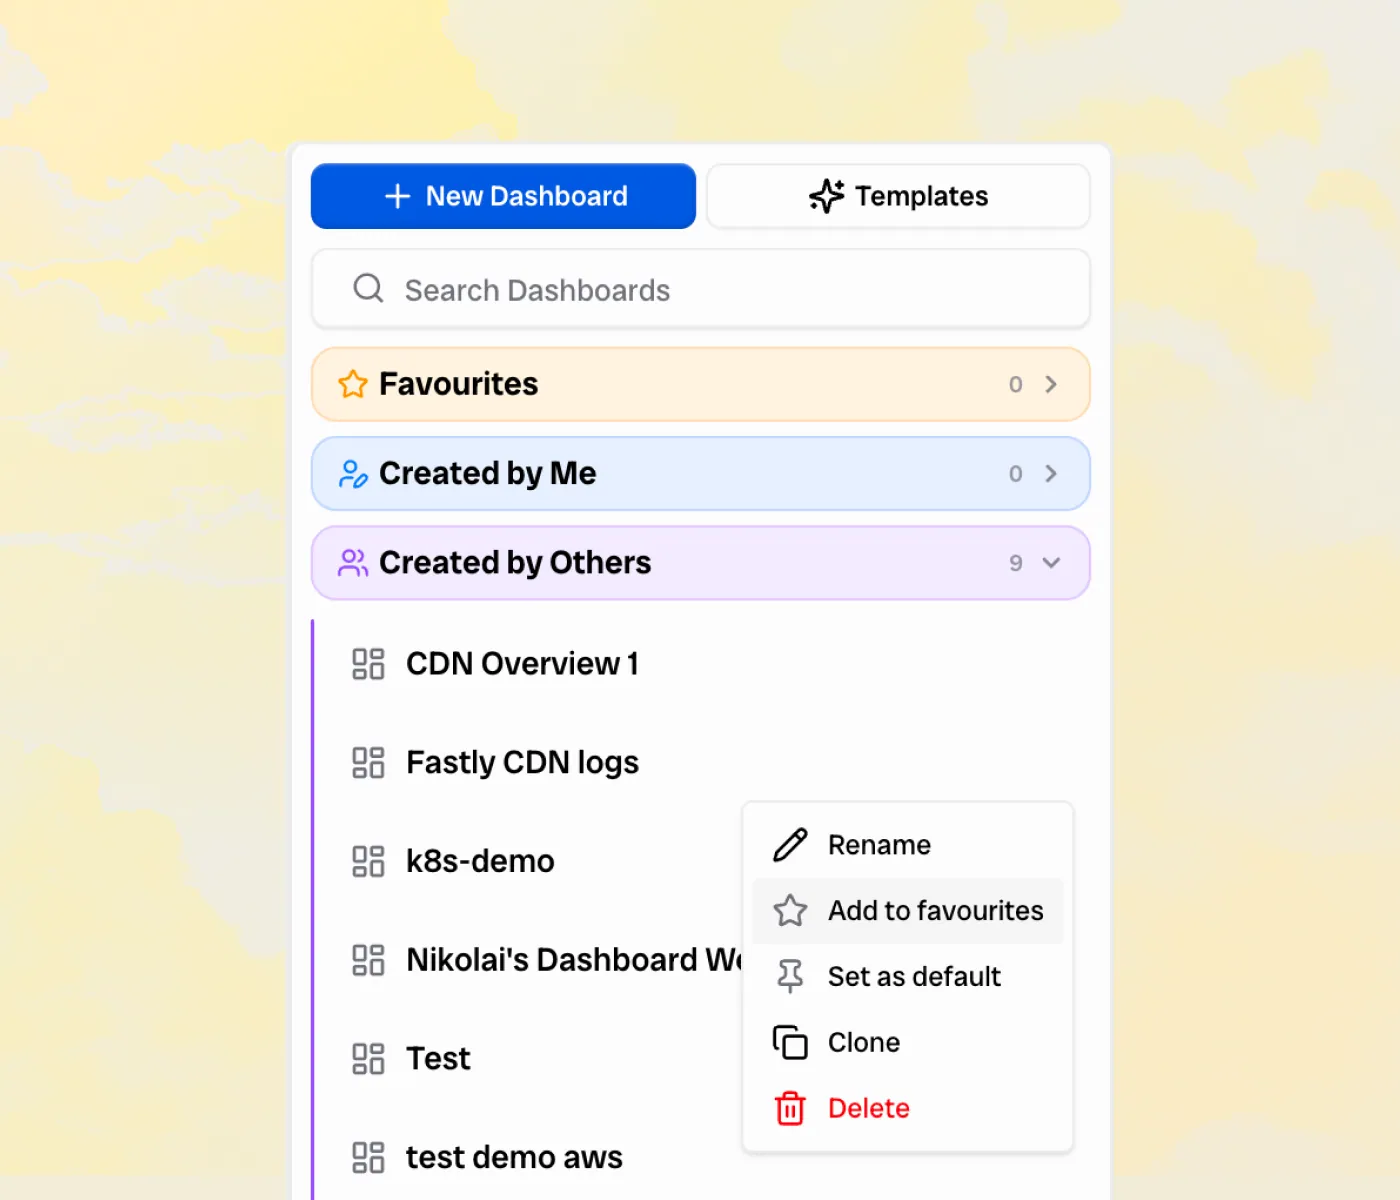
A new way to navigate everything you build in Bronto — favorite logs, dashboards, and alerts, and set defaults so the things you use most are always one click away.
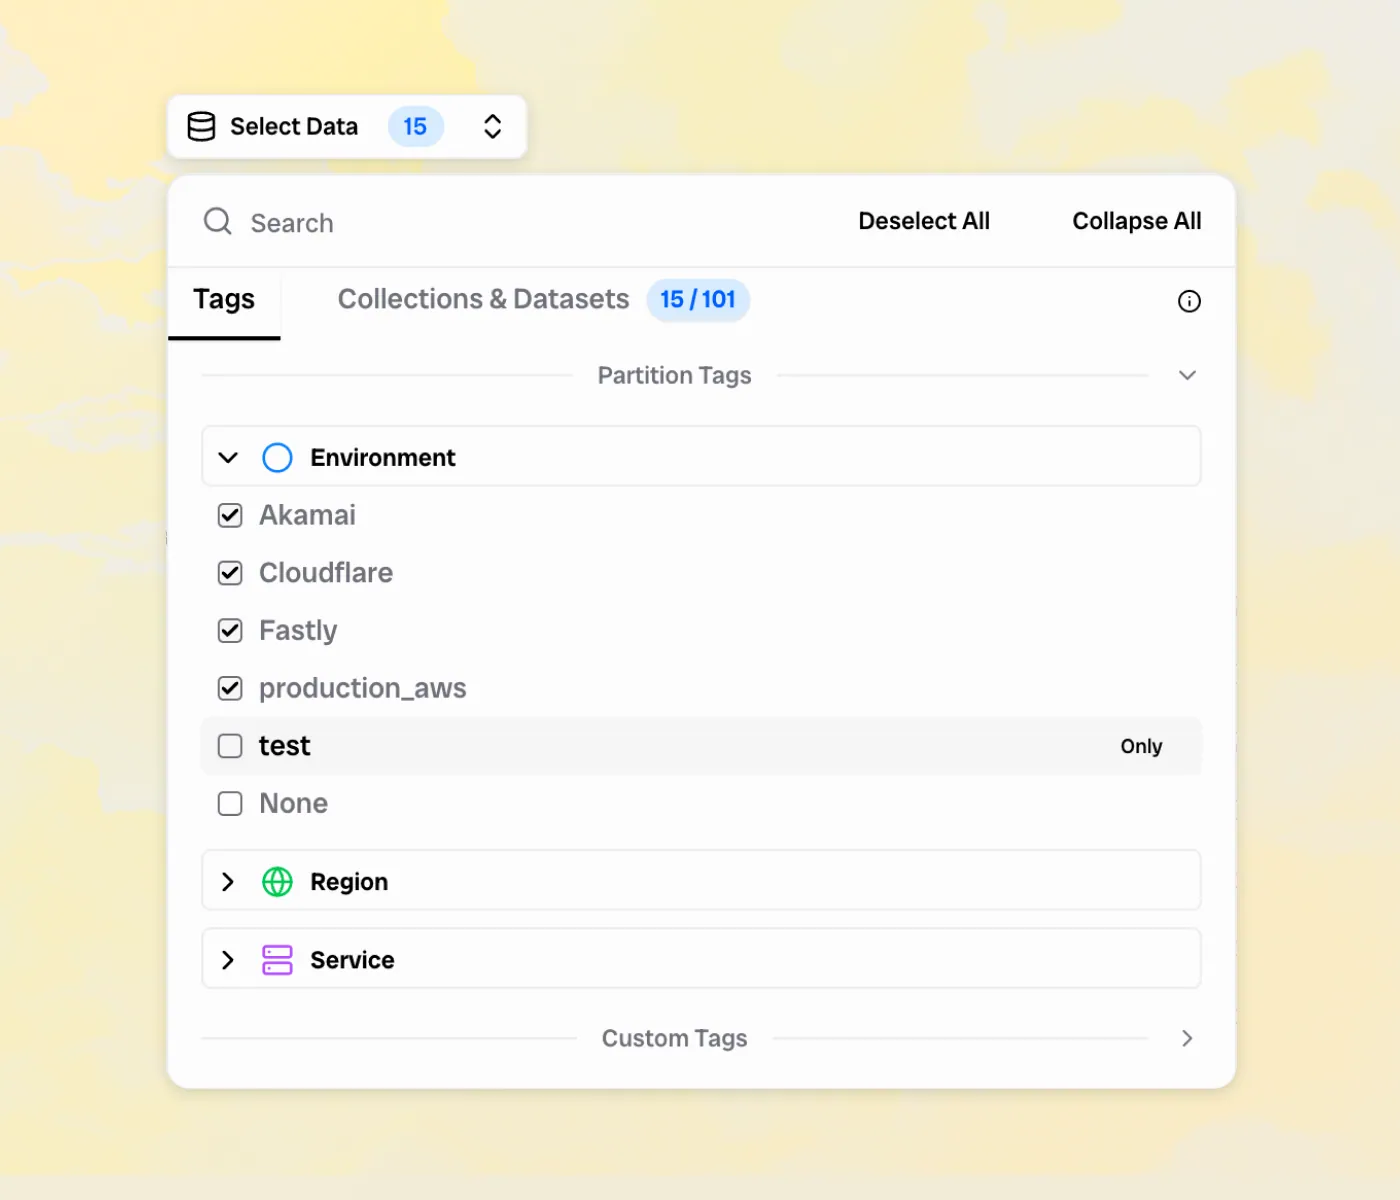
Bronto automatically organizes incoming log data behind the scenes, so searches stay fast without you defining schemas, partition keys, or worrying about cardinality.
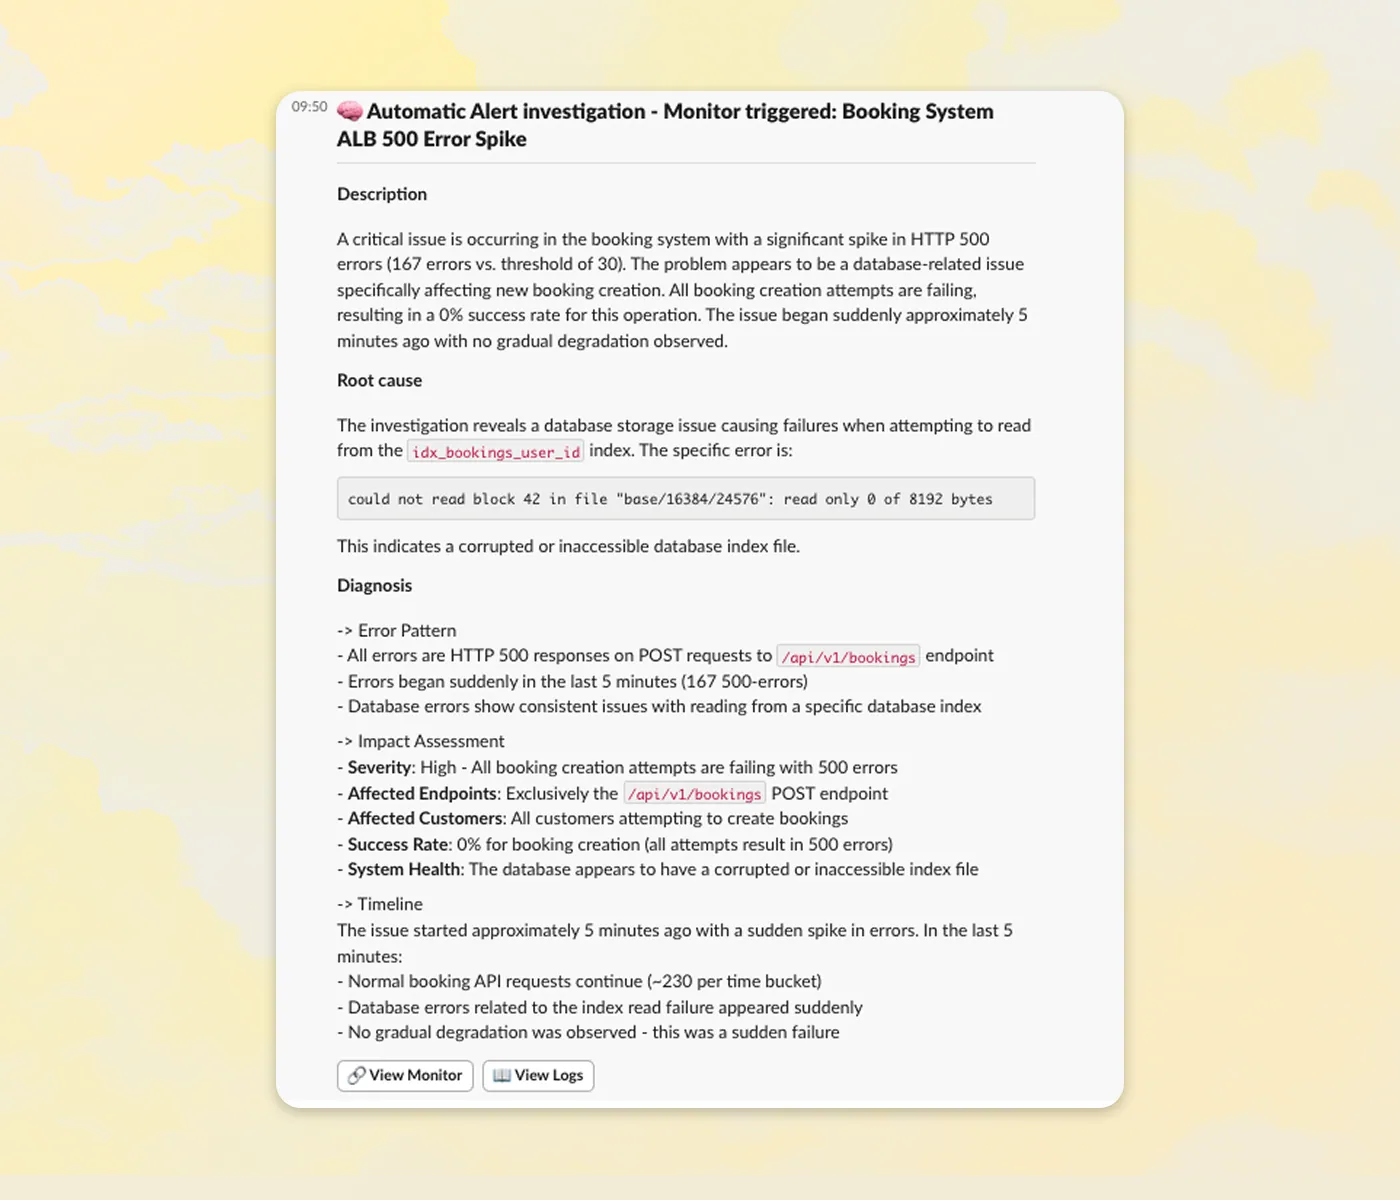
When an alert fires, Bronto uses an LLM to query the relevant logs and generate a detailed report with likely causes and next steps.
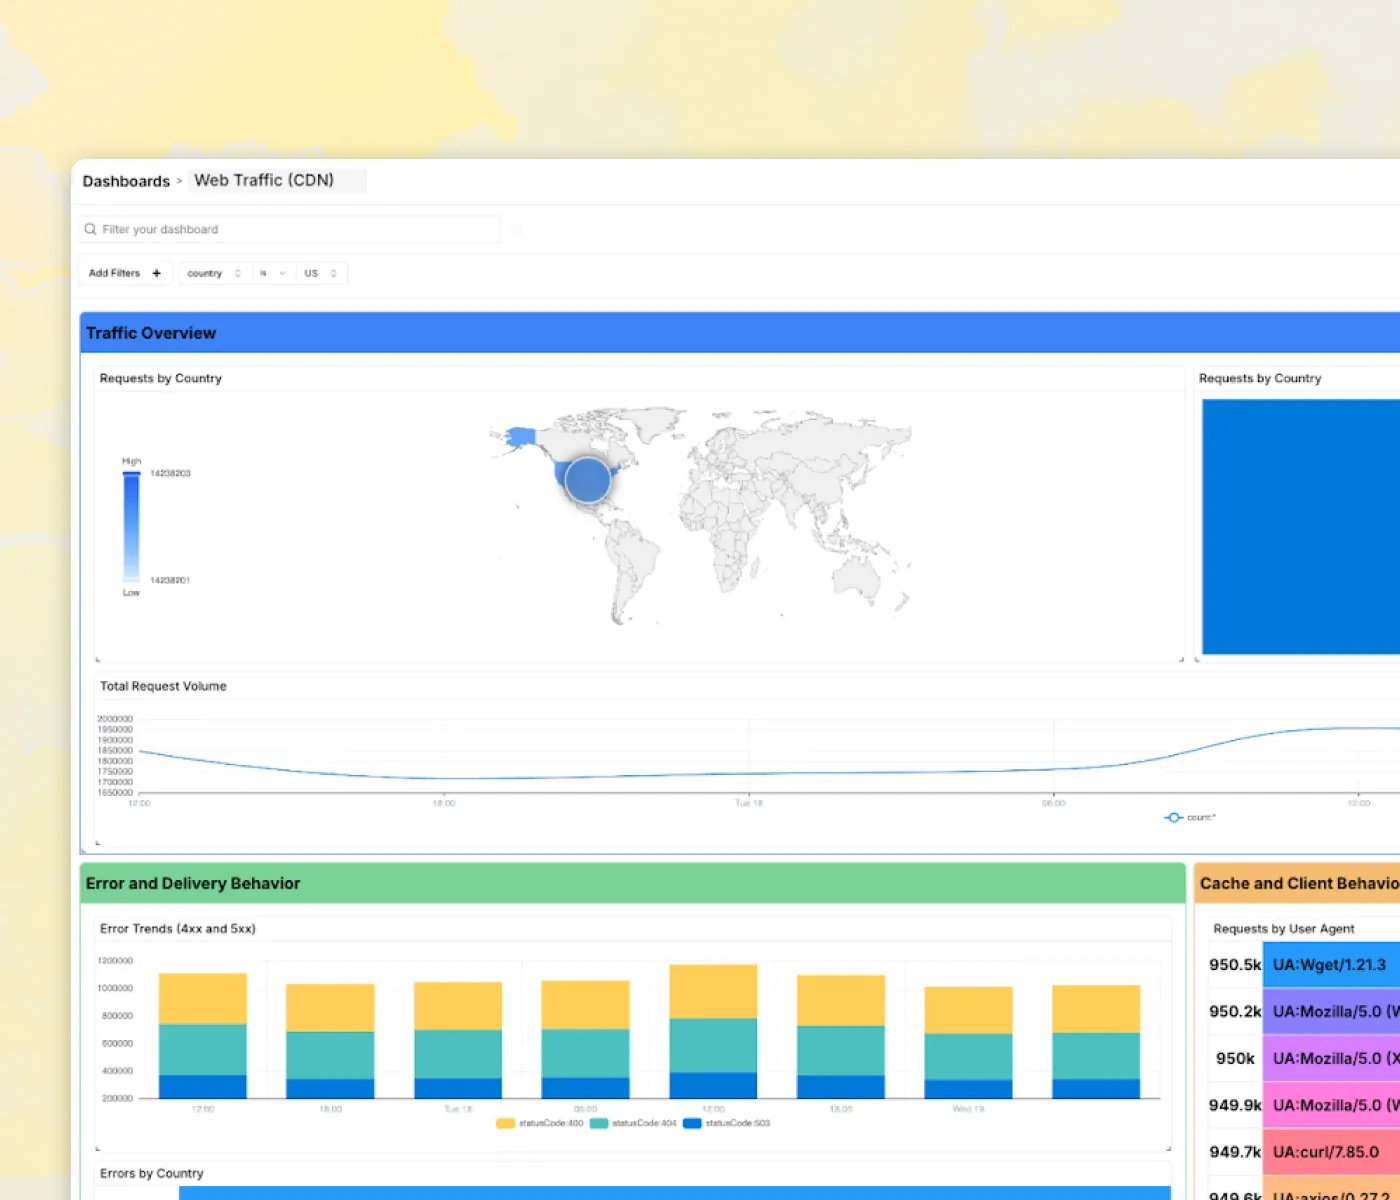
Apply a single query filter across every widget on a dashboard to quickly slice data, isolate environments, and spot trends.
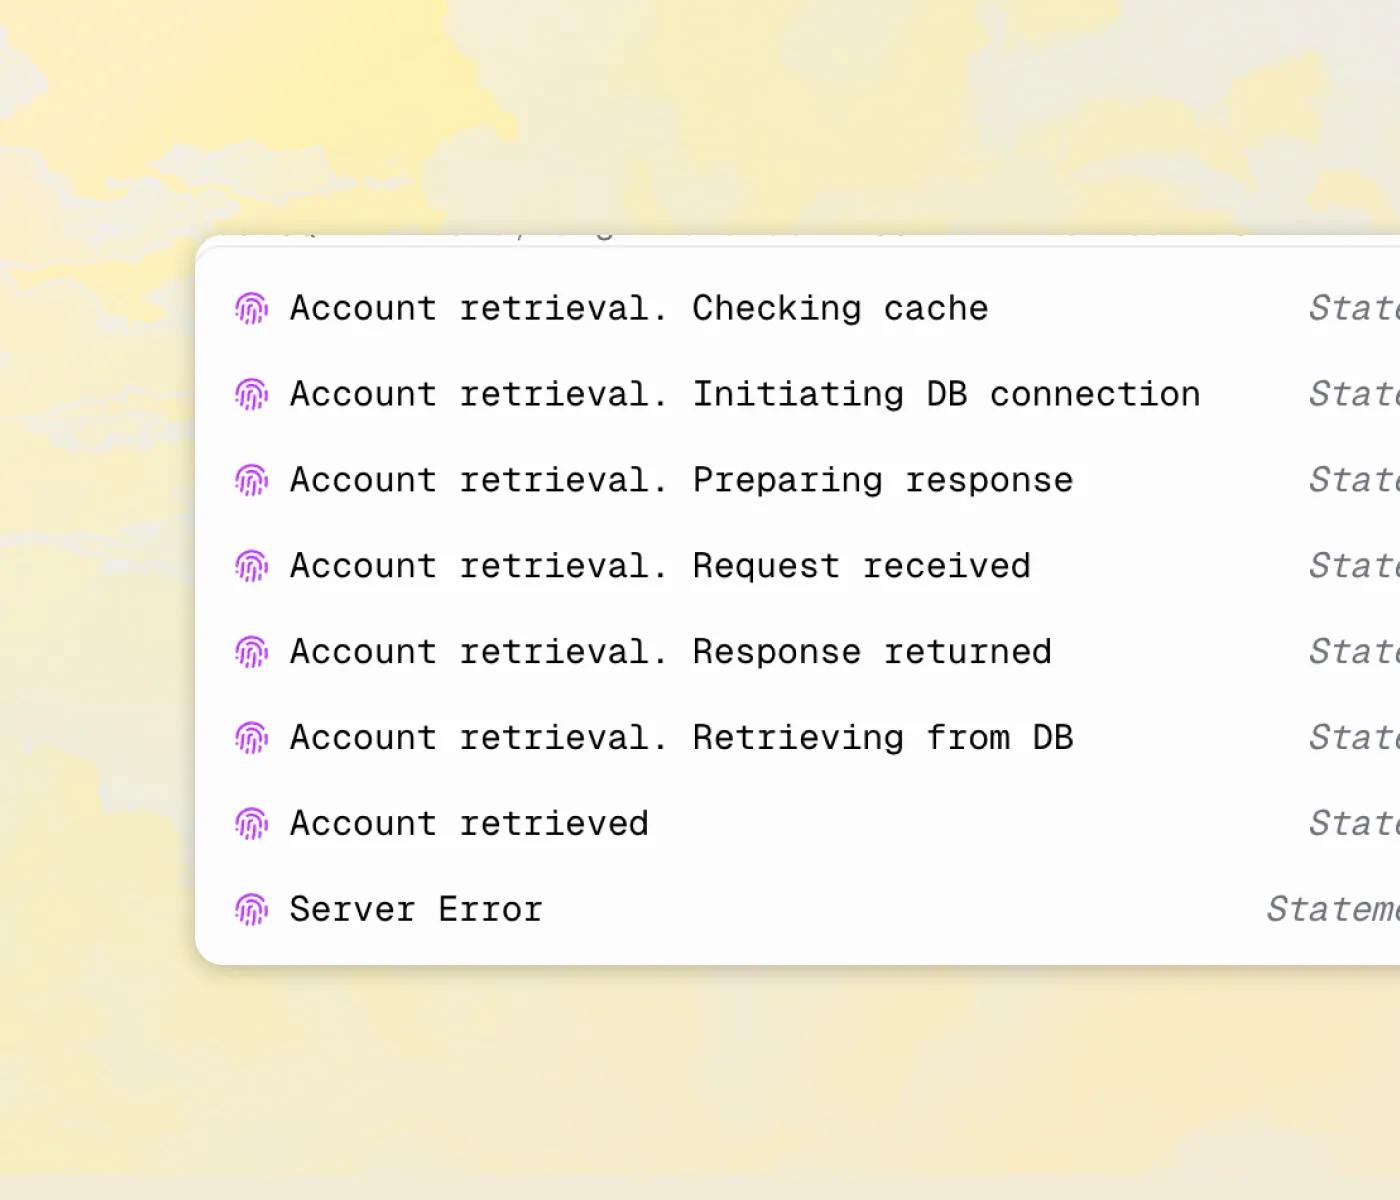
Statement IDs link every log event back to the exact line of source code that produced it, so you can jump straight from a log to the code.
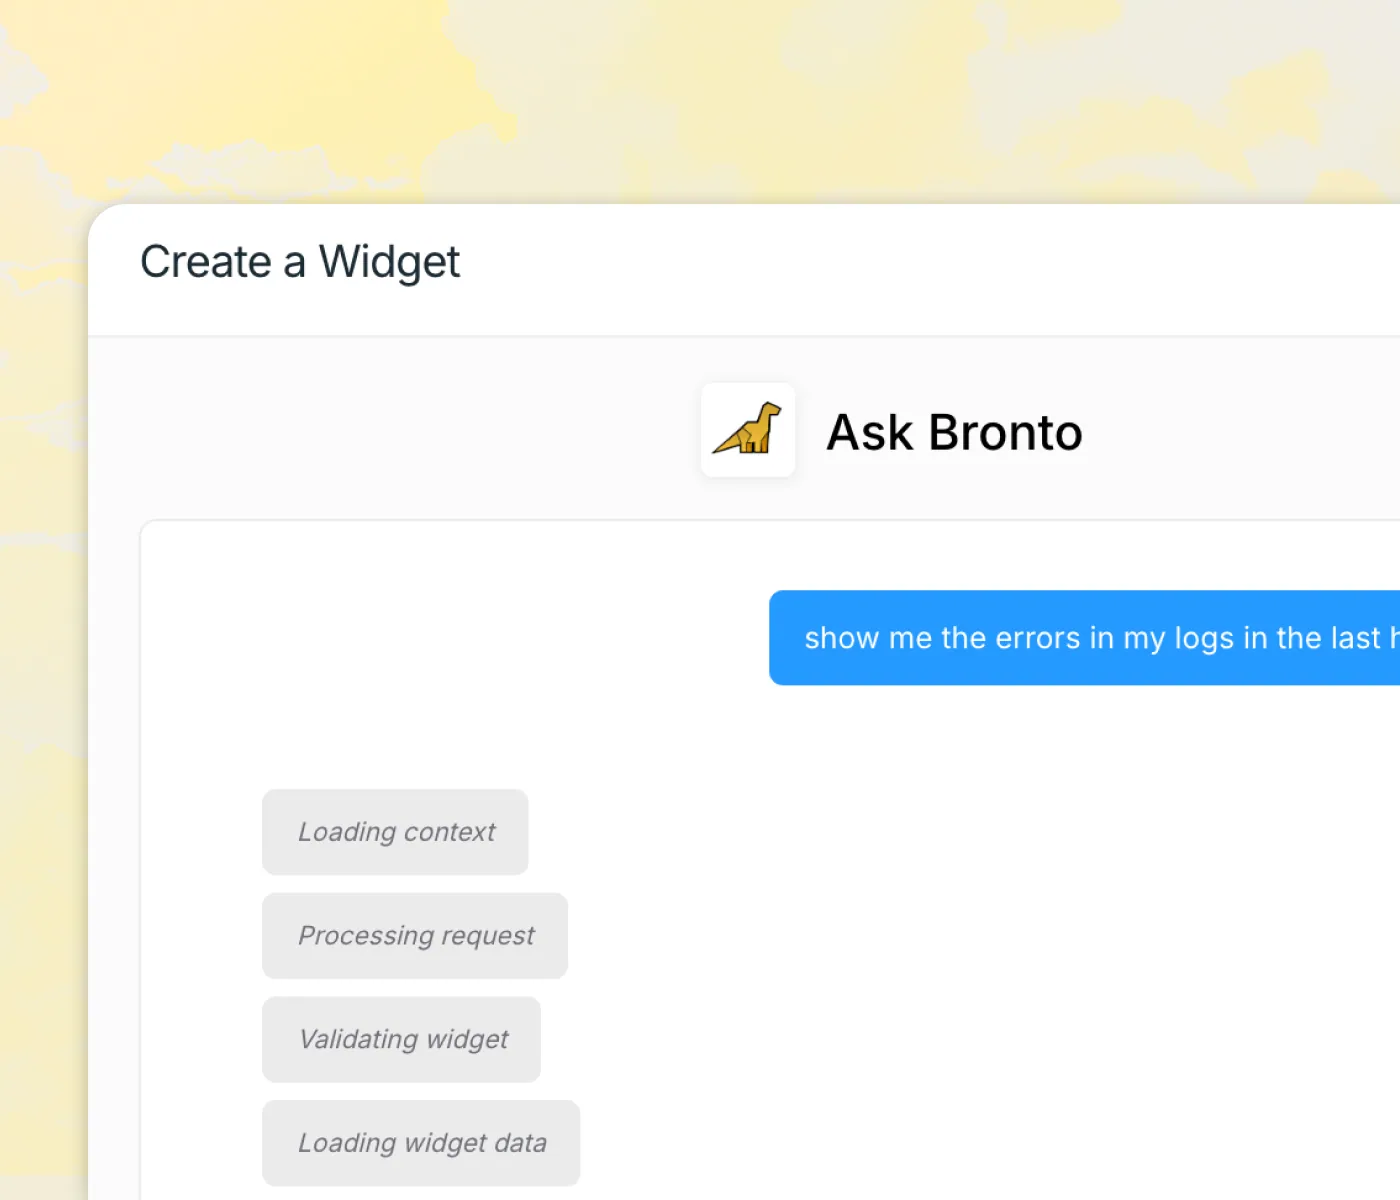
Describe the chart you want in plain English and Bronto builds the widget for you — query, visualization, name, and description included.

Local MCP exposes your Bronto logs to AI agents like Claude Code, so they can search telemetry and act on warnings without leaving your editor.
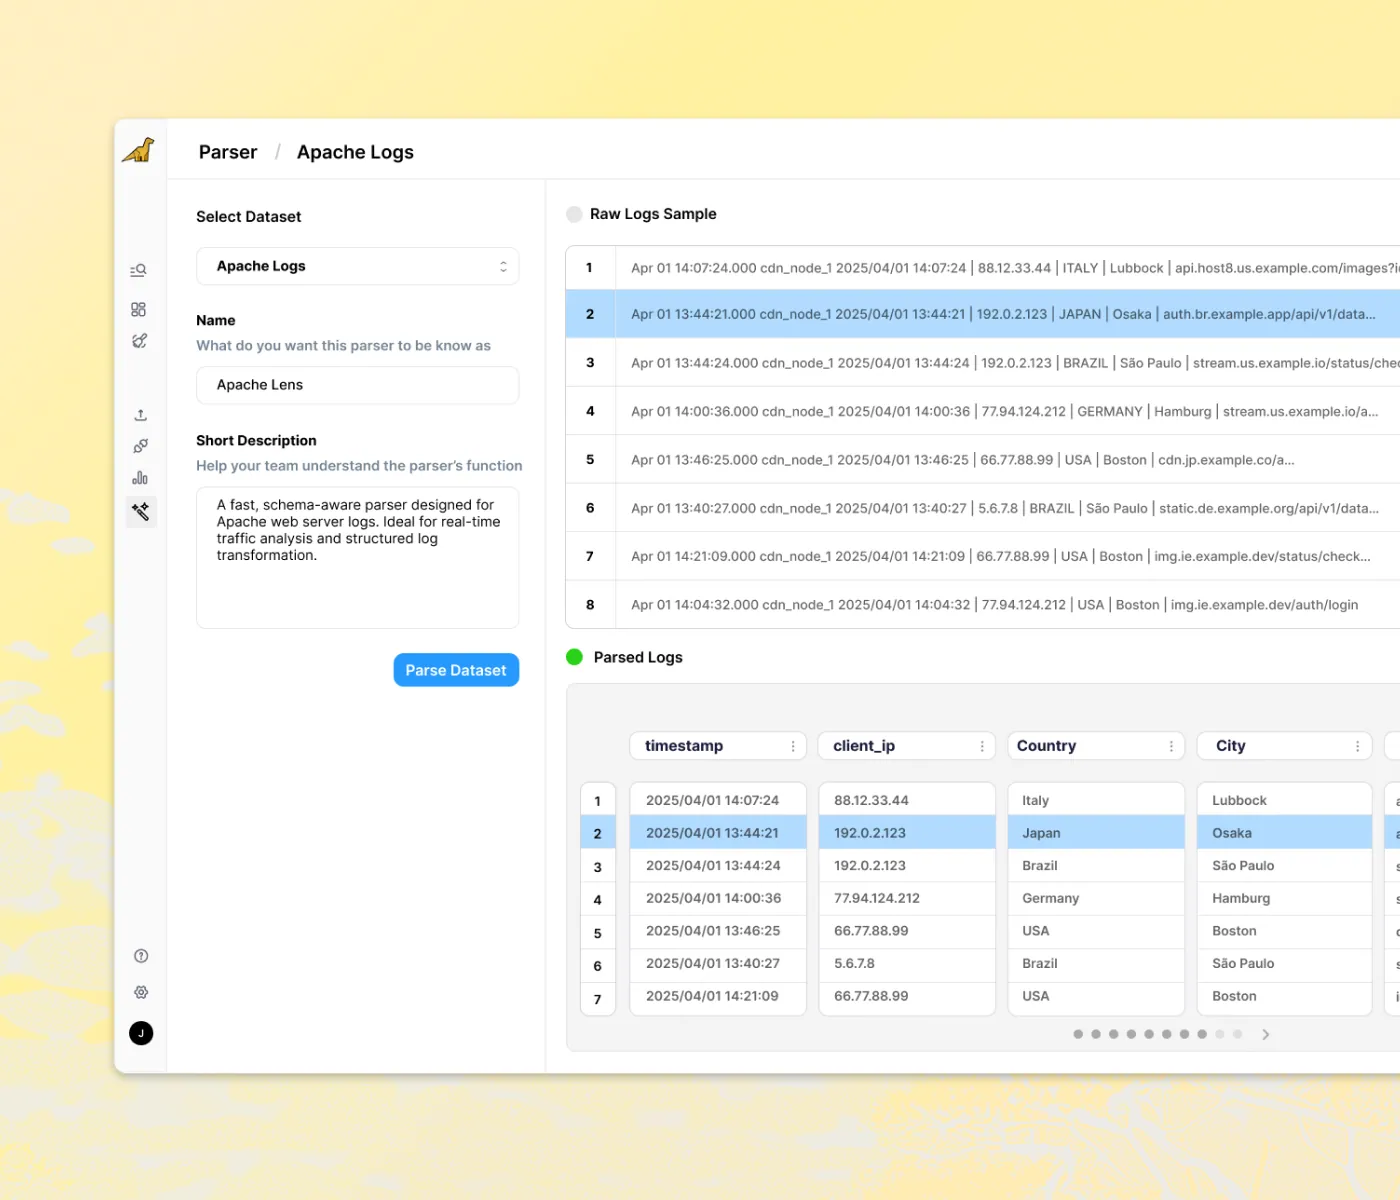
Build, configure, and manage parsers that extract structured data from raw logs, transforming unstructured text into queryable, analyzable log events. Visit our help docs for more here.
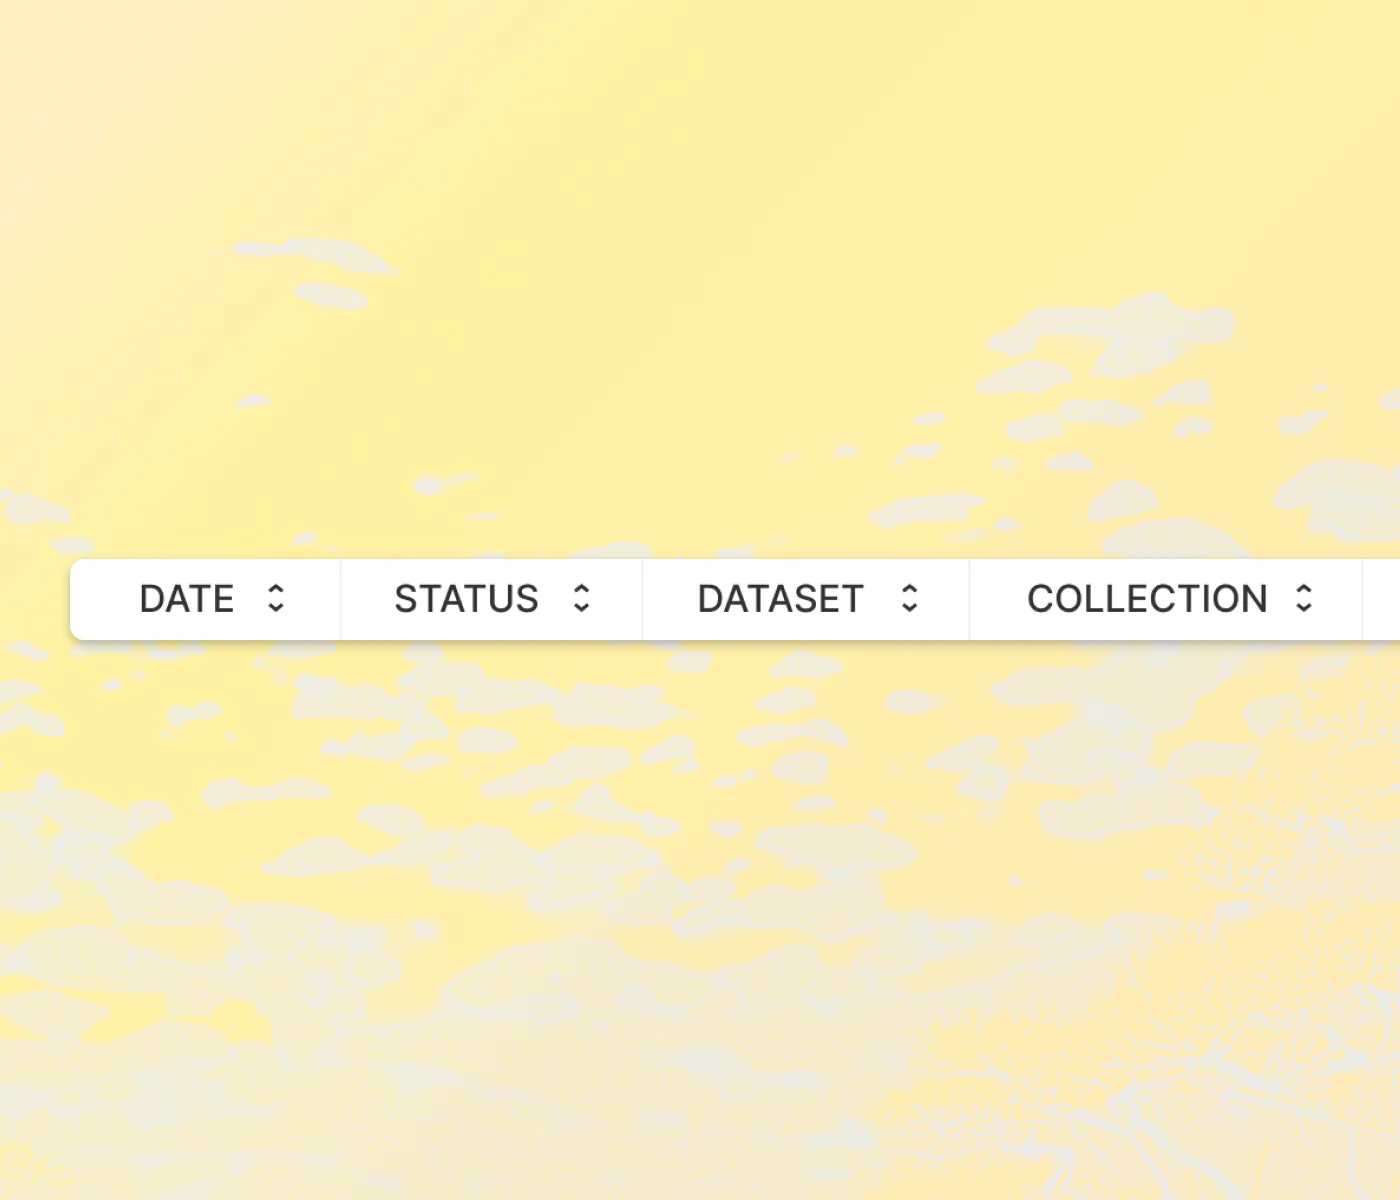
You can now sort events by column in the "List of Events" view, in either ascending or descending order. Events will display in the selected sort order. Visit our help docs for more here.
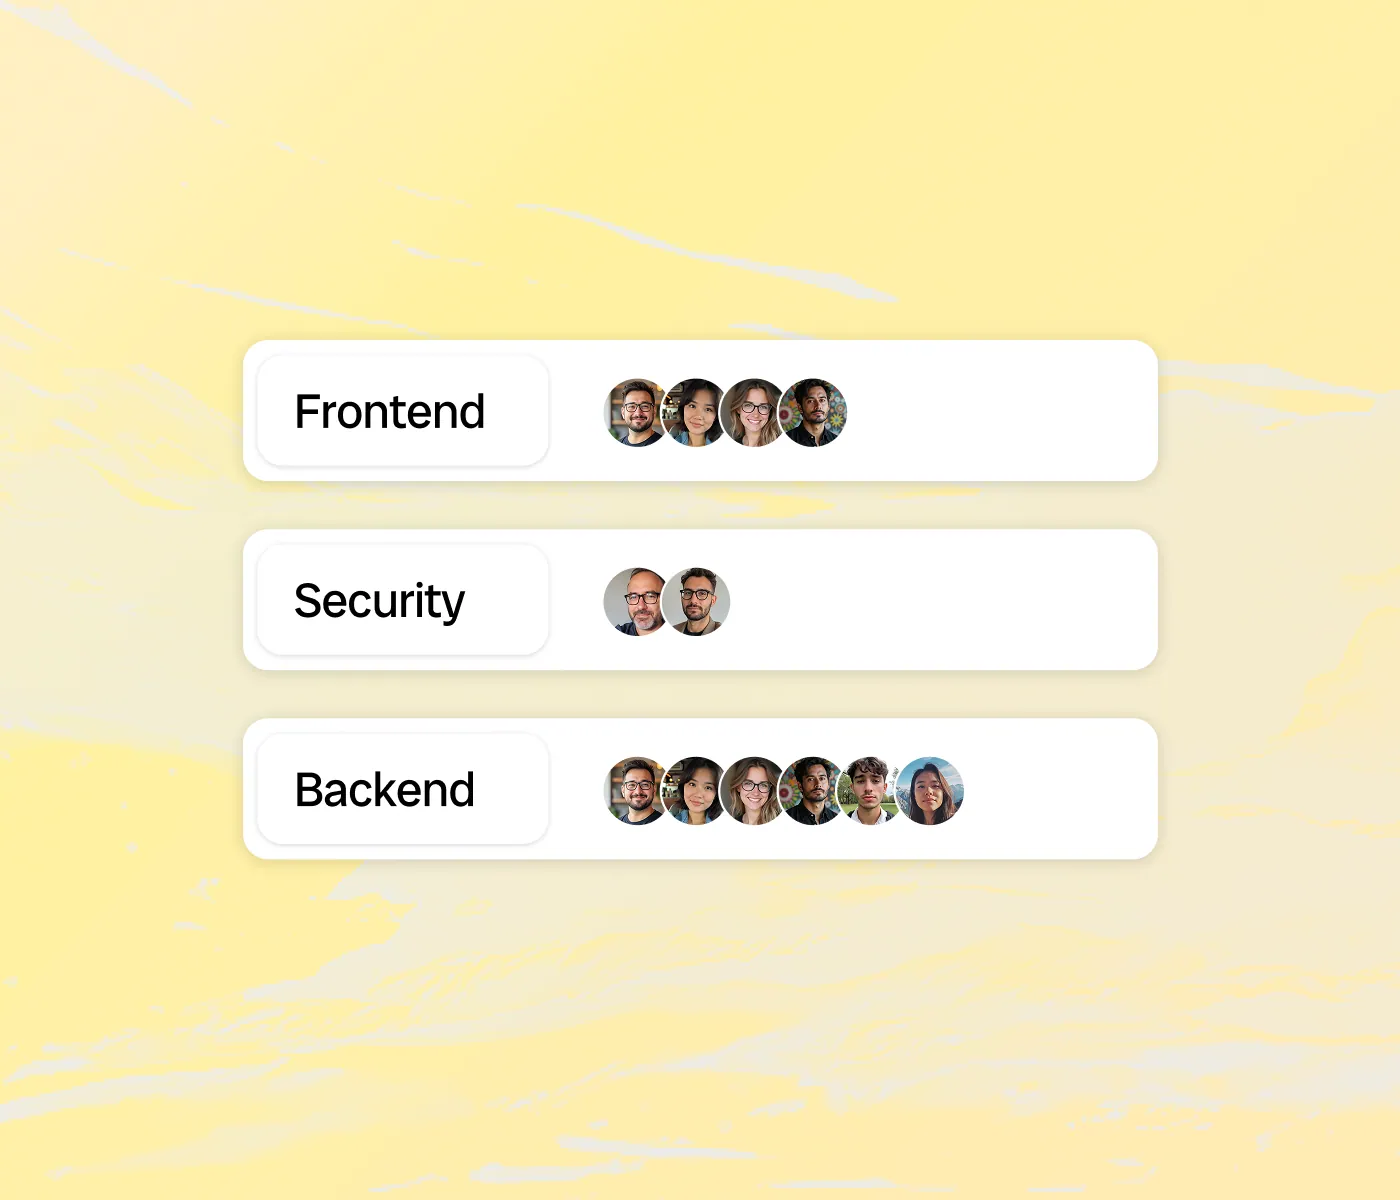
Create a new team to organize users and manage permissions. Visit our help docs for more here.
Assign select datasets to a given team.
You can now set a monthly ingestion limit (in Bytes, GB, TB, etc.). This limit will be reflected in the Usage Explorer to help you monitor and highlight your team's data consumption.
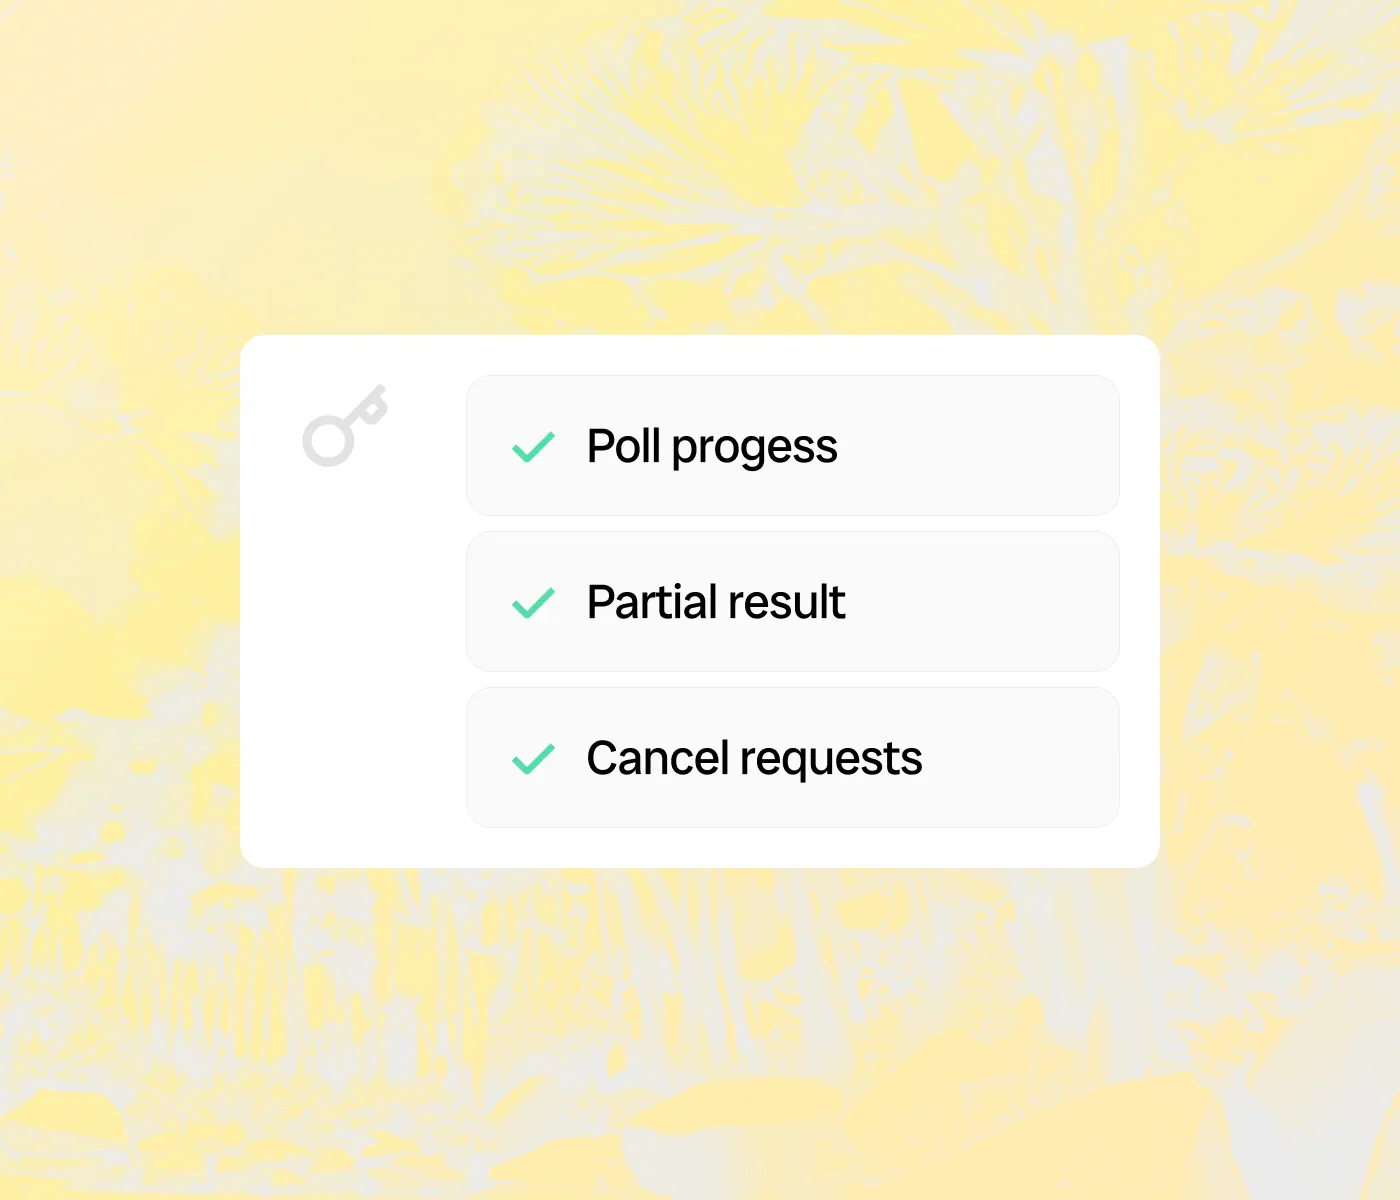
Added async API support for long-running queries. Clients can poll progress, receive partial results, and cancel requests. Improves resilience to timeouts and network interruptions.
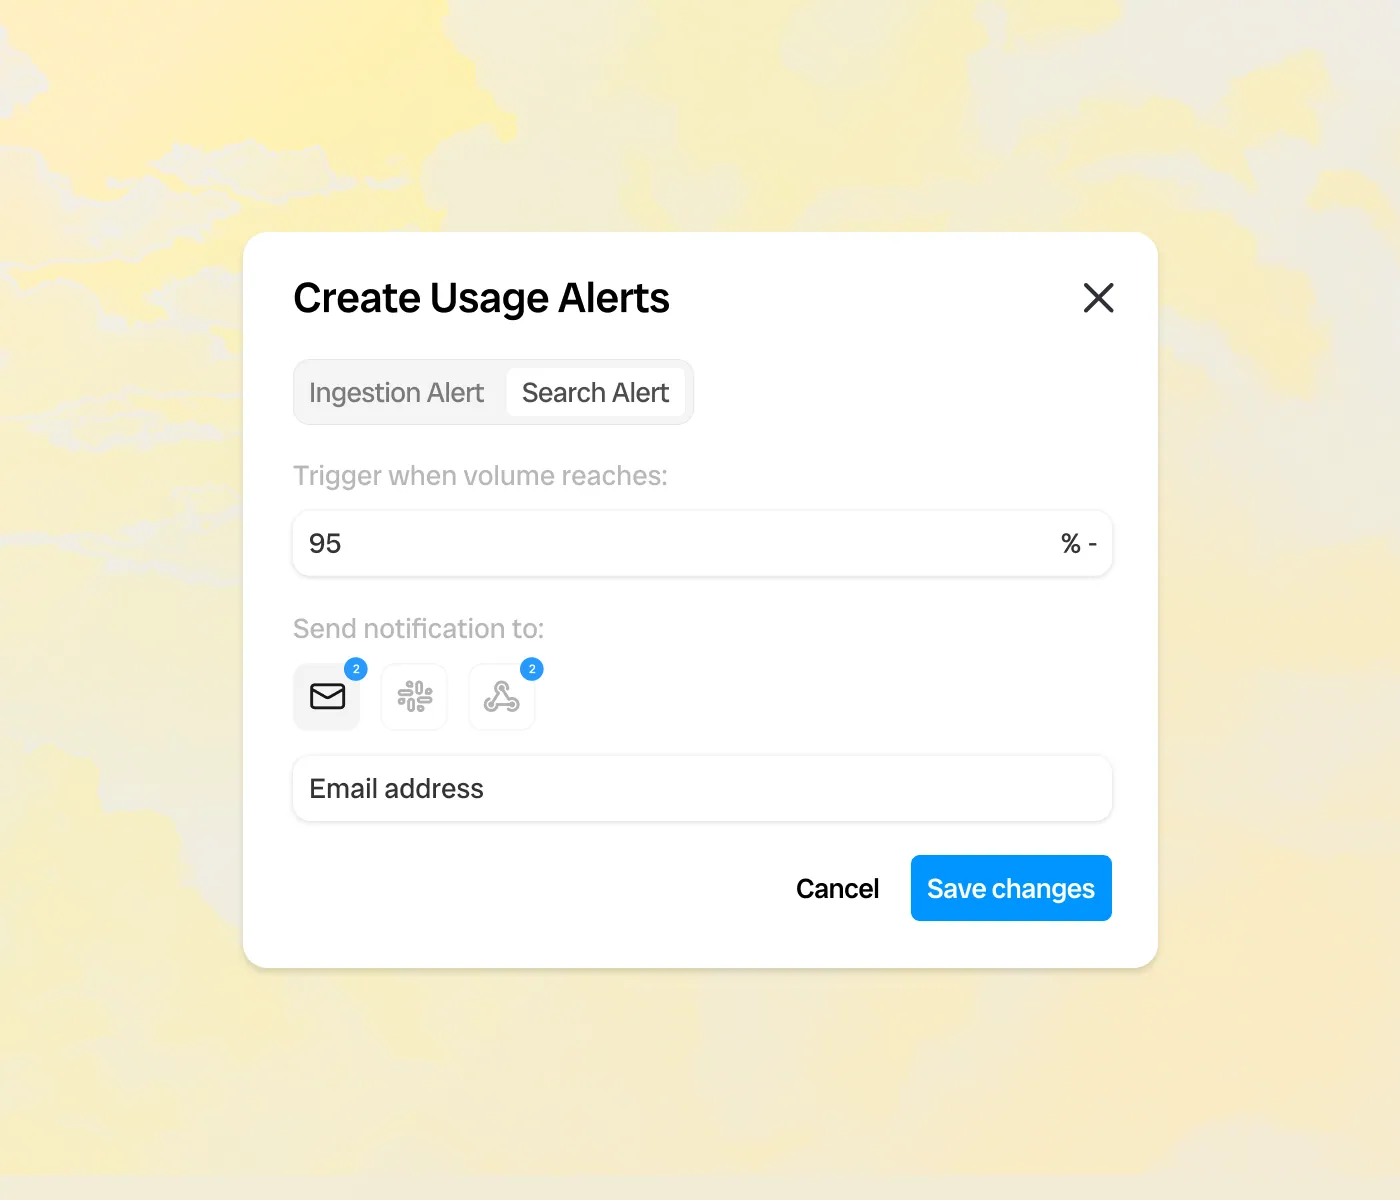
Create an alert based on your monthly Search or Ingestion usage. Alerts can be triggered if you exceed the chosen threshold for the current month.
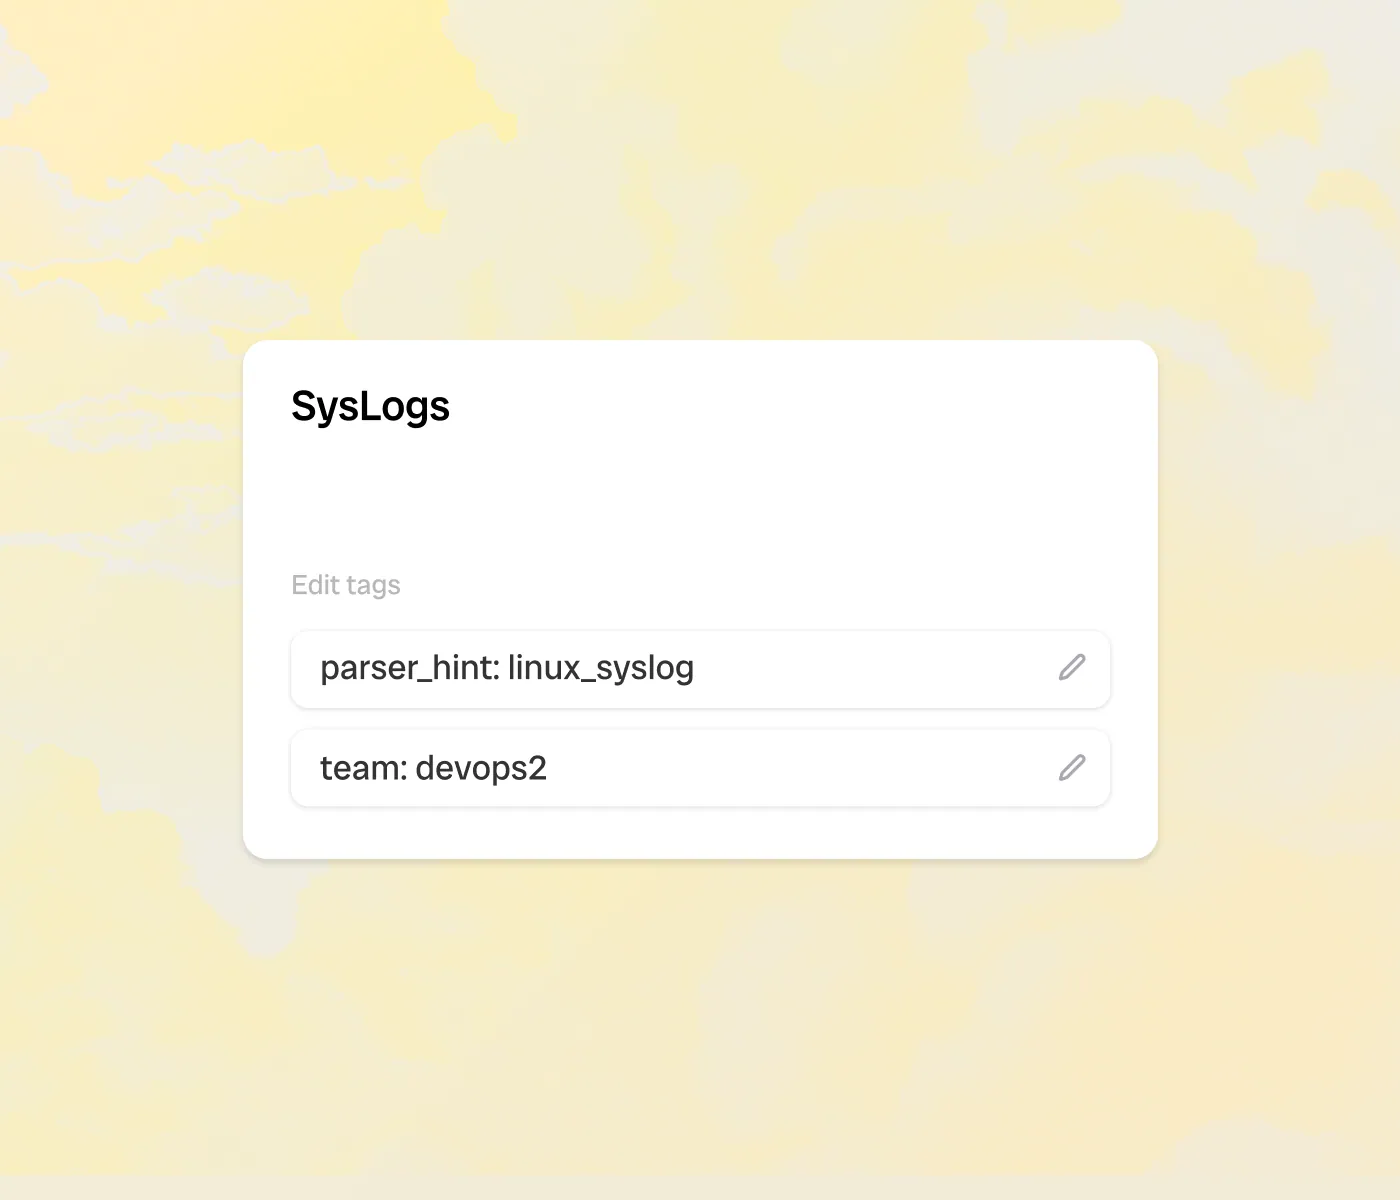
Use tags to categorize your datasets, enabling streamlined organization and advanced filtering capabilities across our usage analytics.
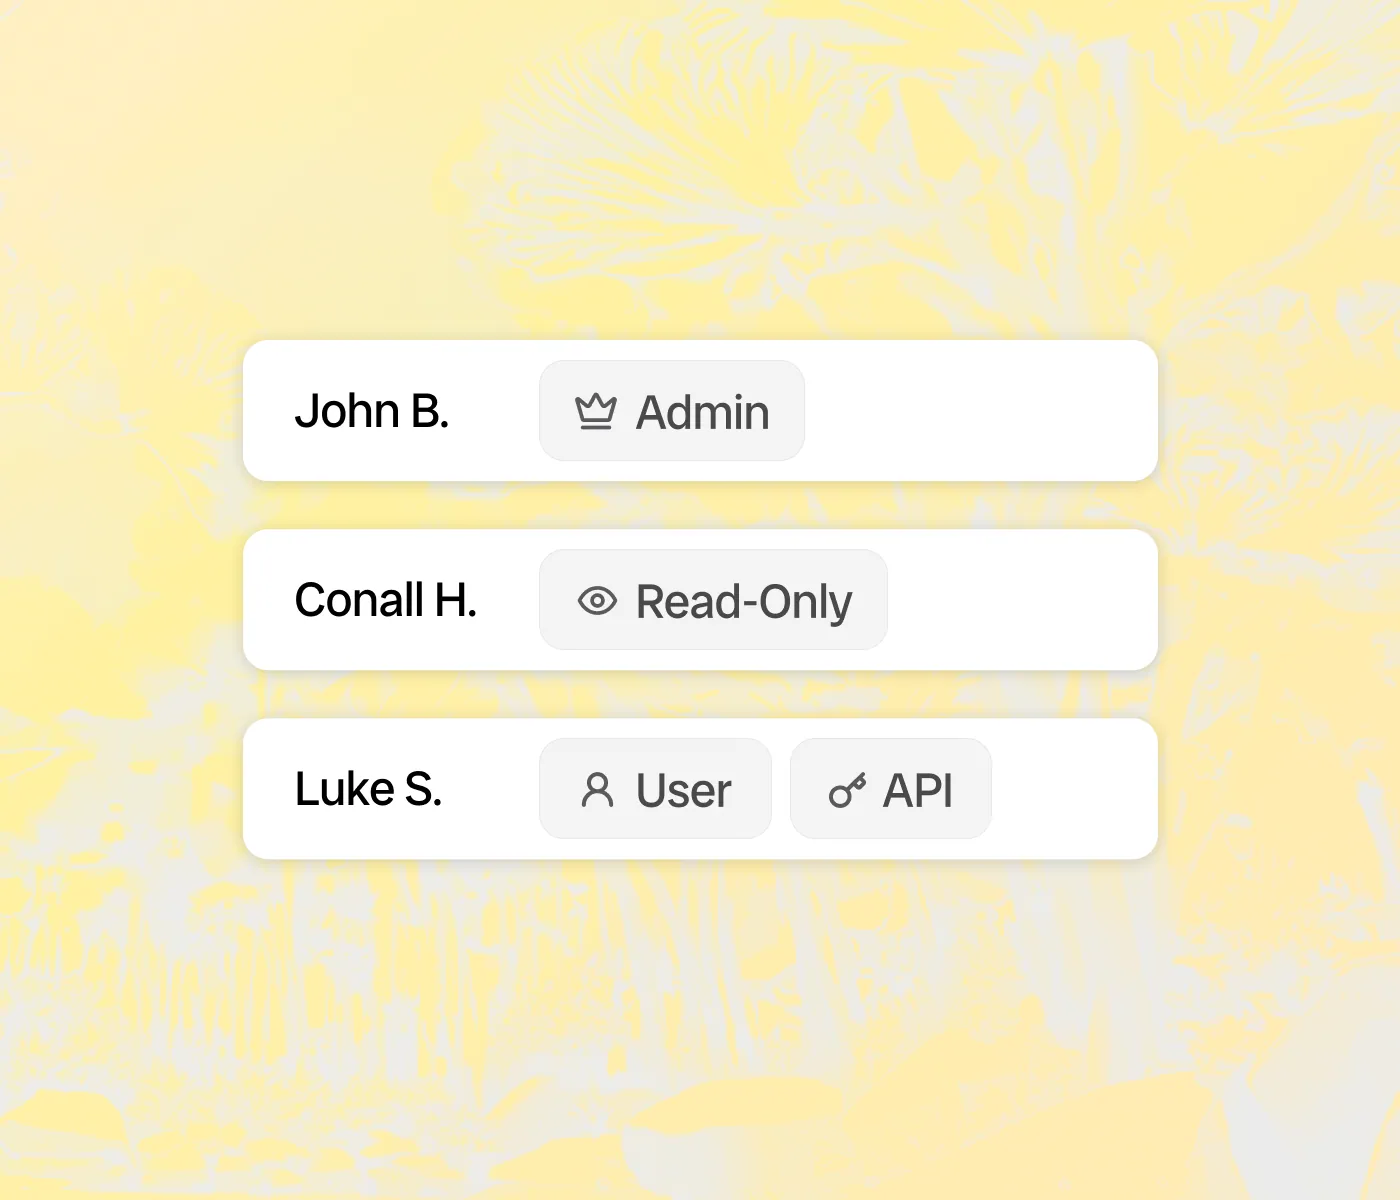
Custom Roles - Create and manage custom roles with granular permissions (create, read, update, and delete) across key capabilities such as Access Management, API keys, Dashboards, Monitors, and Datasets. Visit our help docs for more here.
Automatically mask PII data at search. You can enable PII masking in Bronto to hide any personal identifiable information that may be present in your log data. To enable PII masking you must create a custom role with the Read PII Data permission disabled, and associate the role with individual users. Users will see ******** in place of potentially sensitive information.
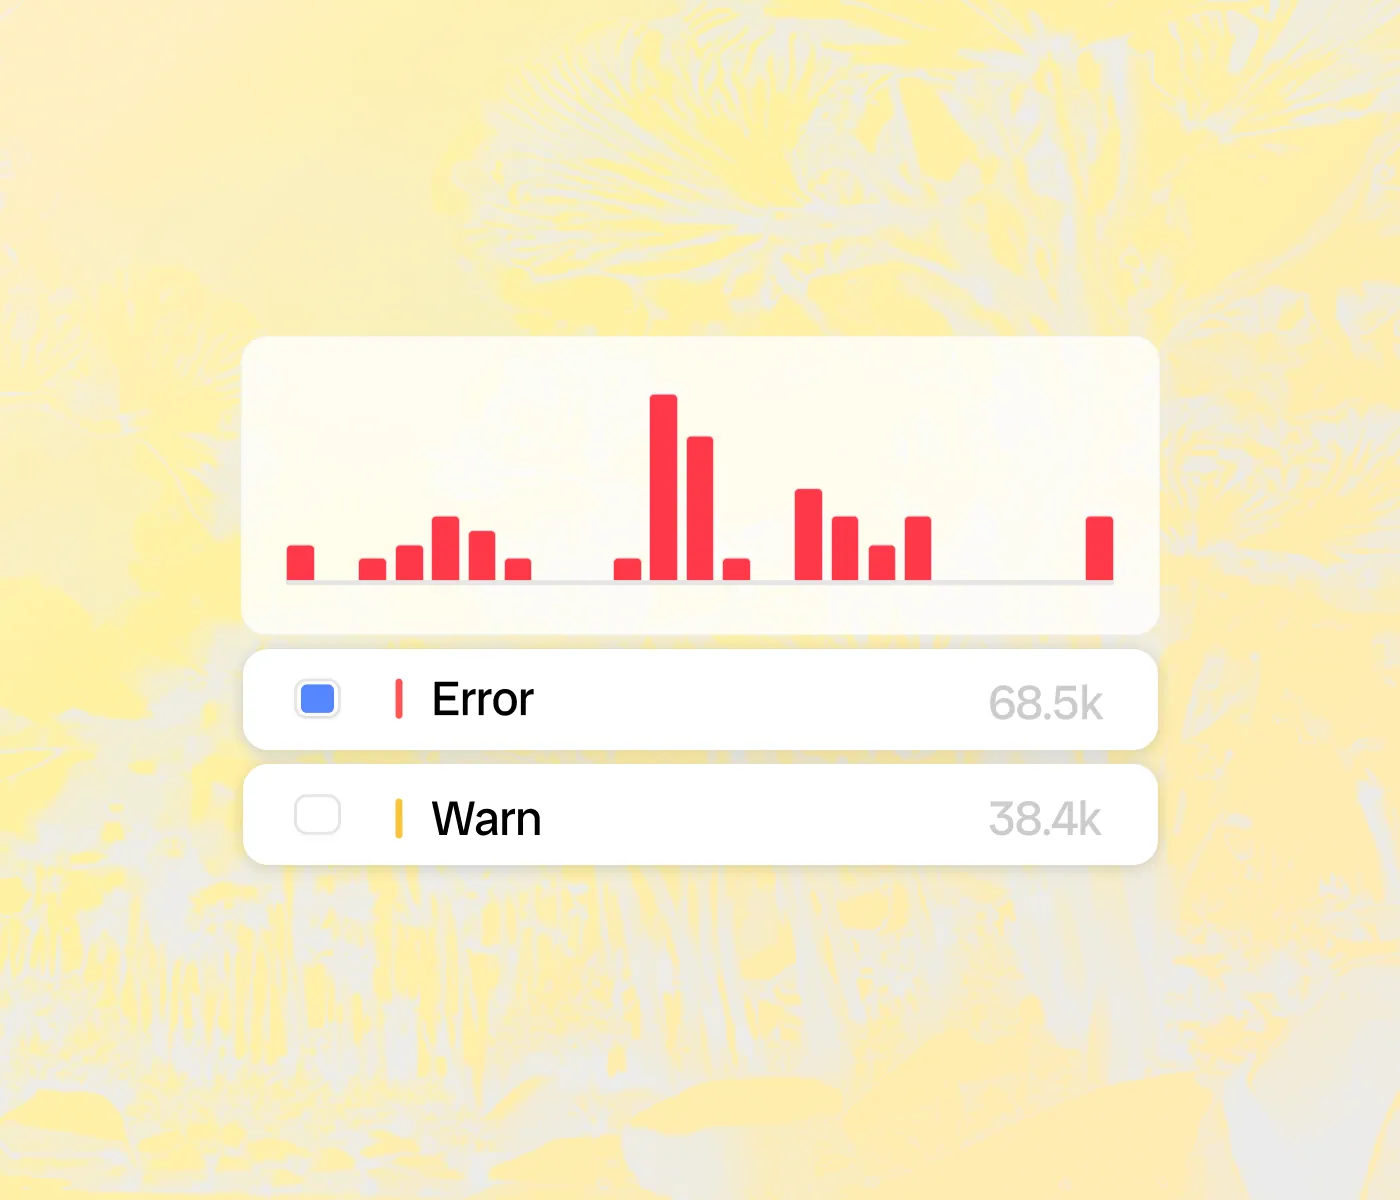
Bronto now automatically detects critical log events and allows users to jump directly into the data for deeper analysis. For HTTP-like logs, status codes are categorized automatically: 5xx as Error and 4xx as Warn. For application logs without a defined log level, errors are detected from stack traces, Kubernetes klog errors, Kernel Out of Memory errors, and more. This accelerates troubleshooting.
Seamlessly send data from your Azure environment to Bronto using an Event Hub, enabling real-time ingestion and analysis of your logs and events. Visit our help docs for more here.
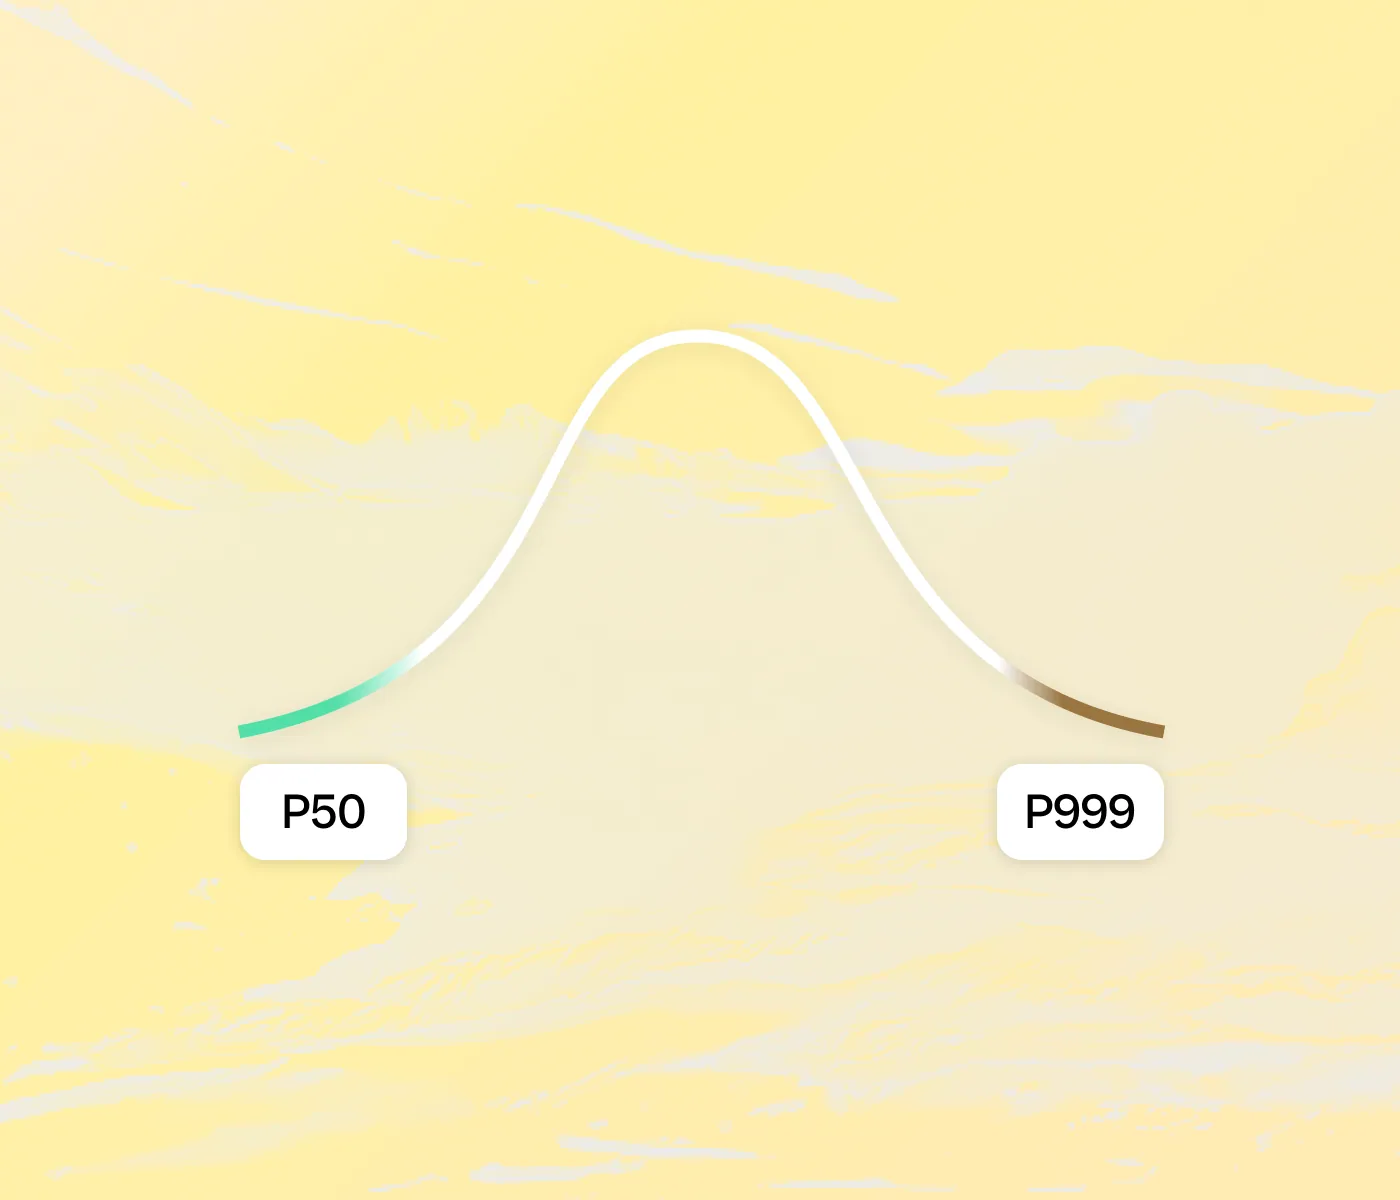
Analyze your data in more depth with our new percentile distribution views. Dashboards now support P50, P75, P90, P95, P99 and P999 visualizations, giving you comprehensive insights into performance patterns and outliers. These statistical viewpoints help you understand not just average behavior, but also edge cases that might impact user experience.

Bronto Trust Center has been updated to reflect our latest SOC 2 Type 1 and Type 2 compliance, reinforcing our commitment to security, availability, and data integrity. Visit our Trust Site for more details here.

Easily archive your account log data with our new API, enabling automated backups to an S3 bucket of your choice. Select specific datasets or back up your entire account at regular intervals, hourly or daily, for secure and reliable data storage. Visit our API docs here.
Easily expand your visualizations with full-screen widget mode. When using full-screen widget mode with bar, line, or area visualizations, you can now chart and compare data from previous time periods, including days, weeks, months, and years. This allows for deeper insights and trend analysis over time.

Seamlessly log into Bronto using Google SSO with our new SAML integration. Enhance security, streamline authentication, and simplify user access management across your organization. Get Started with SSO here.
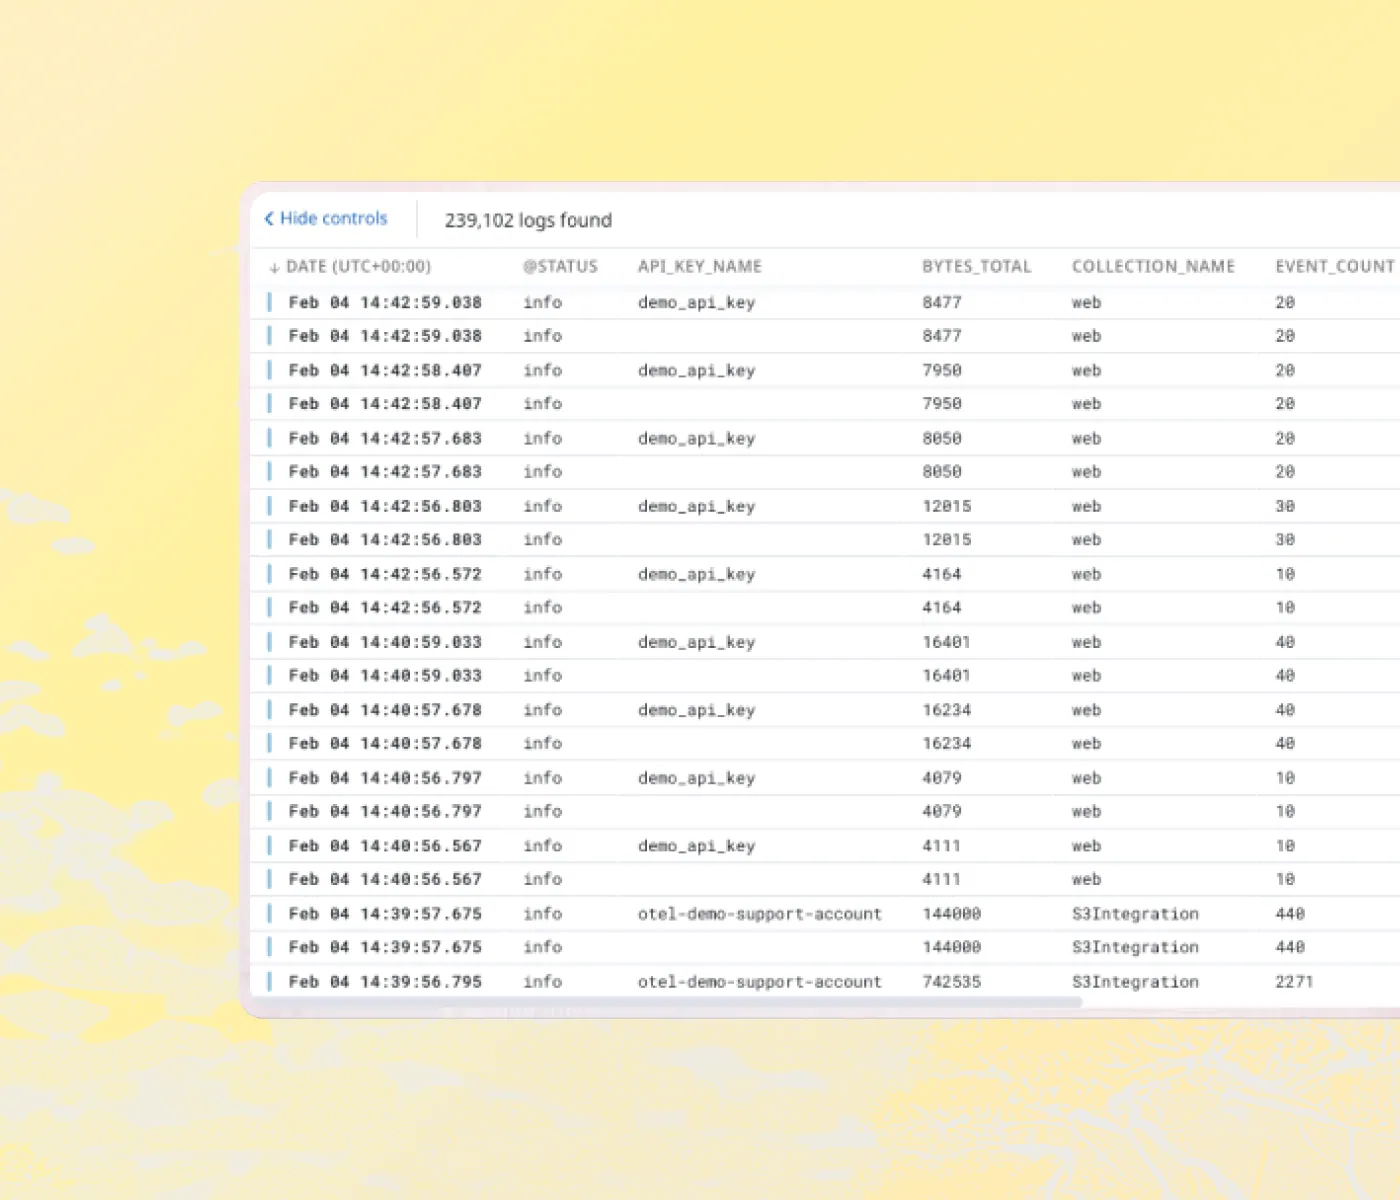
When switched to Table View from the More Options menu on the right of the search bar, you can now reorder columns by clicking and dragging.
Regular Expressions and Capture Groups can now be used in search. Visit our Query Syntax docs page here.
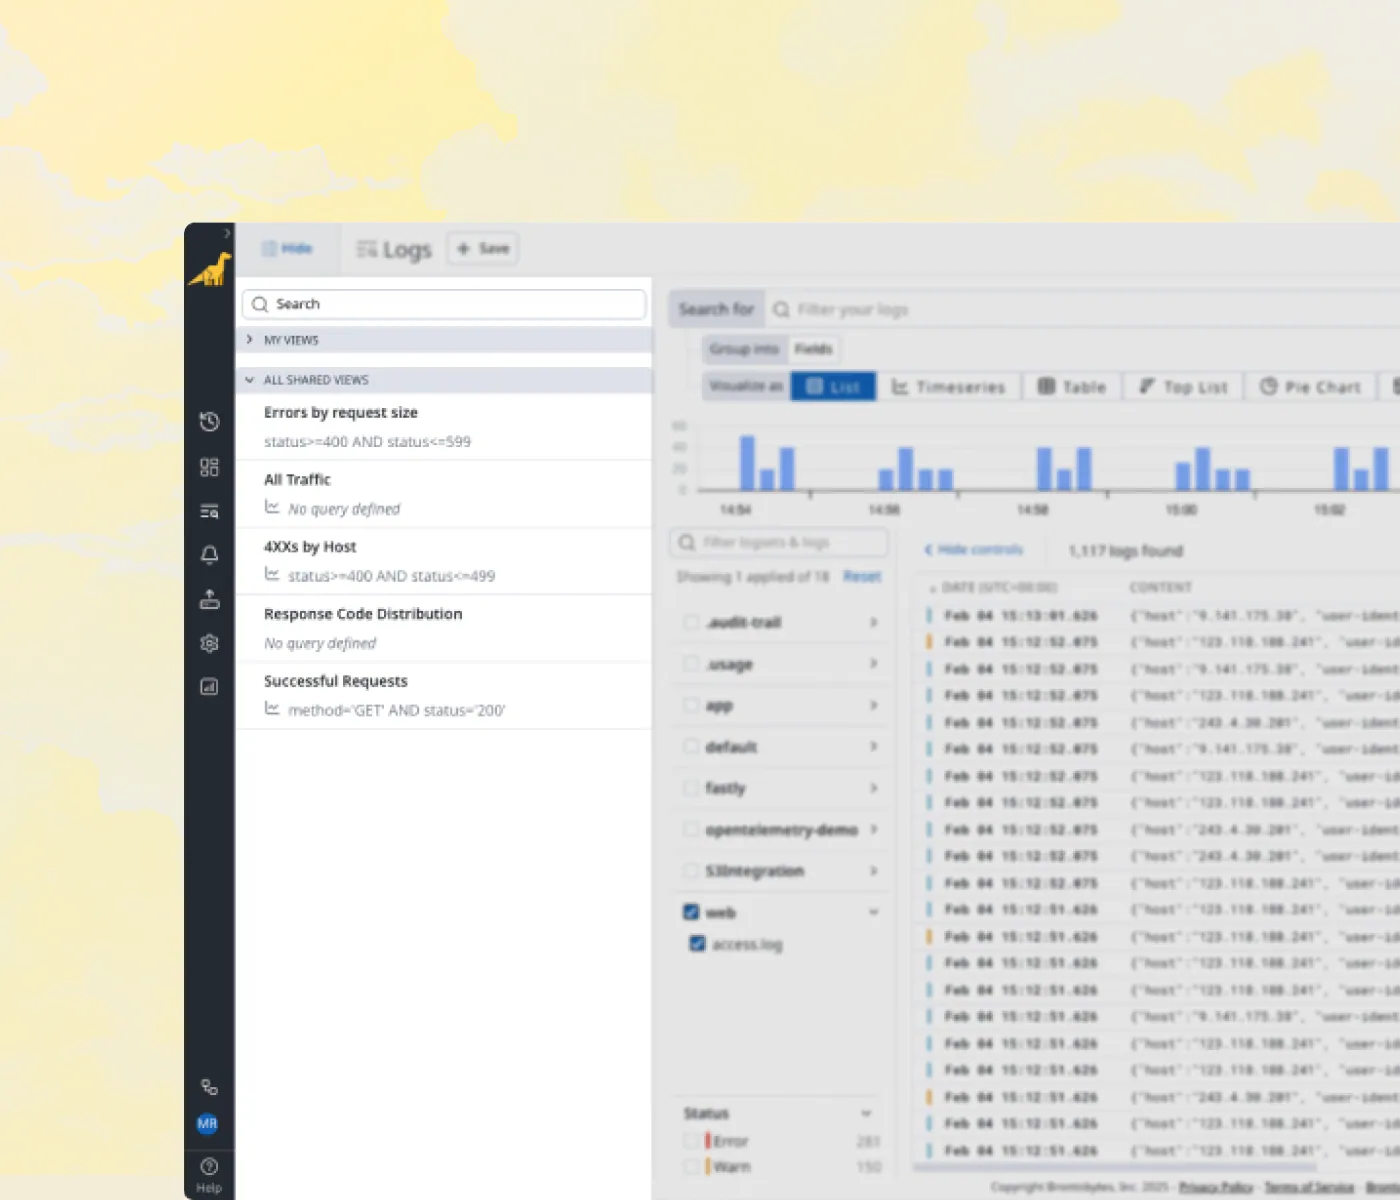
Easily share a direct link to a saved view with a team member.
Search using our intuitive Date and Time picker with the addition of Relative time ranges and Millisecond precision options.
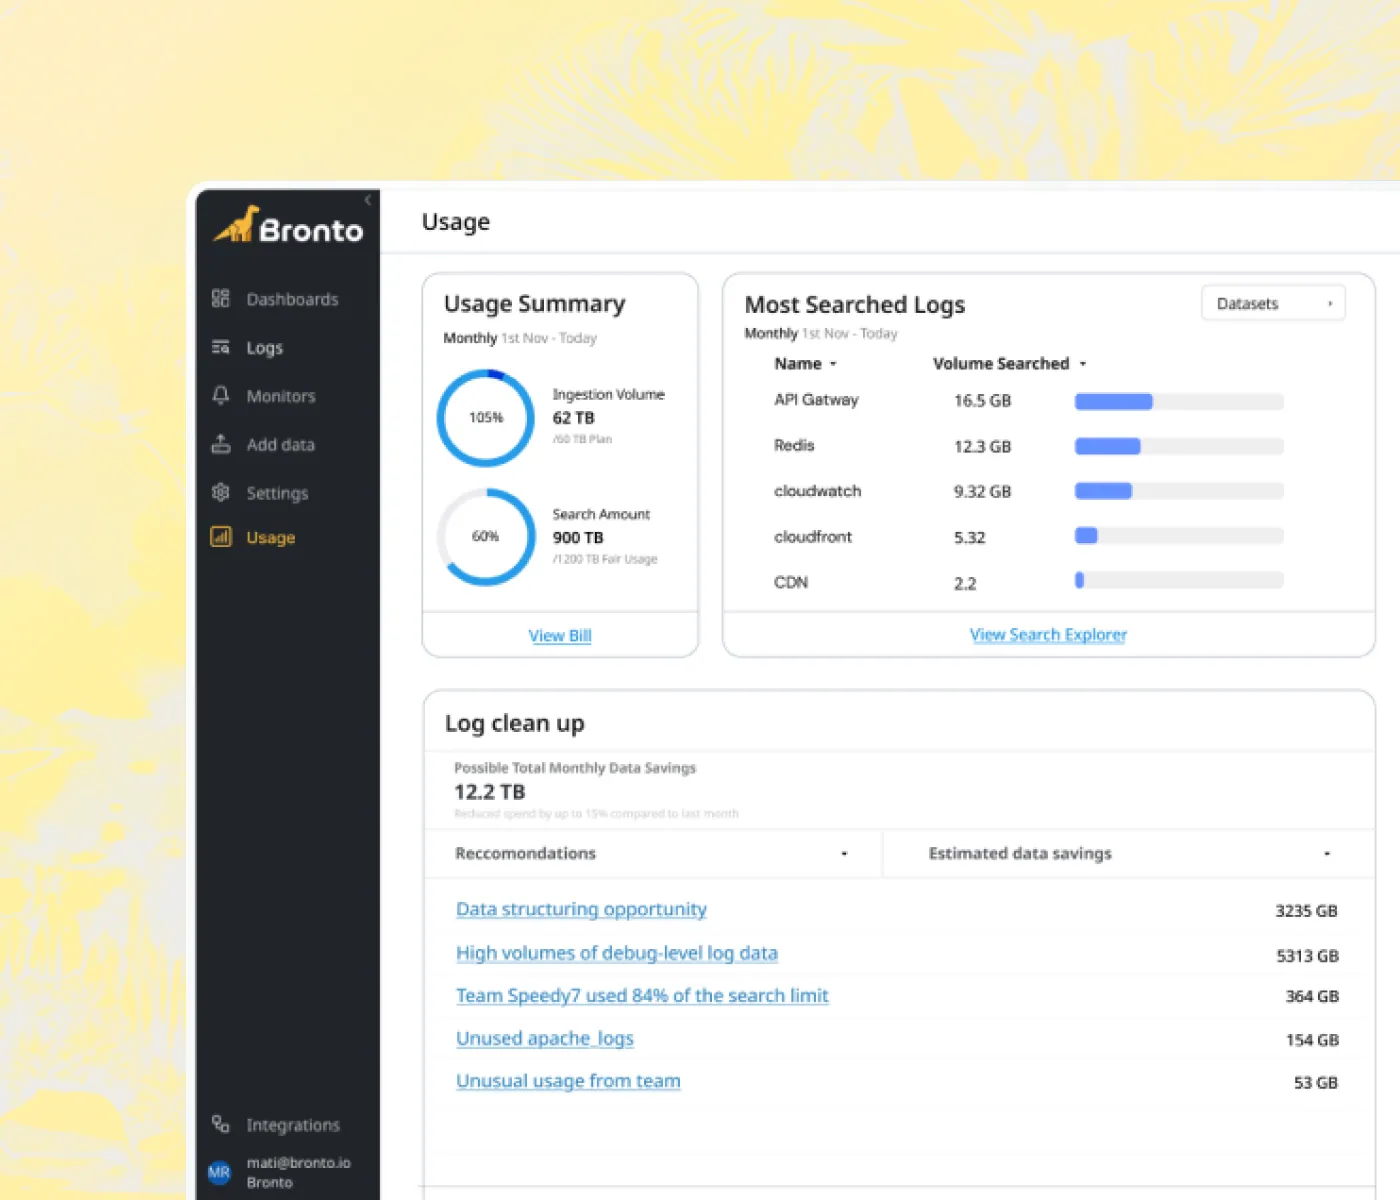
Gain a high-level overview of your Bronto usage, ensuring you stay within your quota. Receive system-generated recommendations to optimize usage and reduce costs, with drill-down tools for deeper insights.
Provides a high-level view of search and ingestion activities, along with navigation to tools for in-depth analysis.
Enables users to "slice and dice" data for a clearer understanding of usage patterns.
Quickly navigate to explorers by identifying top contributors and their activity.
Get actionable insights to address product misuse and optimize efficiency.
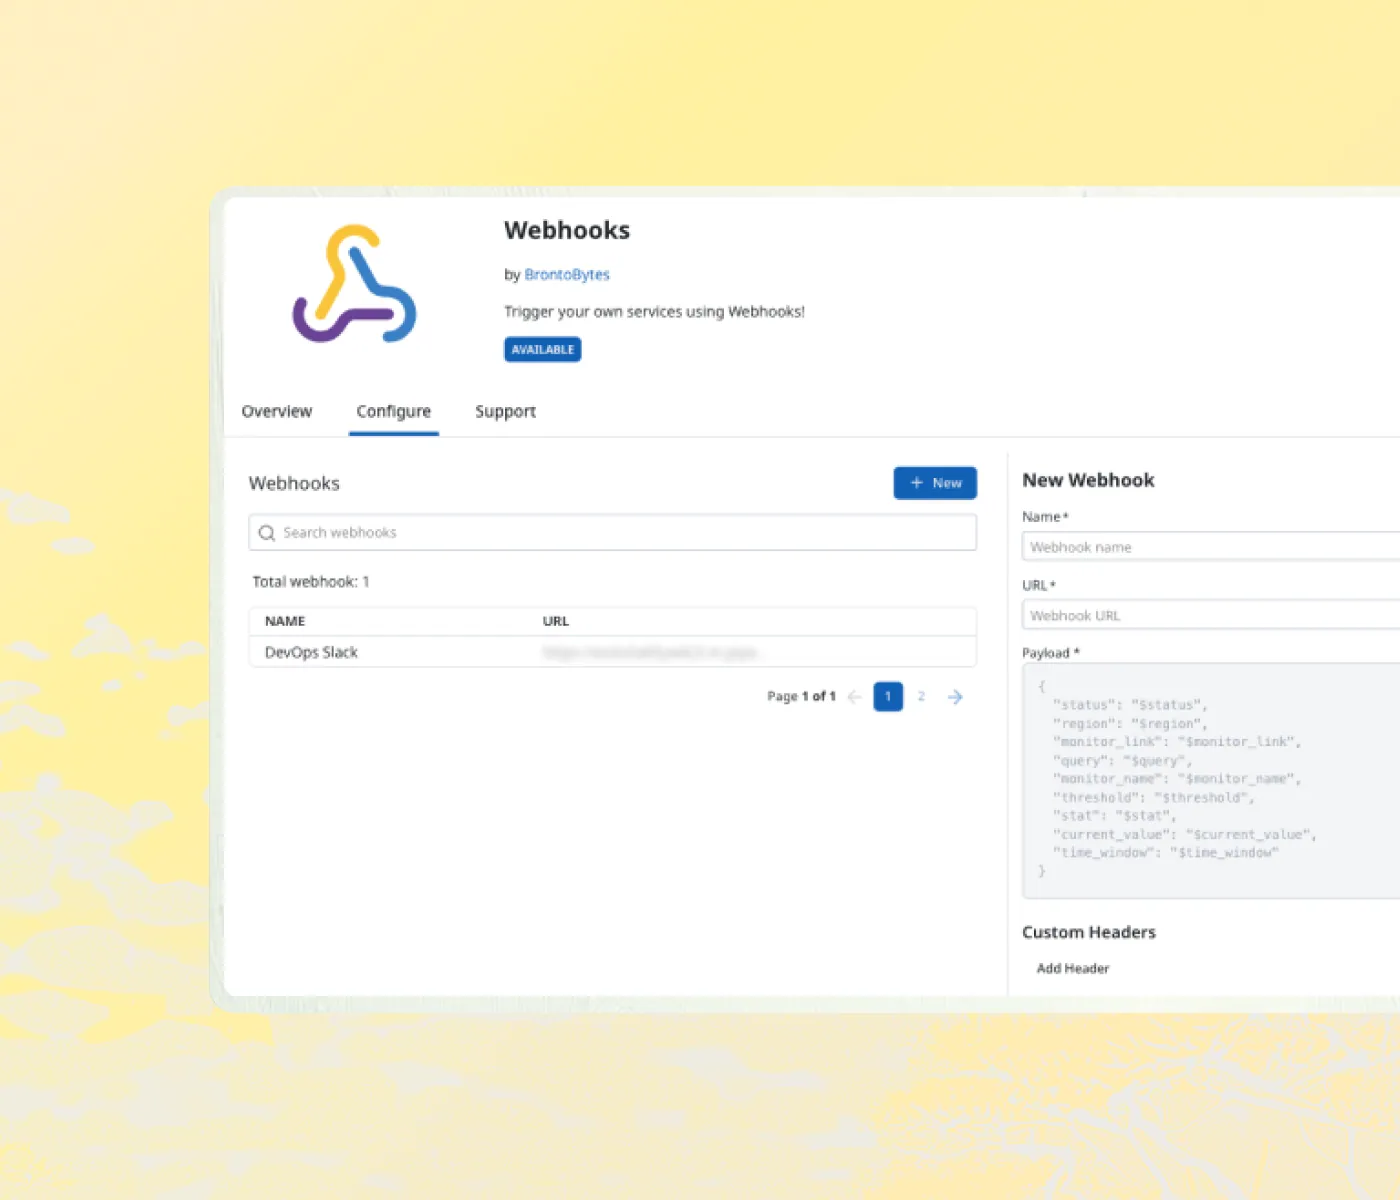
Users can now trigger and send notifications to webhook URL endpoints, for example Slack or Opsgenie.
You can now use our multi-groupby function within monitors as part of the filtering option.
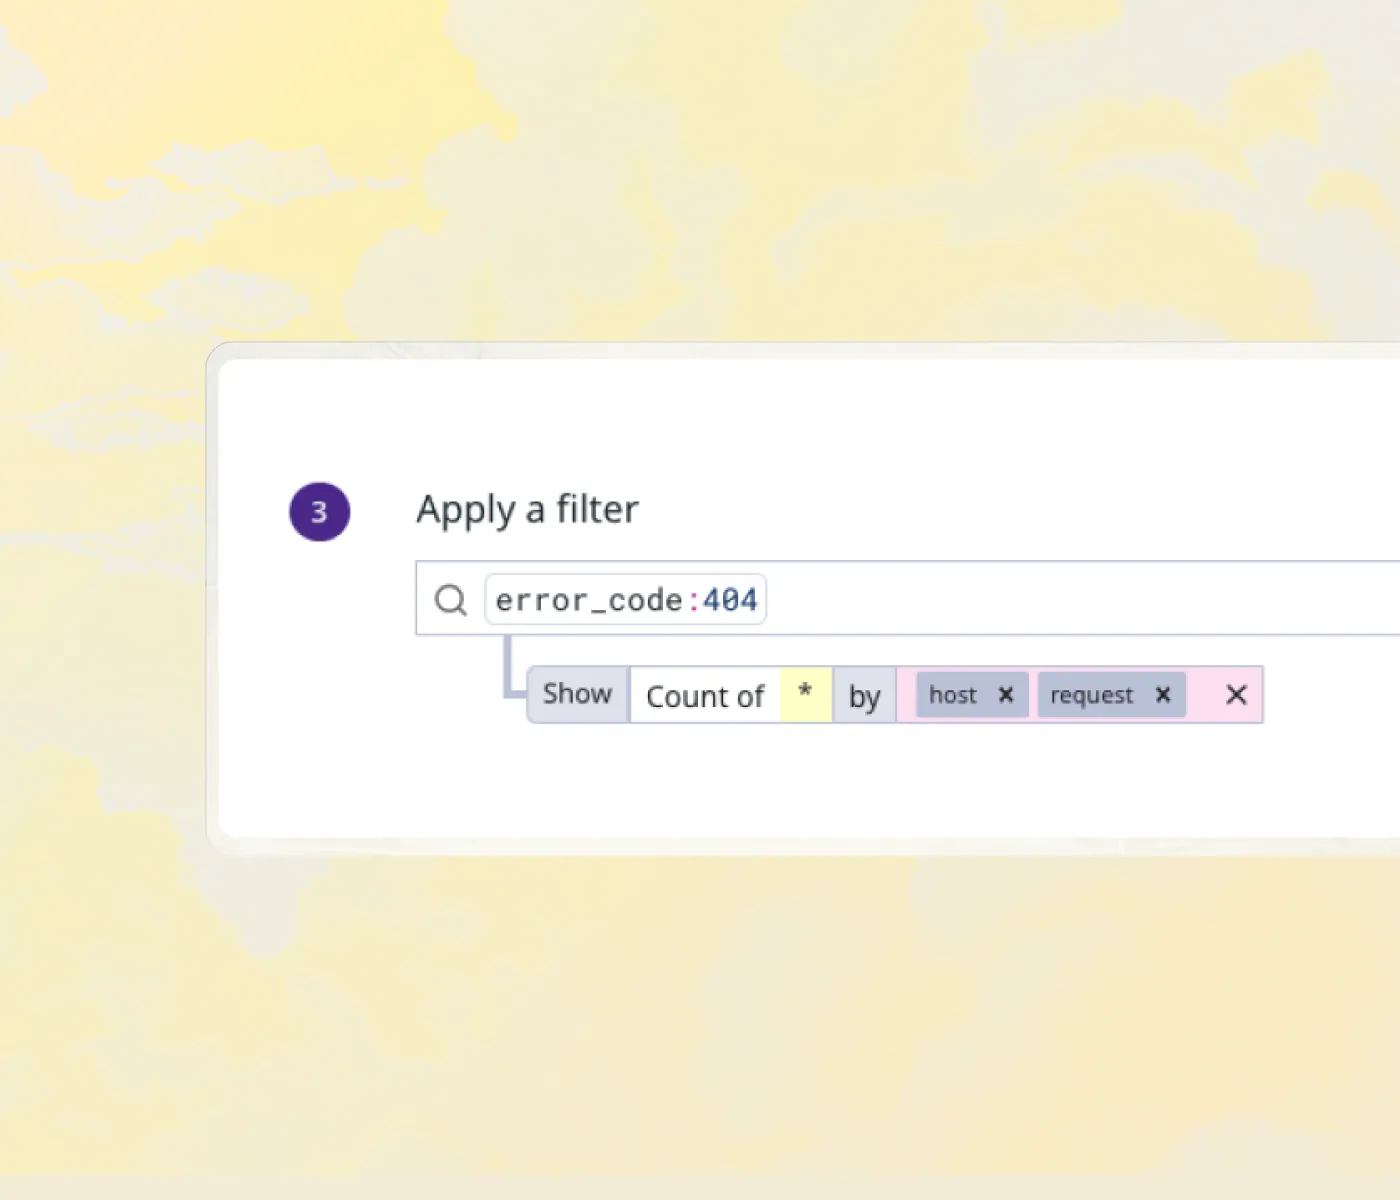
Visualize your data with advanced multi-groupby filters. Customise your widget layout: move, sort, and save widget sizes on your dashboard.
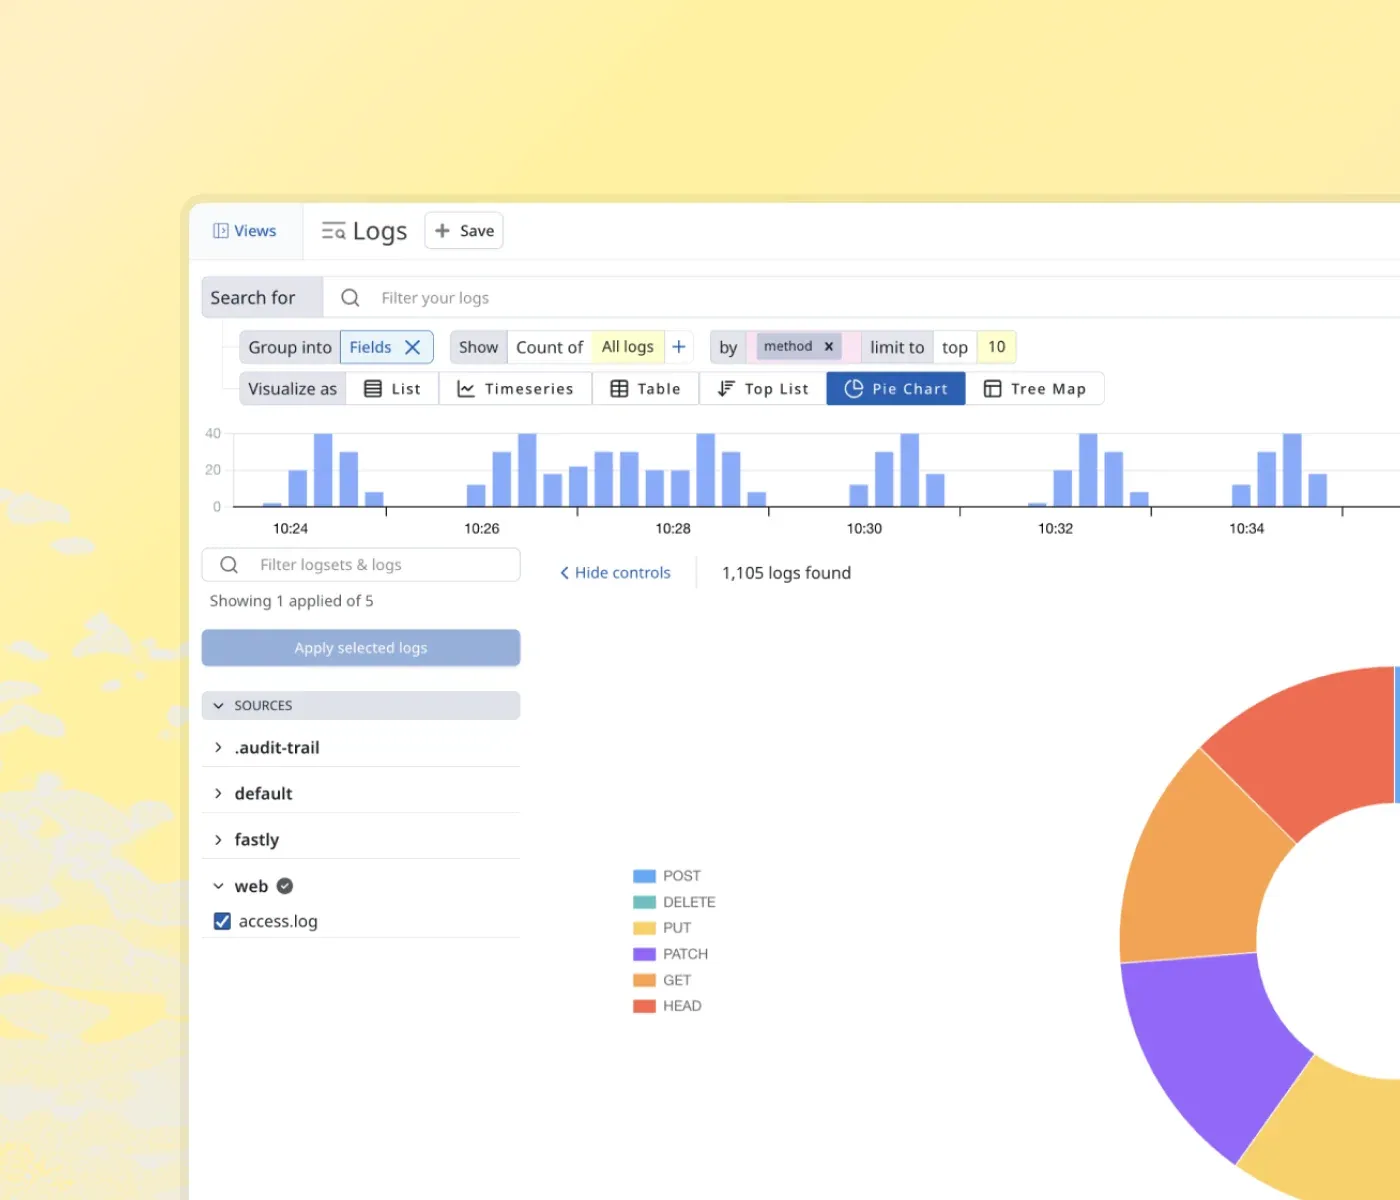
When viewing Timeseries data, you can now aggregate it by hours or days depending on your selected timeframe.
Copy Permalinks for Predefined Searches and Datasets, locate this in the "More" menu in search.
Click on a single log event to view the panel, then select the link icon to copy a direct link to a log event.
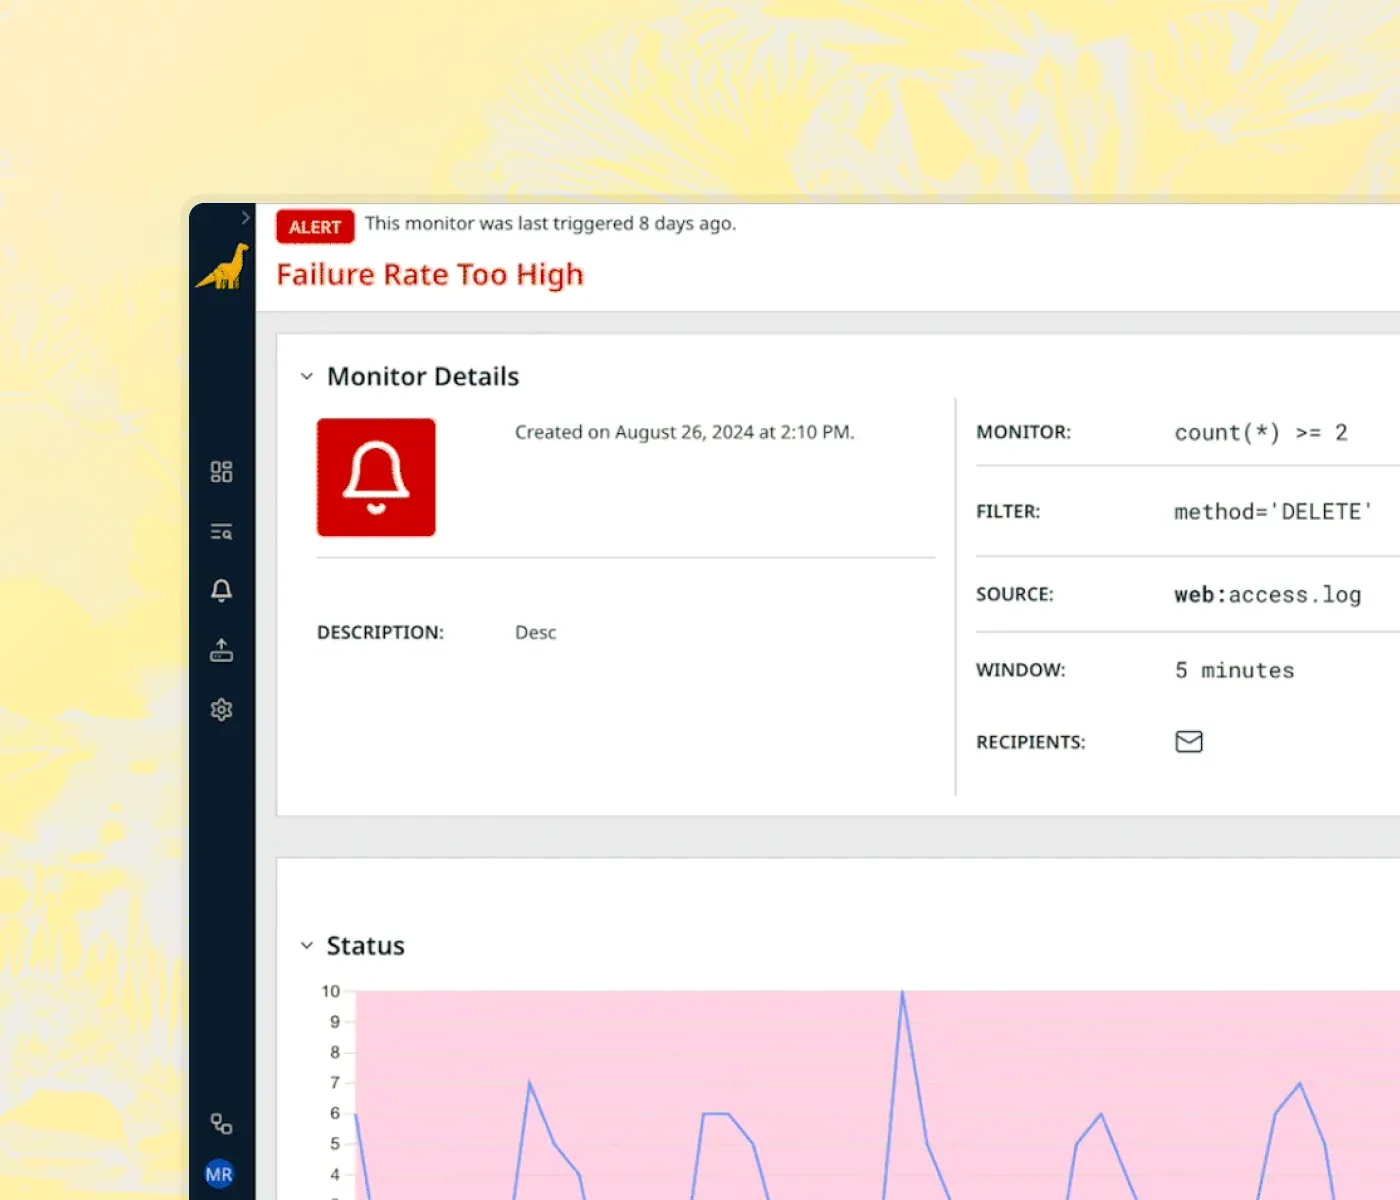
Easily track your Bronto usage by fetching data via our API or creating custom searches to monitor your organisation's usage metrics. Visit our API docs here.
Send data to Bronto from your cloud services including AWS S3 Access Log and AWS CloudFront. Visit our setup docs here.
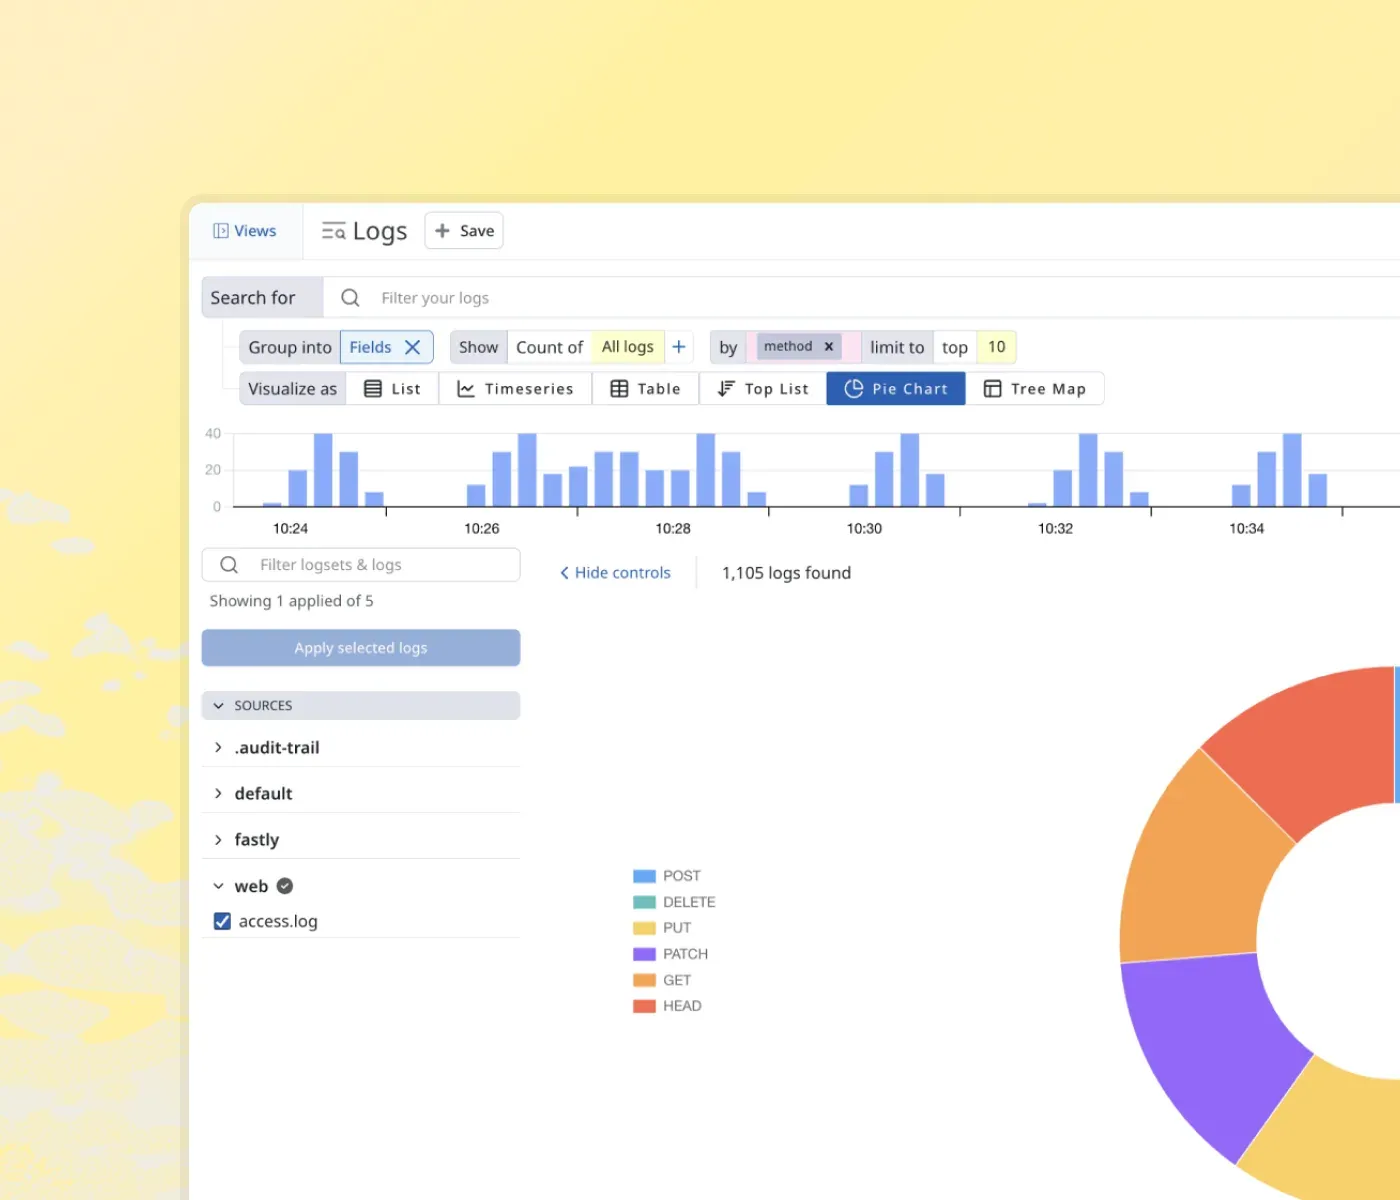
Easily filter events by selected Key / Value pairs with clickable options that allow you to remove or replace filters. Navigate through your events efficiently using shortcut keys.
Visualise your data using our latest options: Pie chart, Top List and Tree Map.
We introduced a new API that allows users to export data based on a specific query and timeframe.
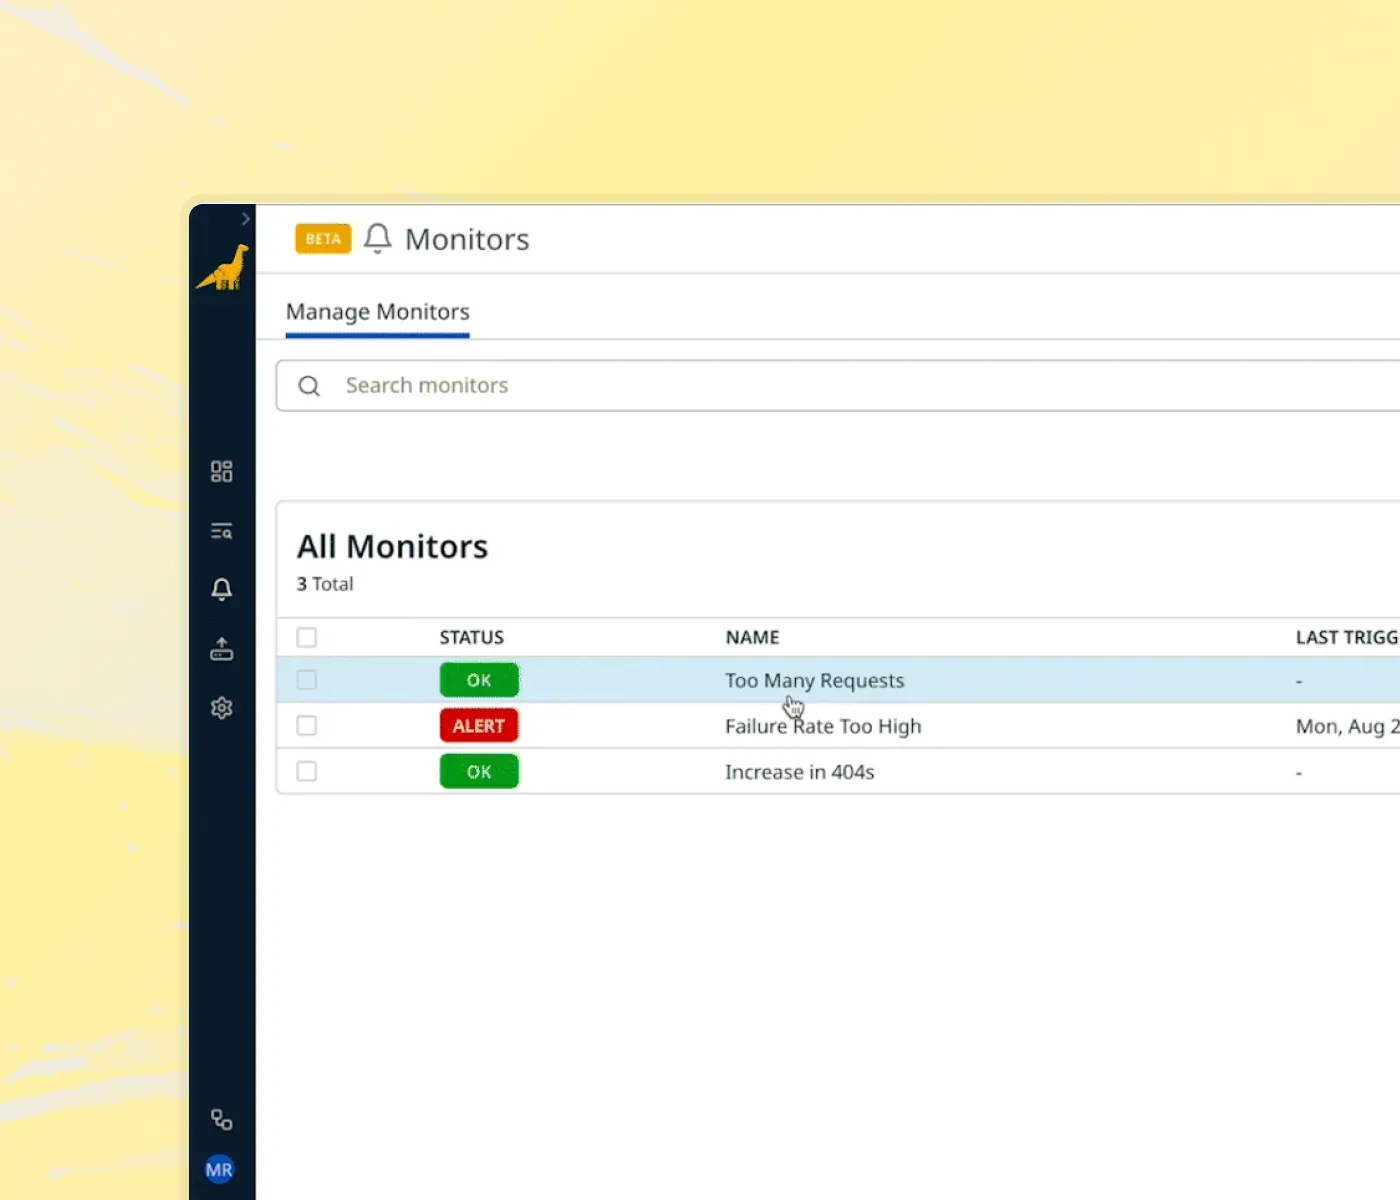
Bronto now enables comprehensive monitoring of your entire infrastructure by allowing you to create monitors that actively scan your data for critical changes and notify your teams in real-time.
Manage all your monitors from a single page. Here, you can view when a monitor was last triggered, its current status, and associated notifications.
The status graph displays your monitors filtered results over a selected timeframe, while the History graph highlights previous instances when your monitors were triggered.
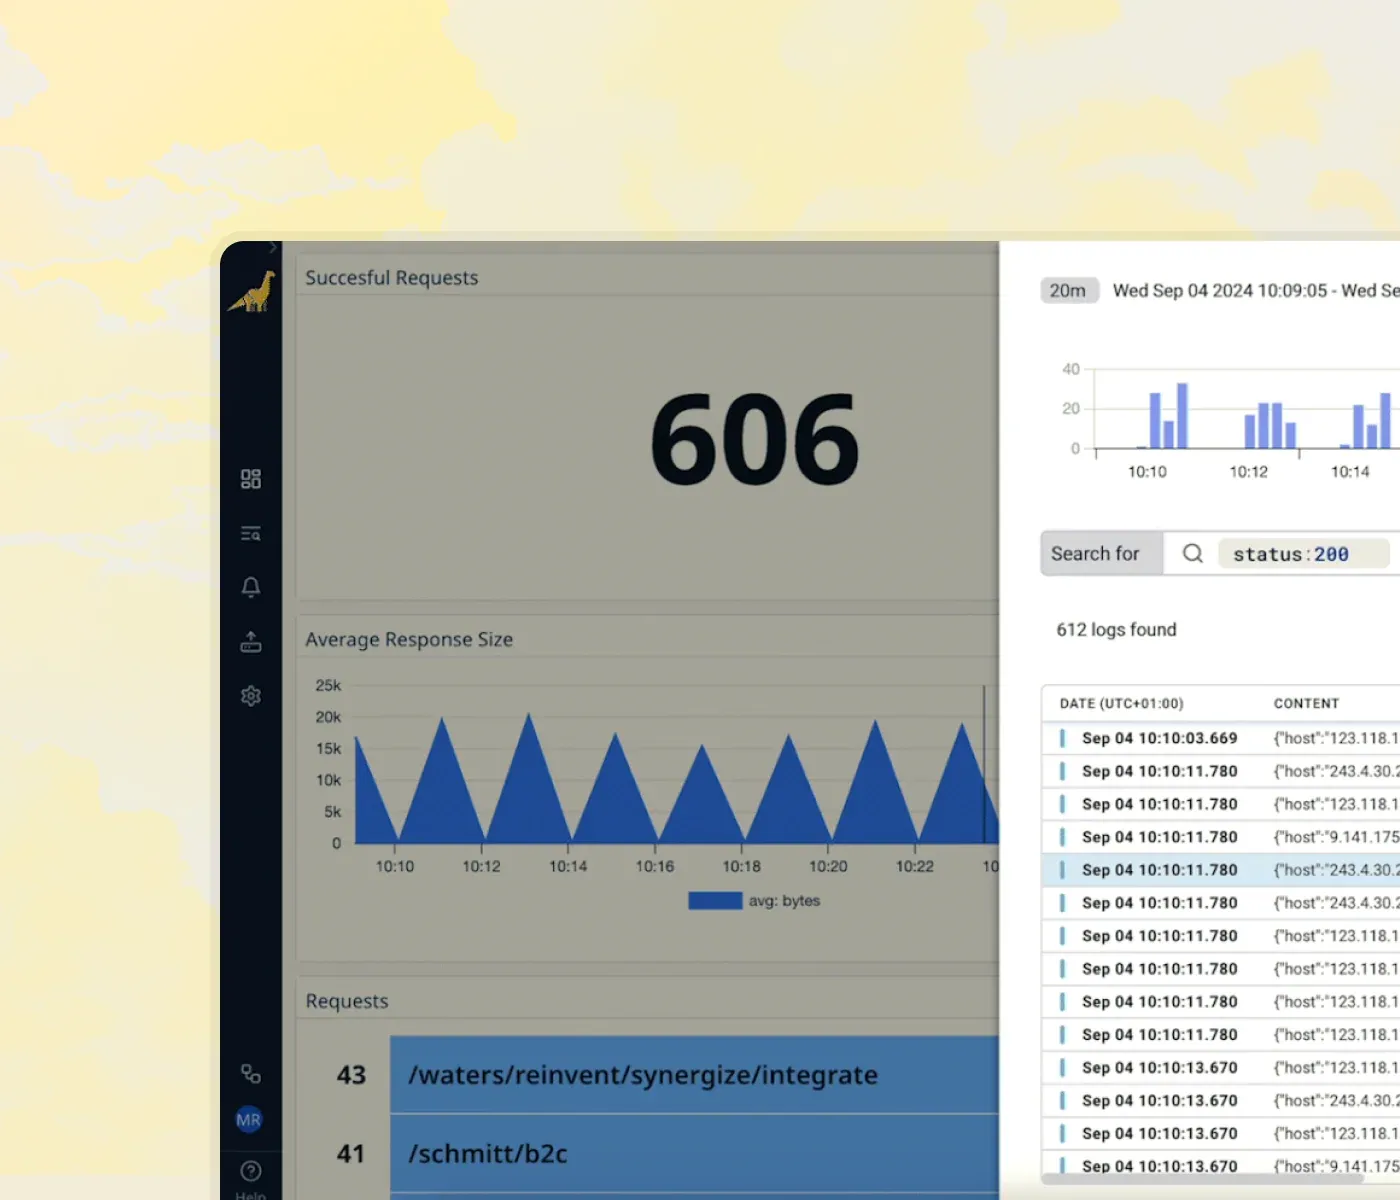
Now when viewing a dashboard widget, you can quickly view the filter used and related logs in a popup.
When widgets are modified we now fetch and populate historical data so your widgets are ready to be viewed once saved.
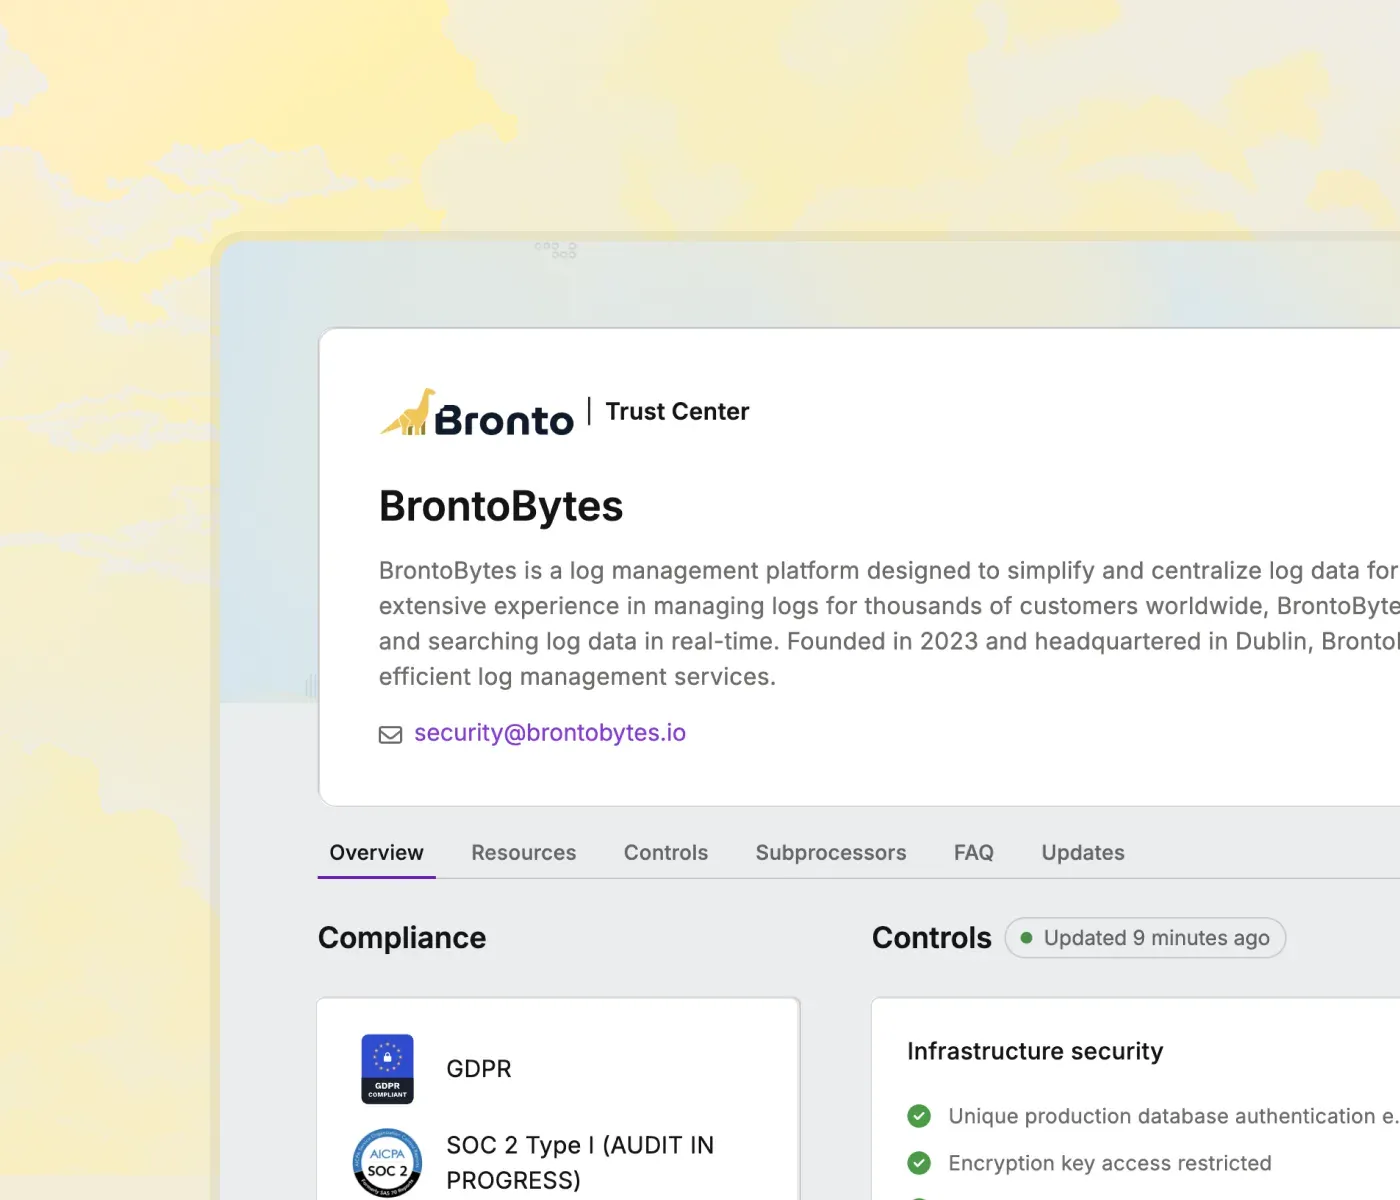
We have updated our Trust Center with our latest Pen test results. Access the latest details of our security posture on this page.
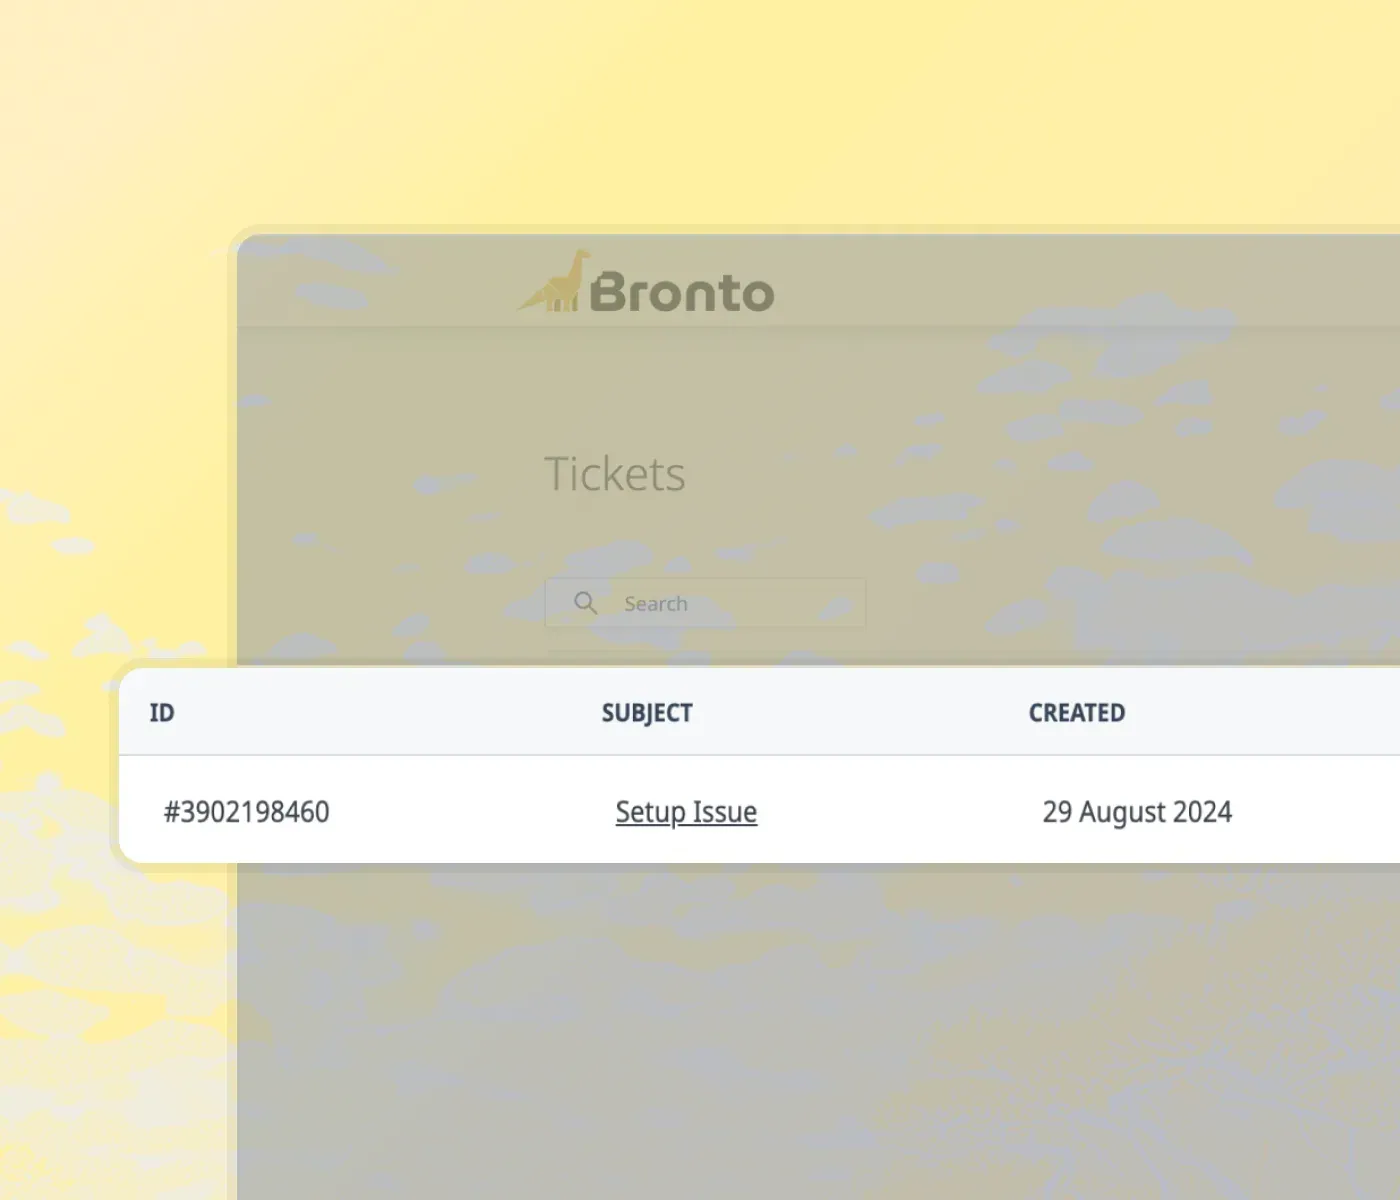
Easily create, view and manage your support tickets all in one place. Visit Help page to see links to the portal and our in-app support ticket form.
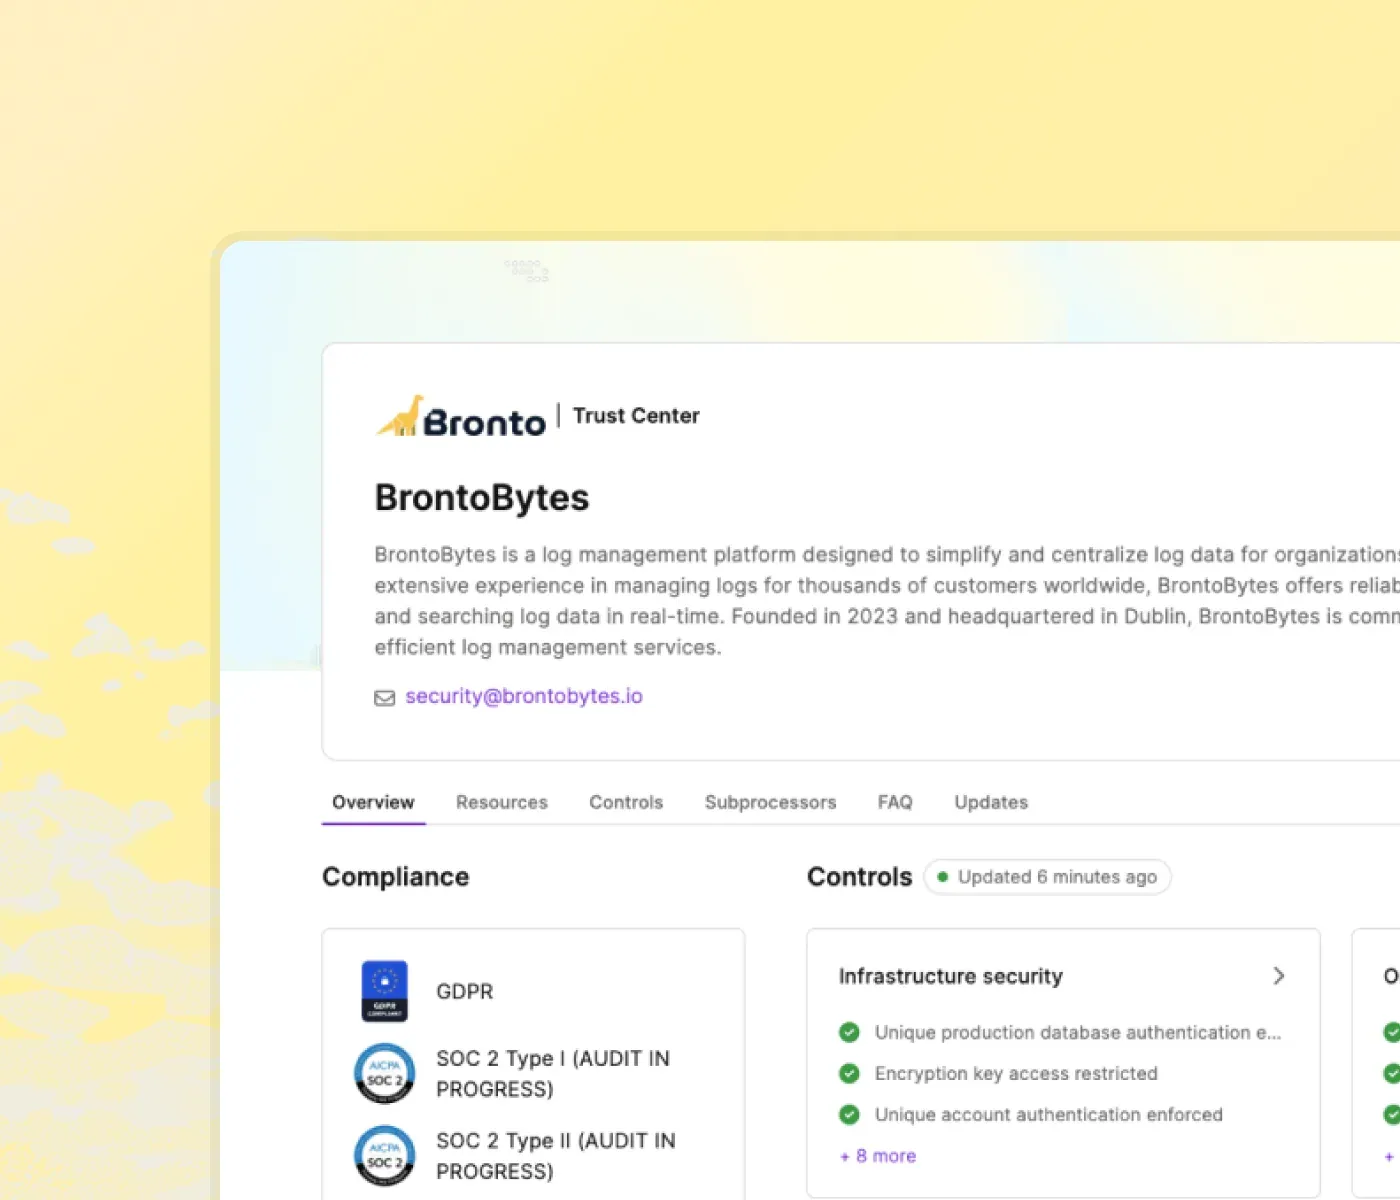
We are excited to announce the launch of our Trust Center page, a dedicated space where you can access comprehensive information about our security, compliance, and privacy practices.
Detailed descriptions of our robust security protocols and infrastructure designed to protect your data.
Information on our adherence to industry standards and regulations, including certifications and audit reports.
Clear explanations of our data privacy policies and practices, ensuring transparency about how we handle your information.
Insights into our incident response procedures and how we manage and communicate any security events.
The Bronto help page has been added as a dedicated place to find all the resources and support you might need. From the help page you can find documentation, quick start guides, contact information for our support team, and more.
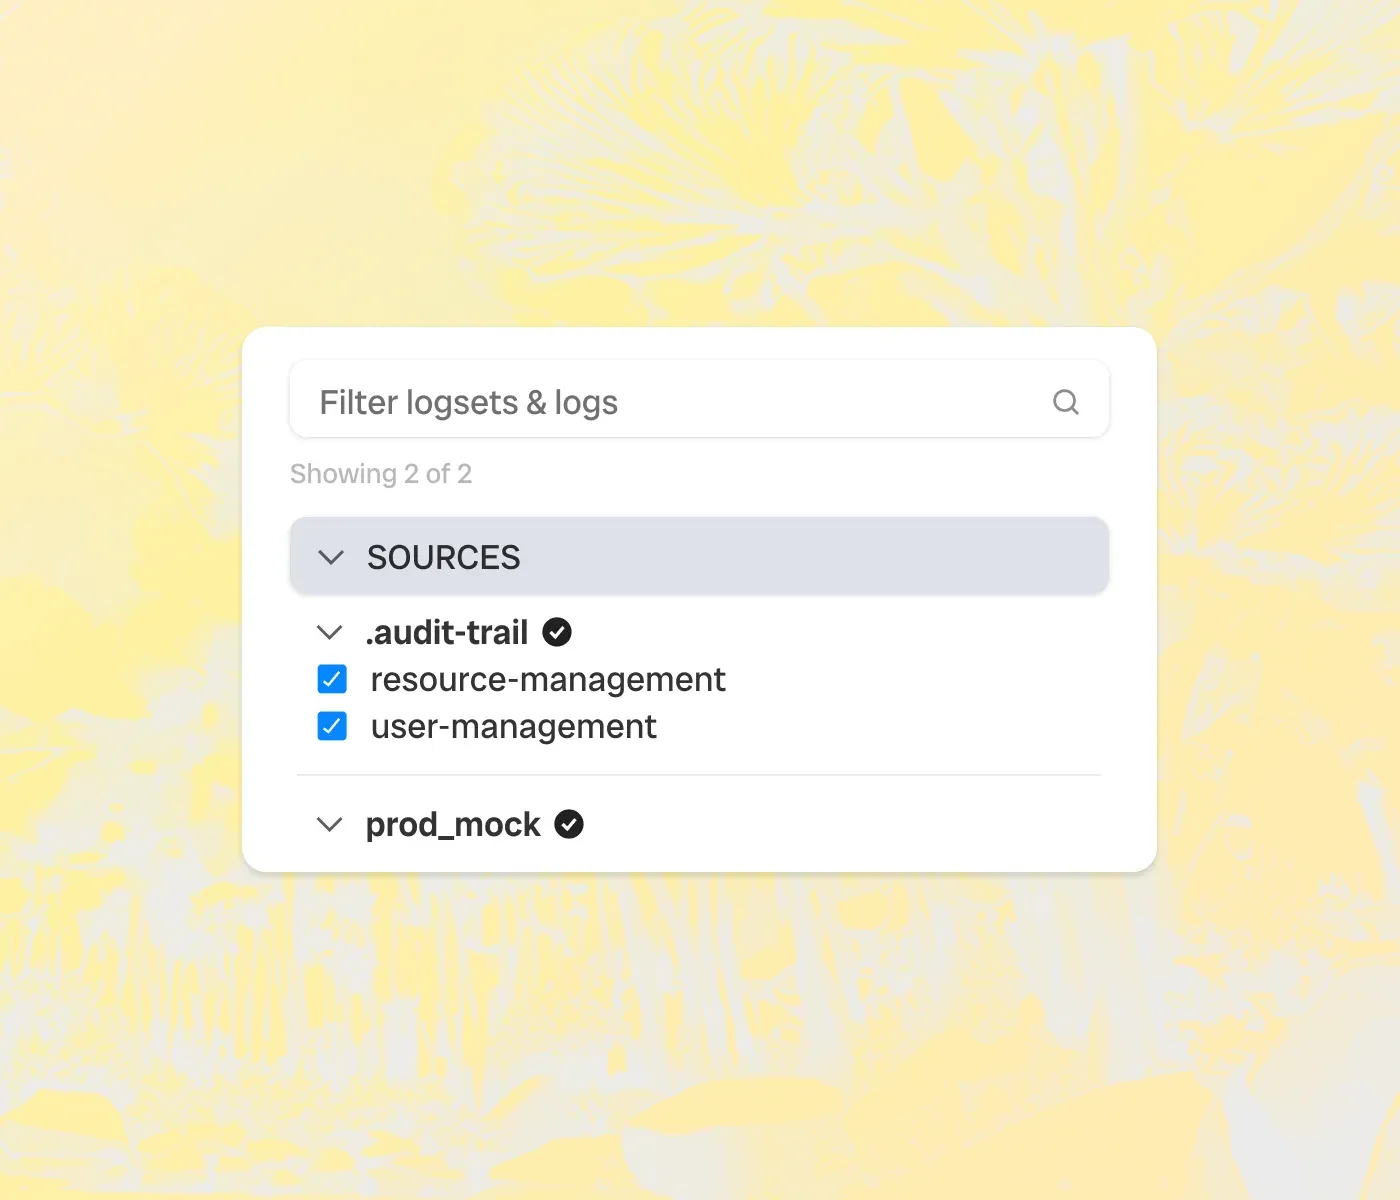
The Bronto help page has been added as a dedicated place to find all the resources and support you might need. From the help page you can find documentation, quick start guides, contact information for our support team, and more.
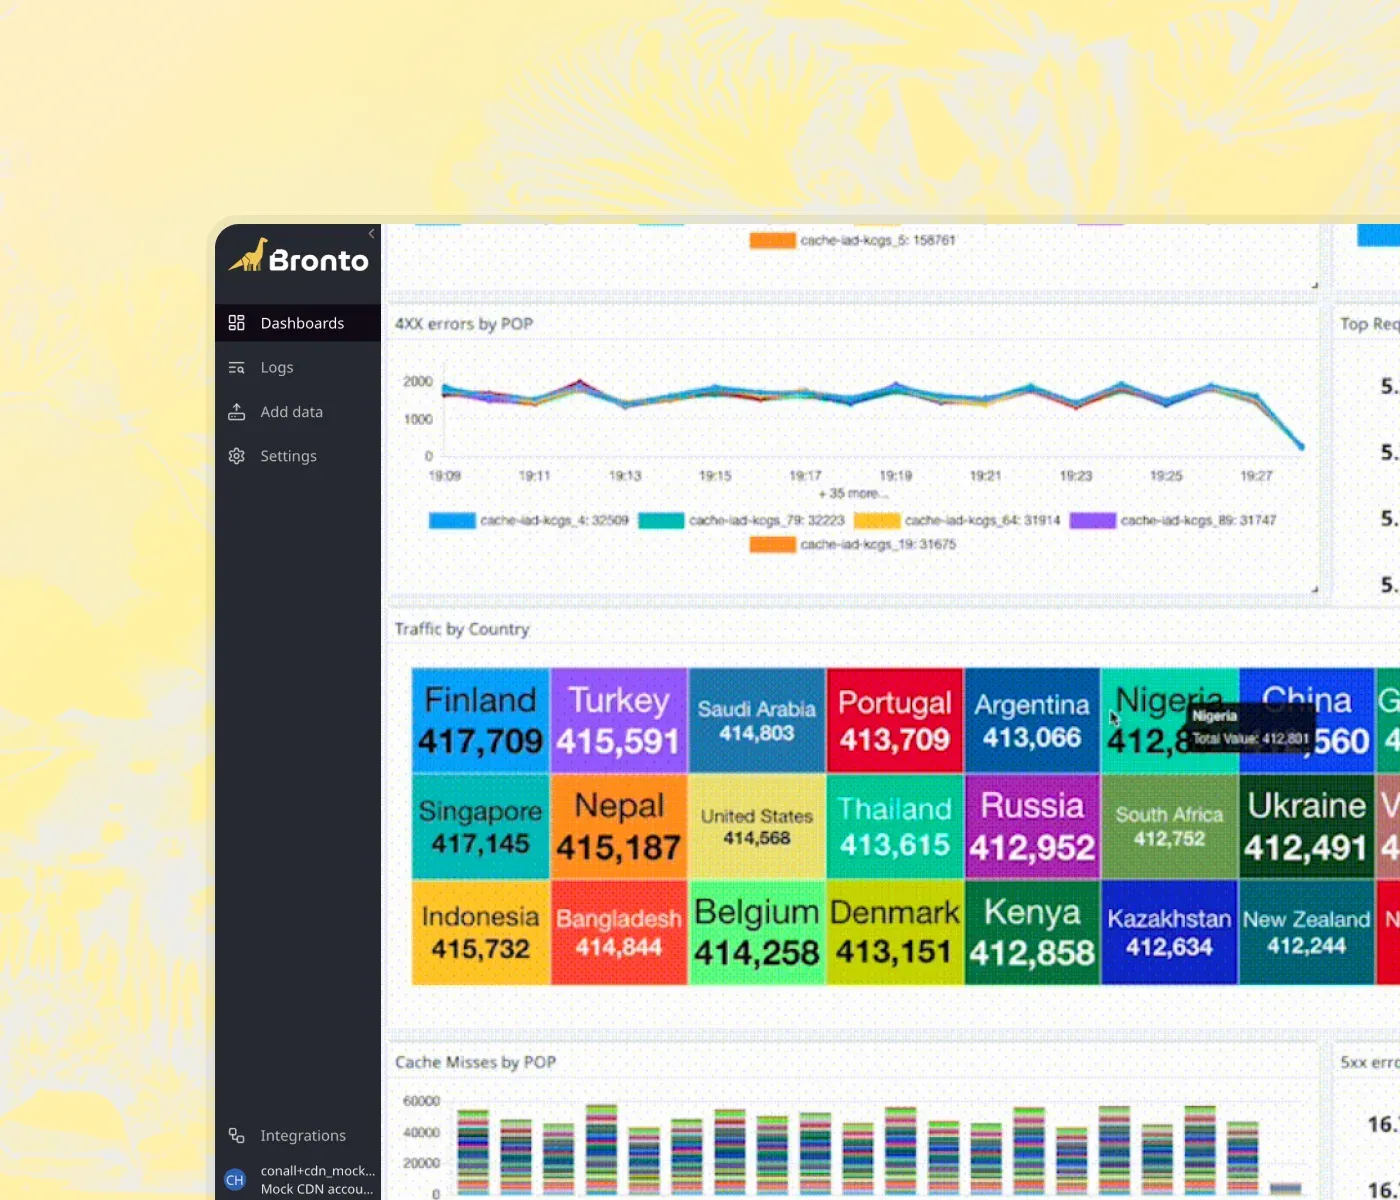
Visualise your data in more ways. We have added Treemap and Top List as graphing options in dashboards.
Treemaps represent hierarchical data as nested rectangles, helping you understand the structure and distribution within a hierarchy. Examples include log volume by source and type, error distribution across services, resource allocation, and other hierarchical metrics.
Top List visualisation displays a list of search values with the highest or lowest metrics or event values. Examples include graphing CPU usage, disk space, or costs of particular services.
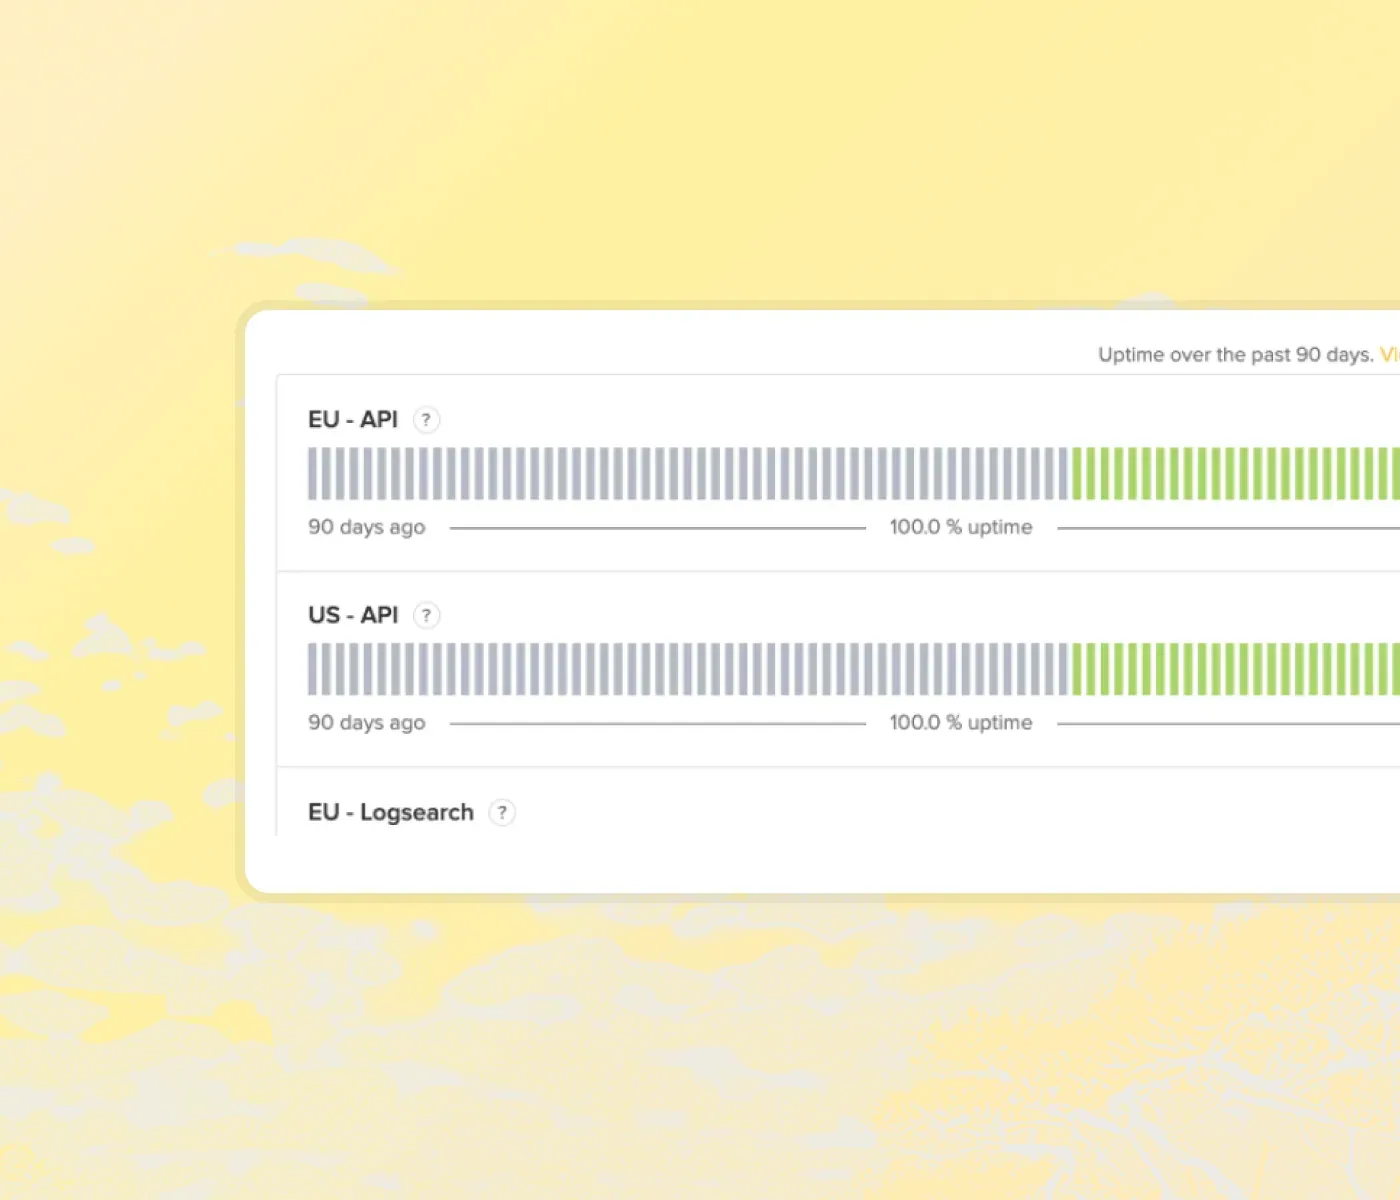
Stay informed about potential future issues or maintenance windows by subscribing to our status page. On this page you'll also find our uptime metrics and a history of any past incidents.
Stream service logs from Fastly to Bronto with our new integration. This feature allows you to forward logs from your CDN or Compute services directly to Bronto via an HTTPS logging endpoint. To get started, visit our docs page here.
We have also integrated with Cloudflare. Using the log push feature from Cloudflare, you can quickly batch and send logs to Bronto. To get started, visit our docs page here.
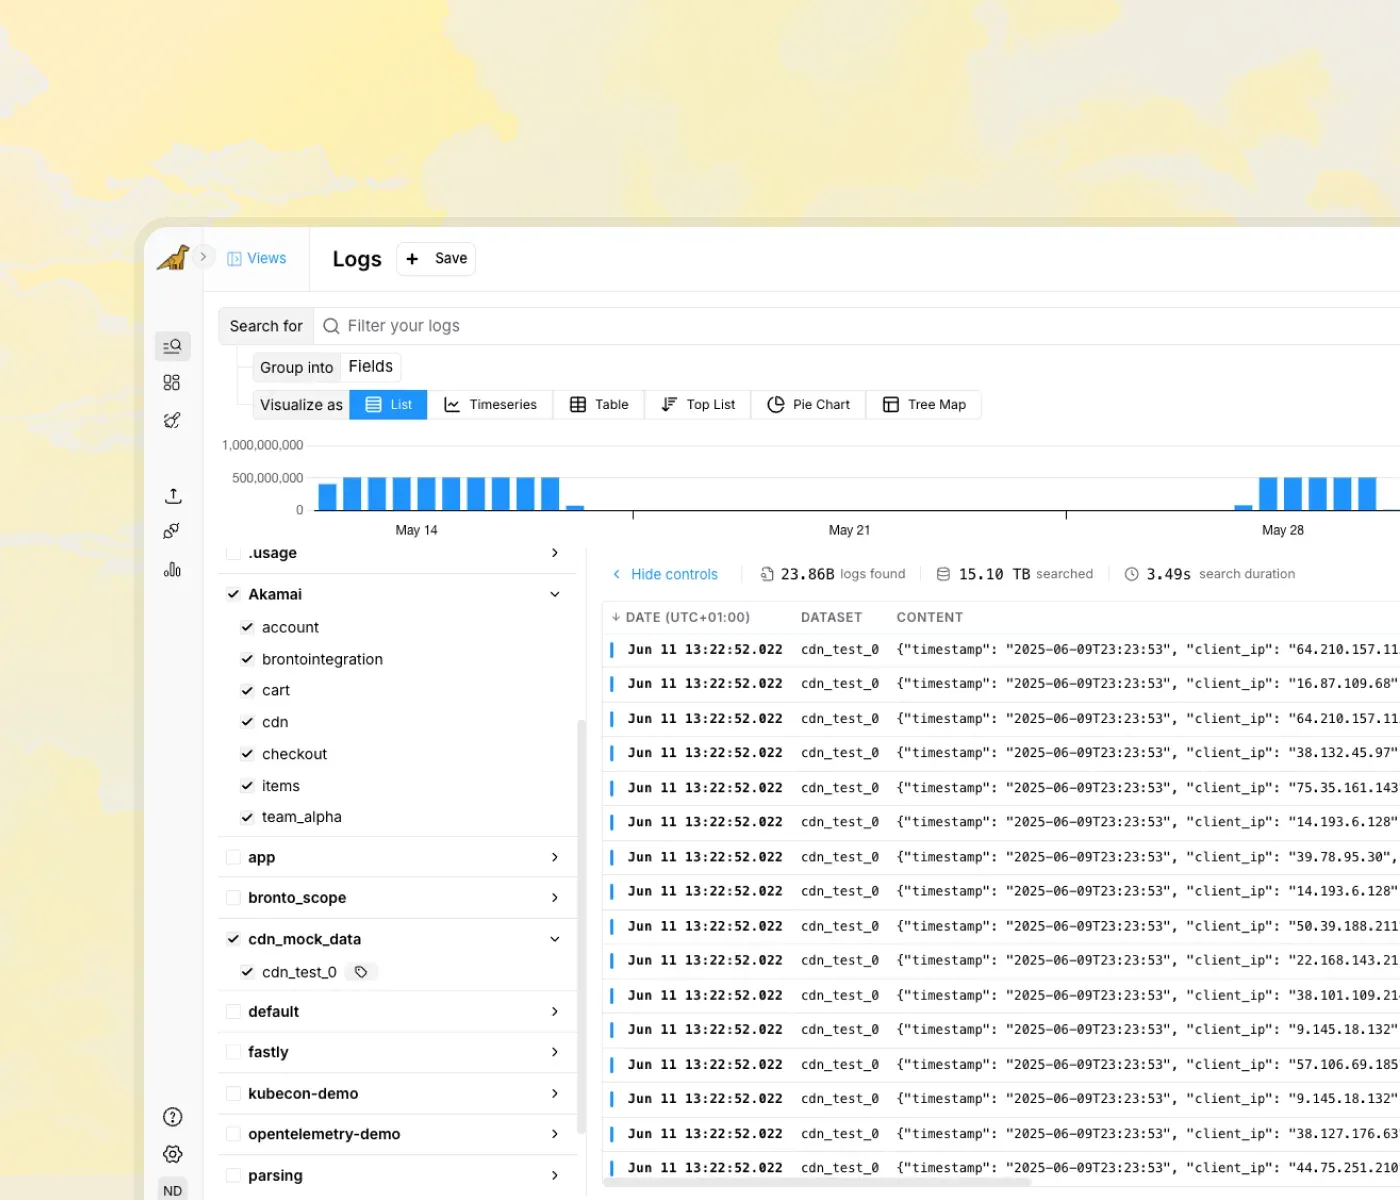
When viewing the list of log events on the search page, you can now toggle between a table display and just the raw content of the log event. To toggle the table display, click the button in the top right corner of the table.
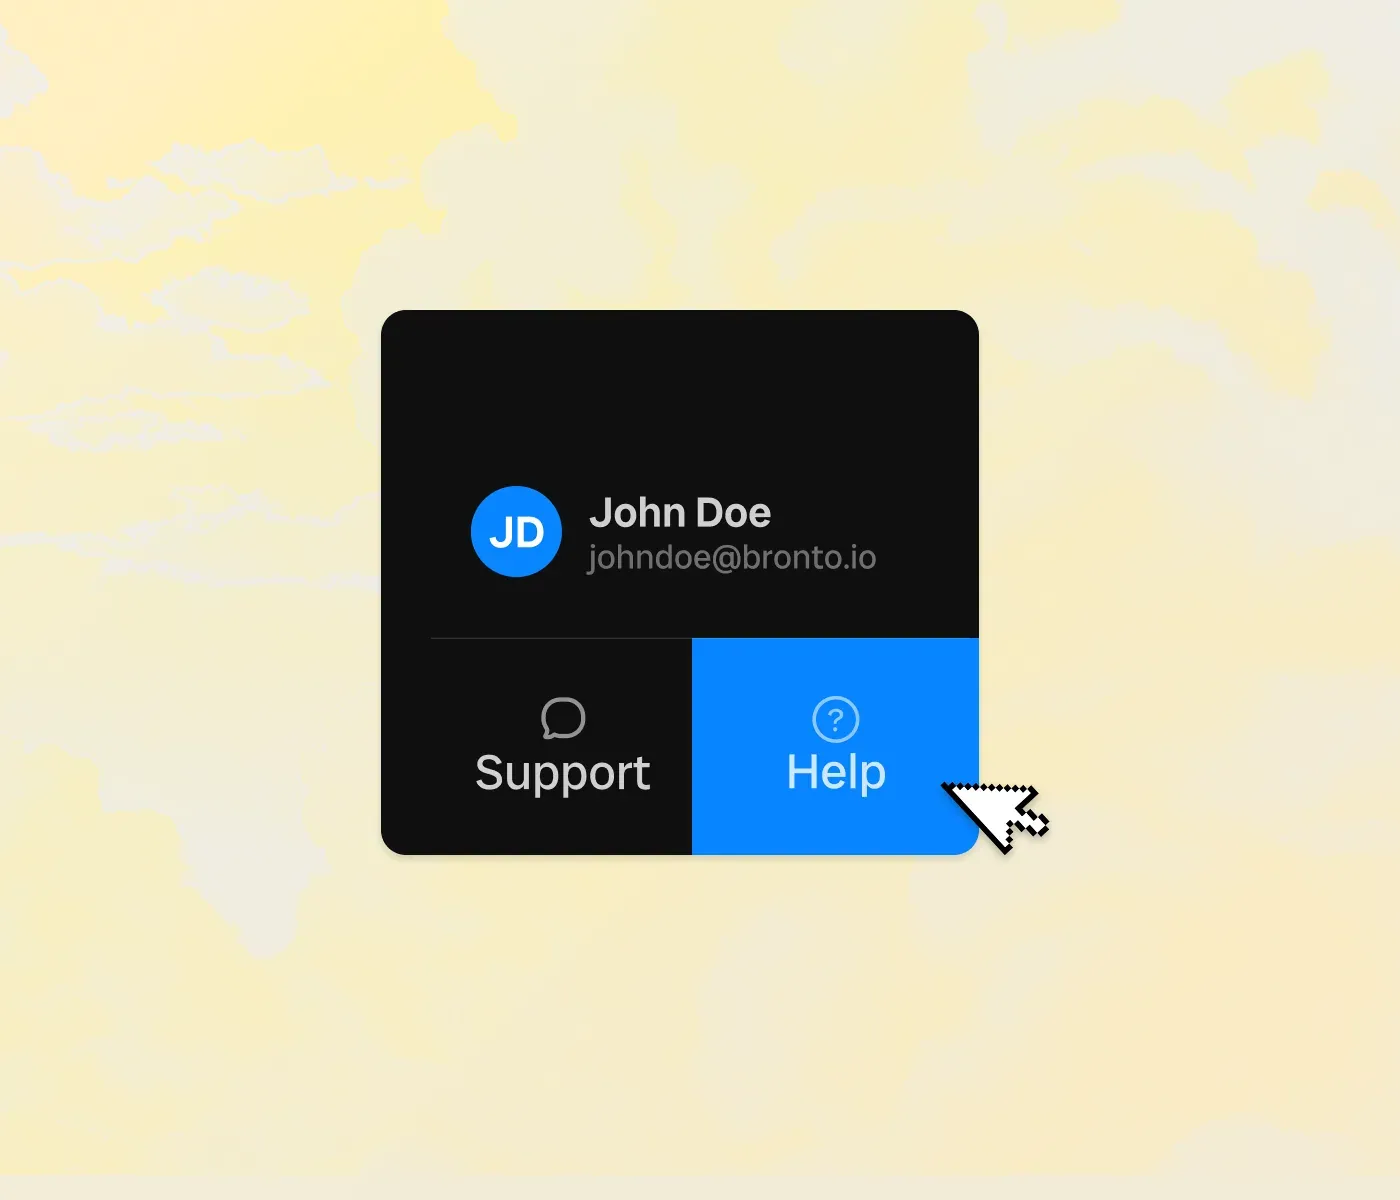
The Bronto help page has been added as a dedicated place to find all the resources and support you might need. From the help page you can find documentation, quick start guides, contact information for our support team, and more.
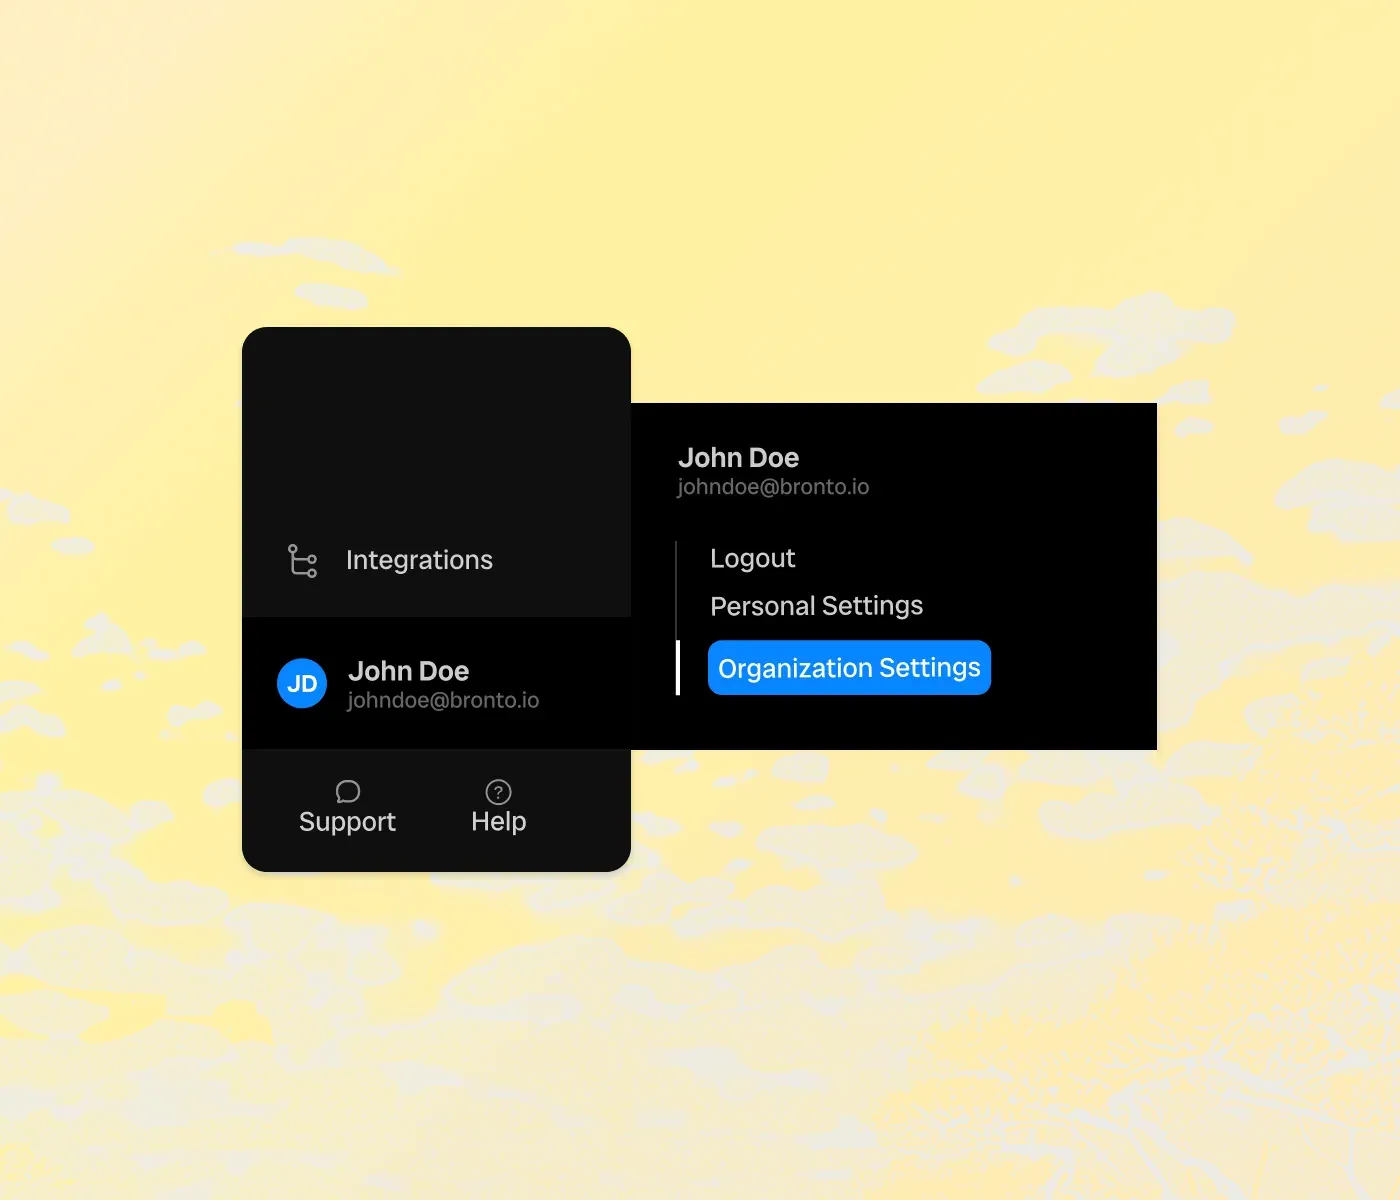
You can now control the level of access your users have to various resources in your Bronto account.
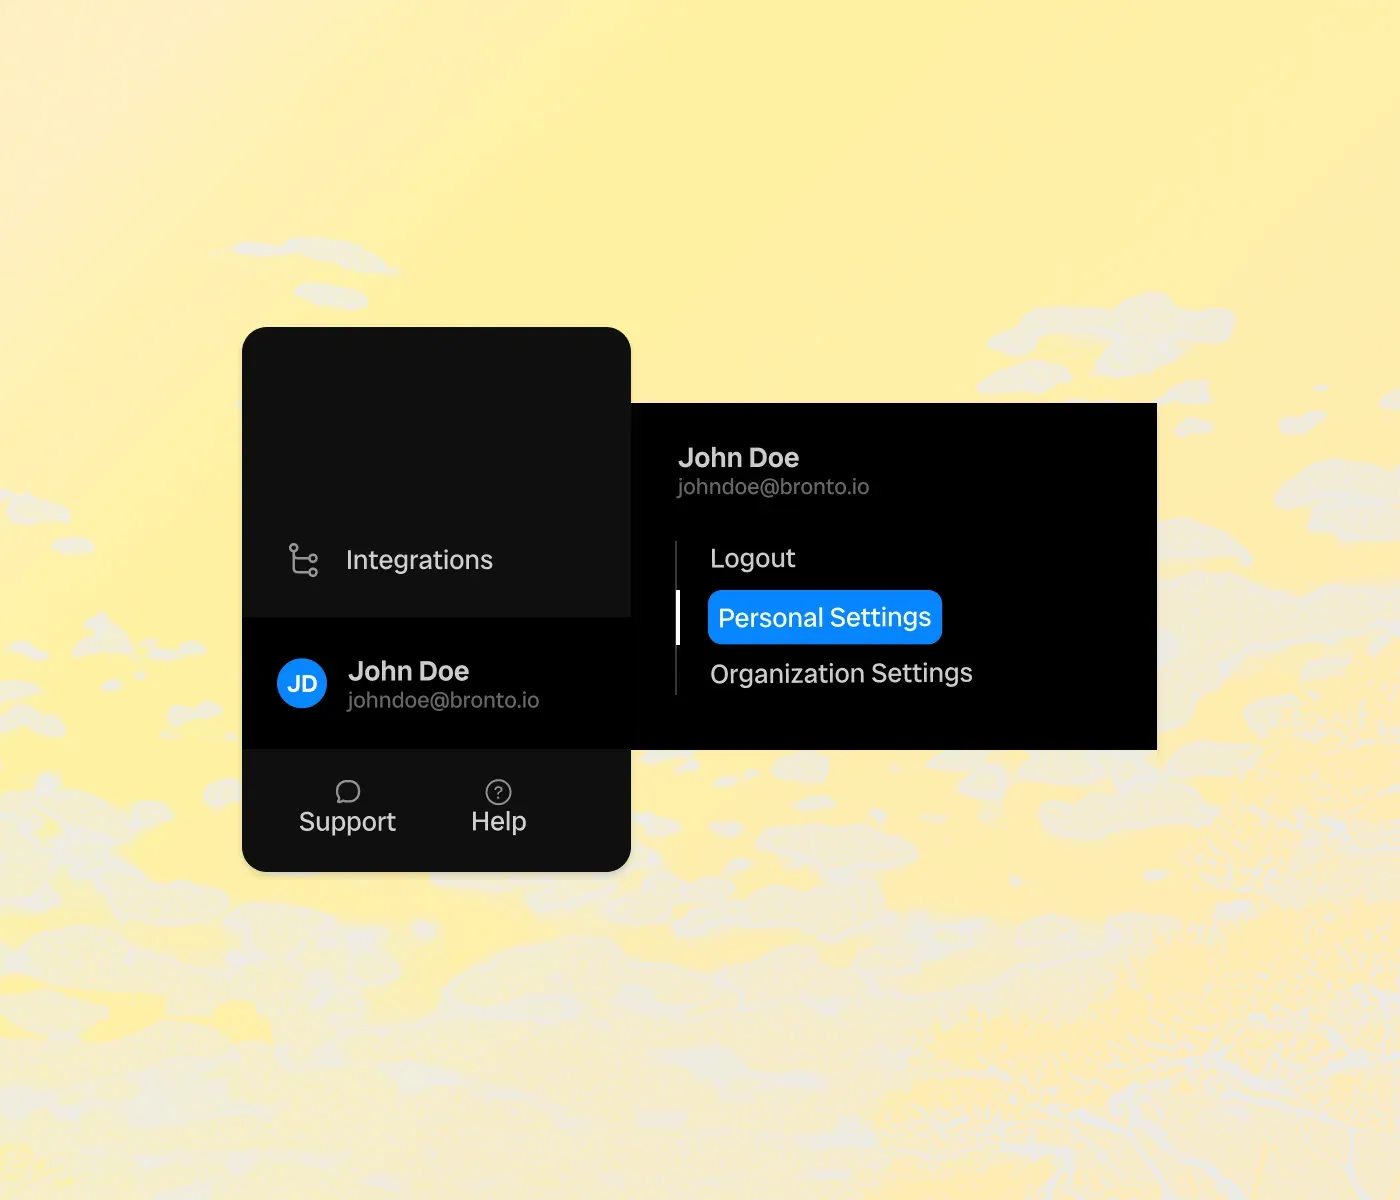
You can now enable multi-factor authentication (MFA) for your Bronto account. This will add an extra layer of security to your account by requiring users to provide a second form of authentication in addition to their password. To enable MFA, click the Settings item in the sidebar and then choose the MFA tab. From here you can manage your MFA settings.
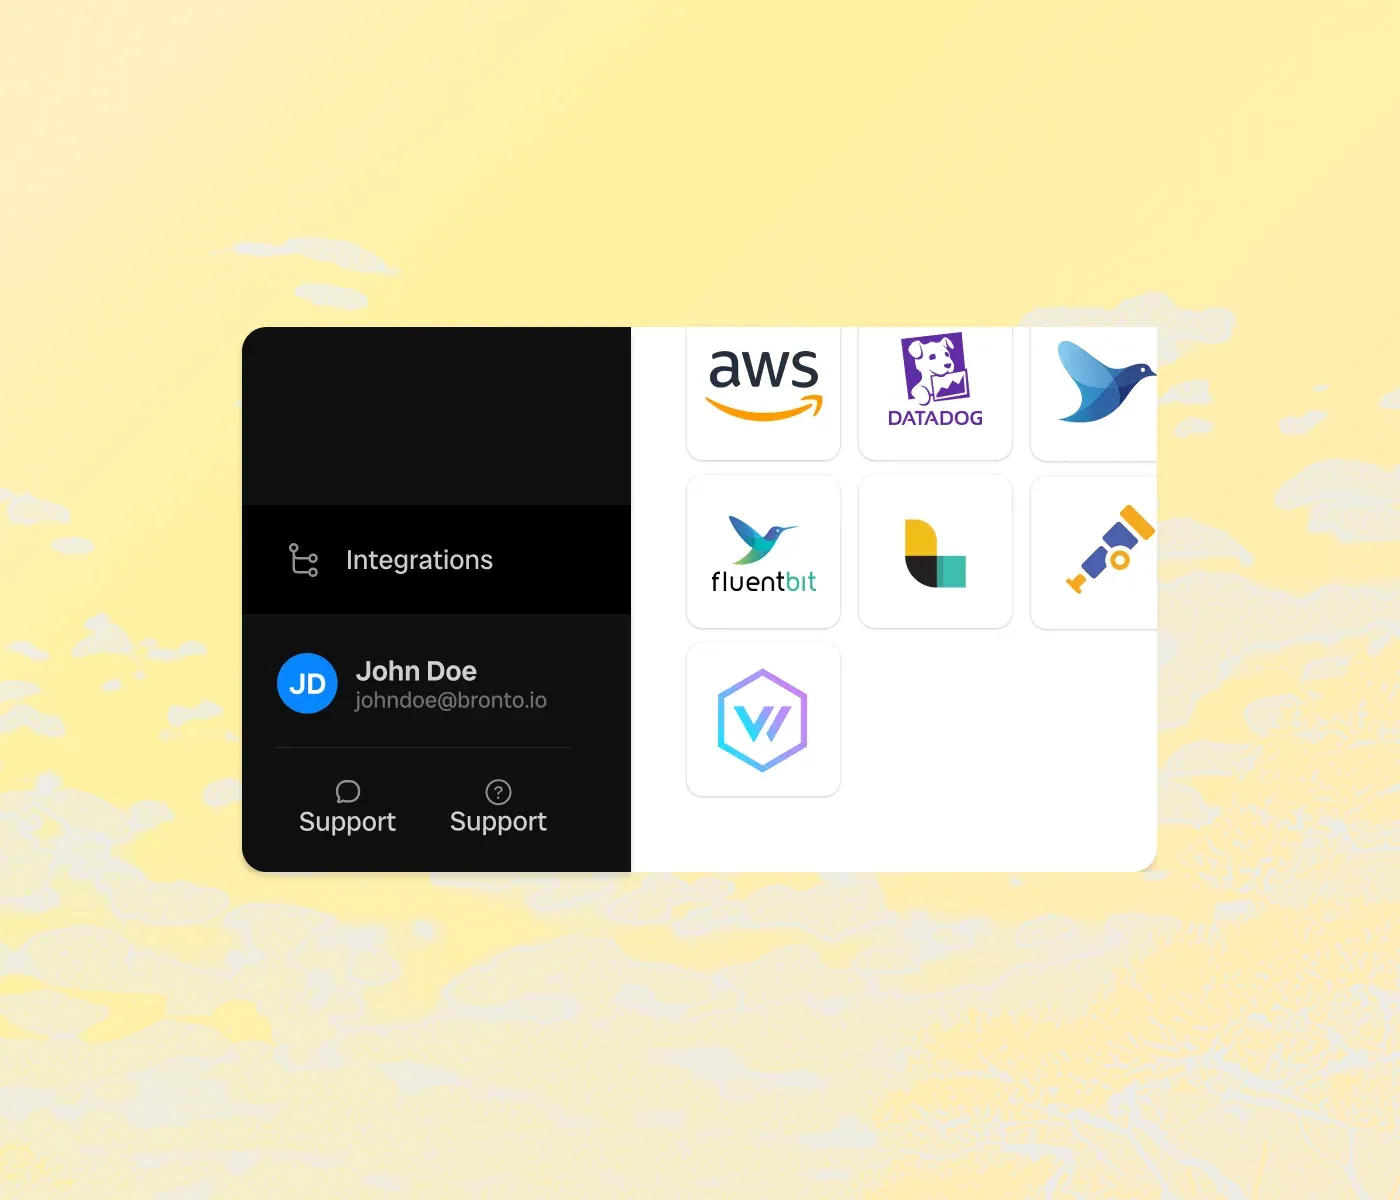
Bronto now has a dedicated page for managing your integrations. This page is where you can find configuration files and API keys for all of your integrations. To access the integrations page, click the Integrations item in the bottom left of the sidebar.
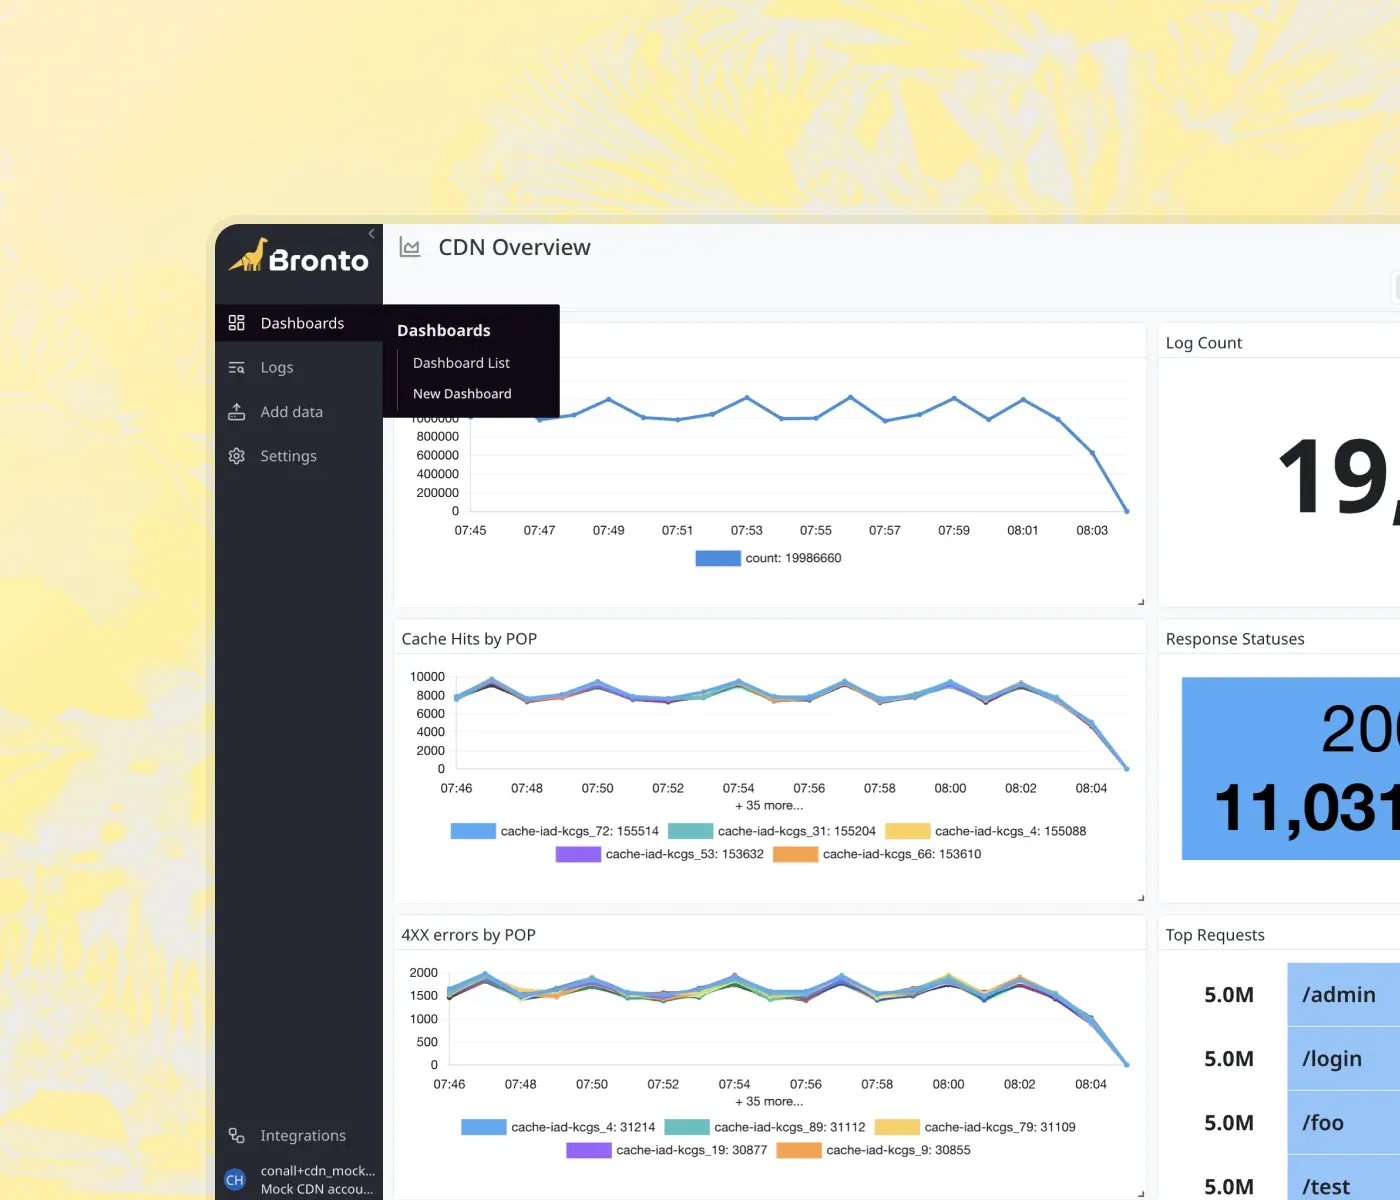
Dashboards are a key part of any log management solution. Out of the box Bronto will provide valuable insights to your data with pre configured dashboards. You can also create your own custom dashboards to meet your specific needs. Adding widgets to a dashboard is seamless: the query builder allows you to filter, group, and aggregate your data and then see a preview of that in multiple different visualization types.