Intelligent Observability,
Without the Complexity
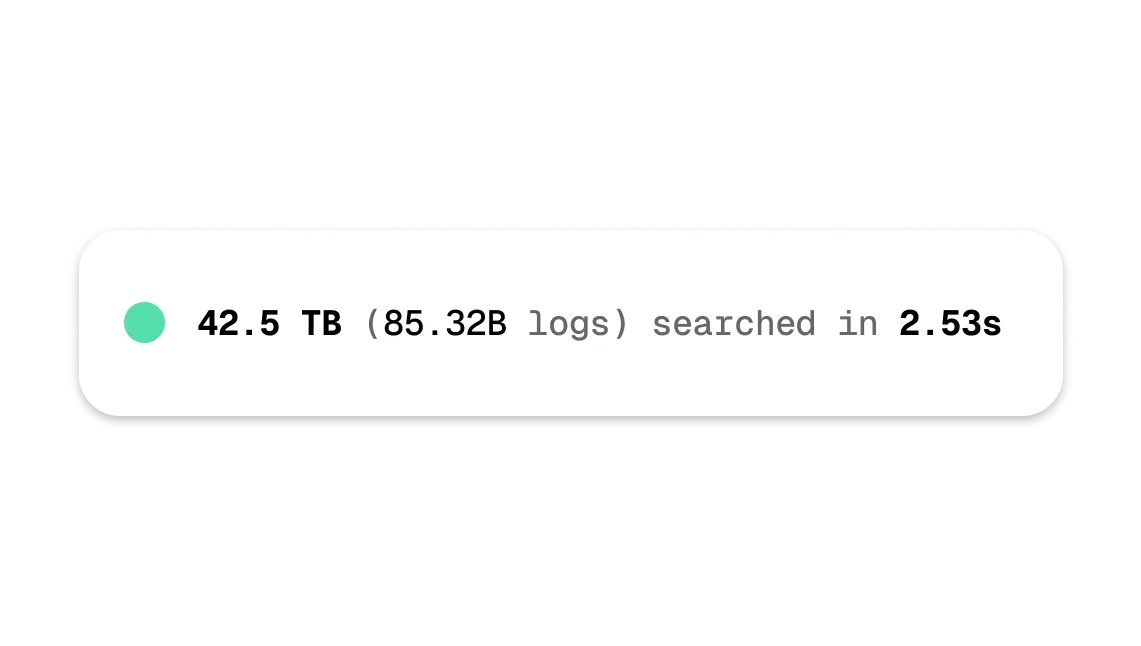
Search terabytes of logs, metrics, and traces in sub-seconds, with 12 months of retention out of the box.
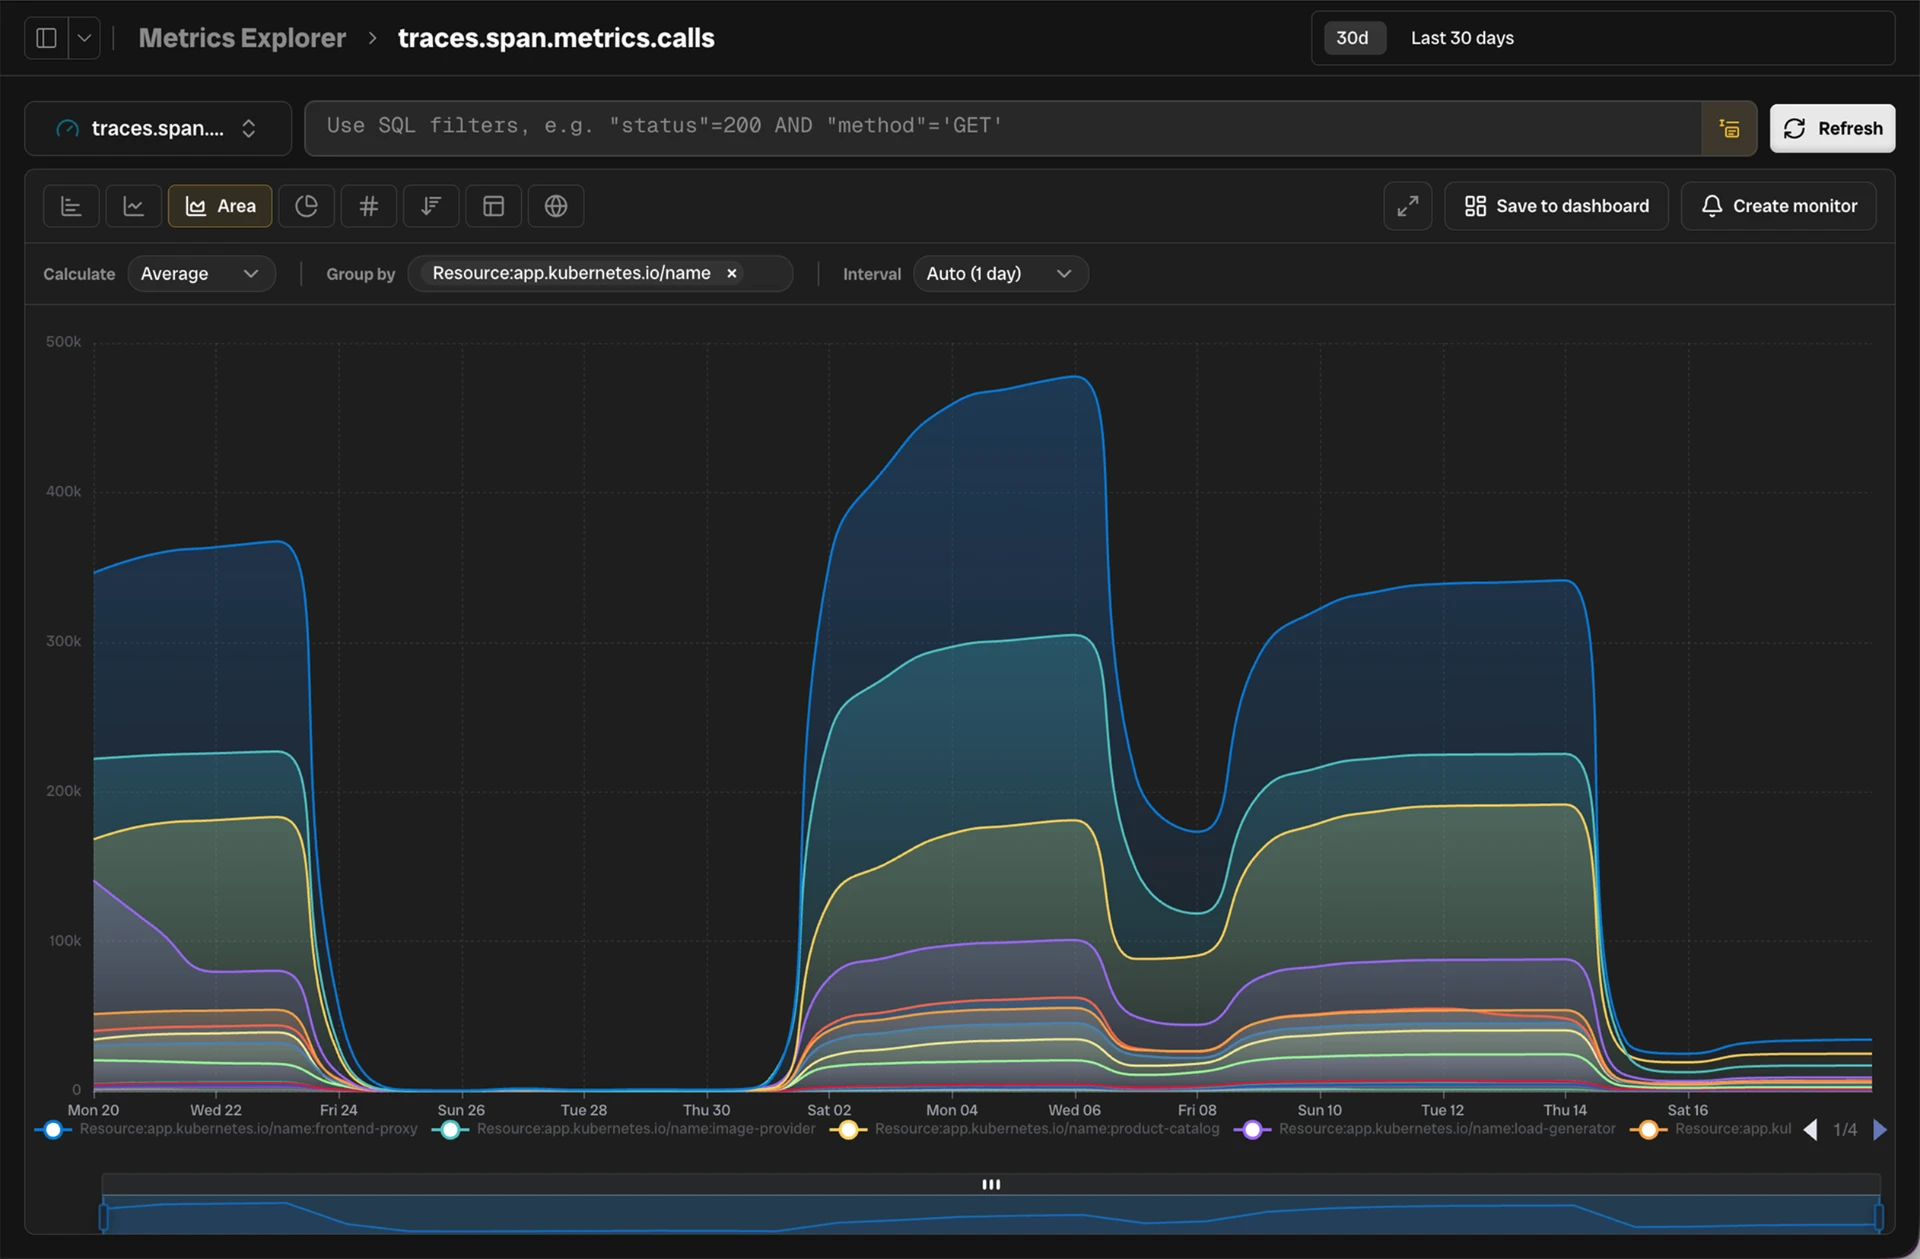
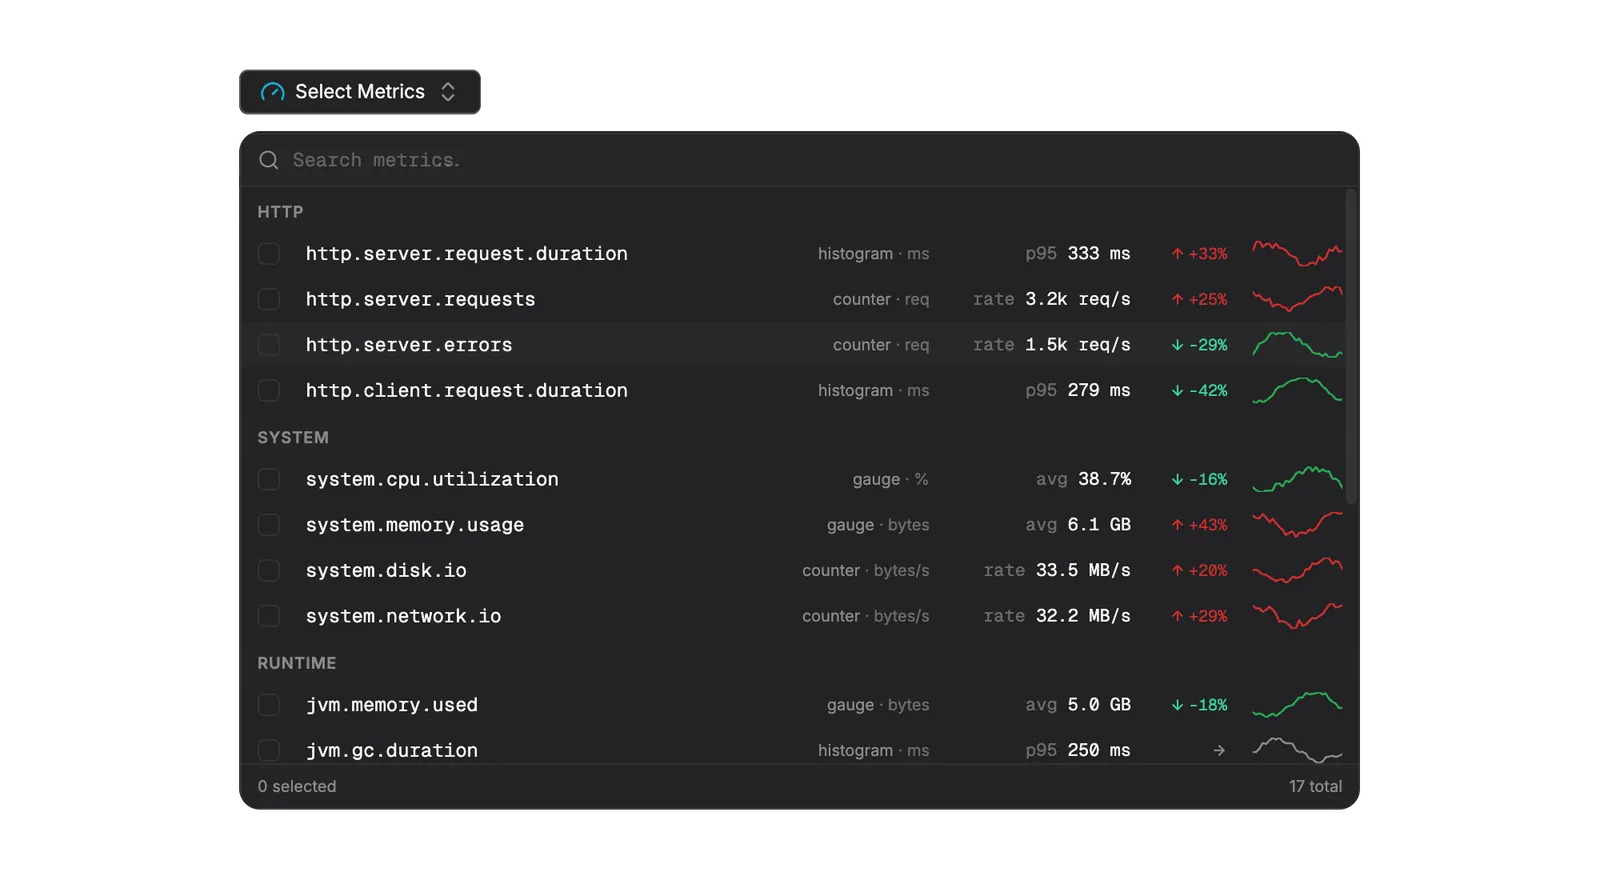
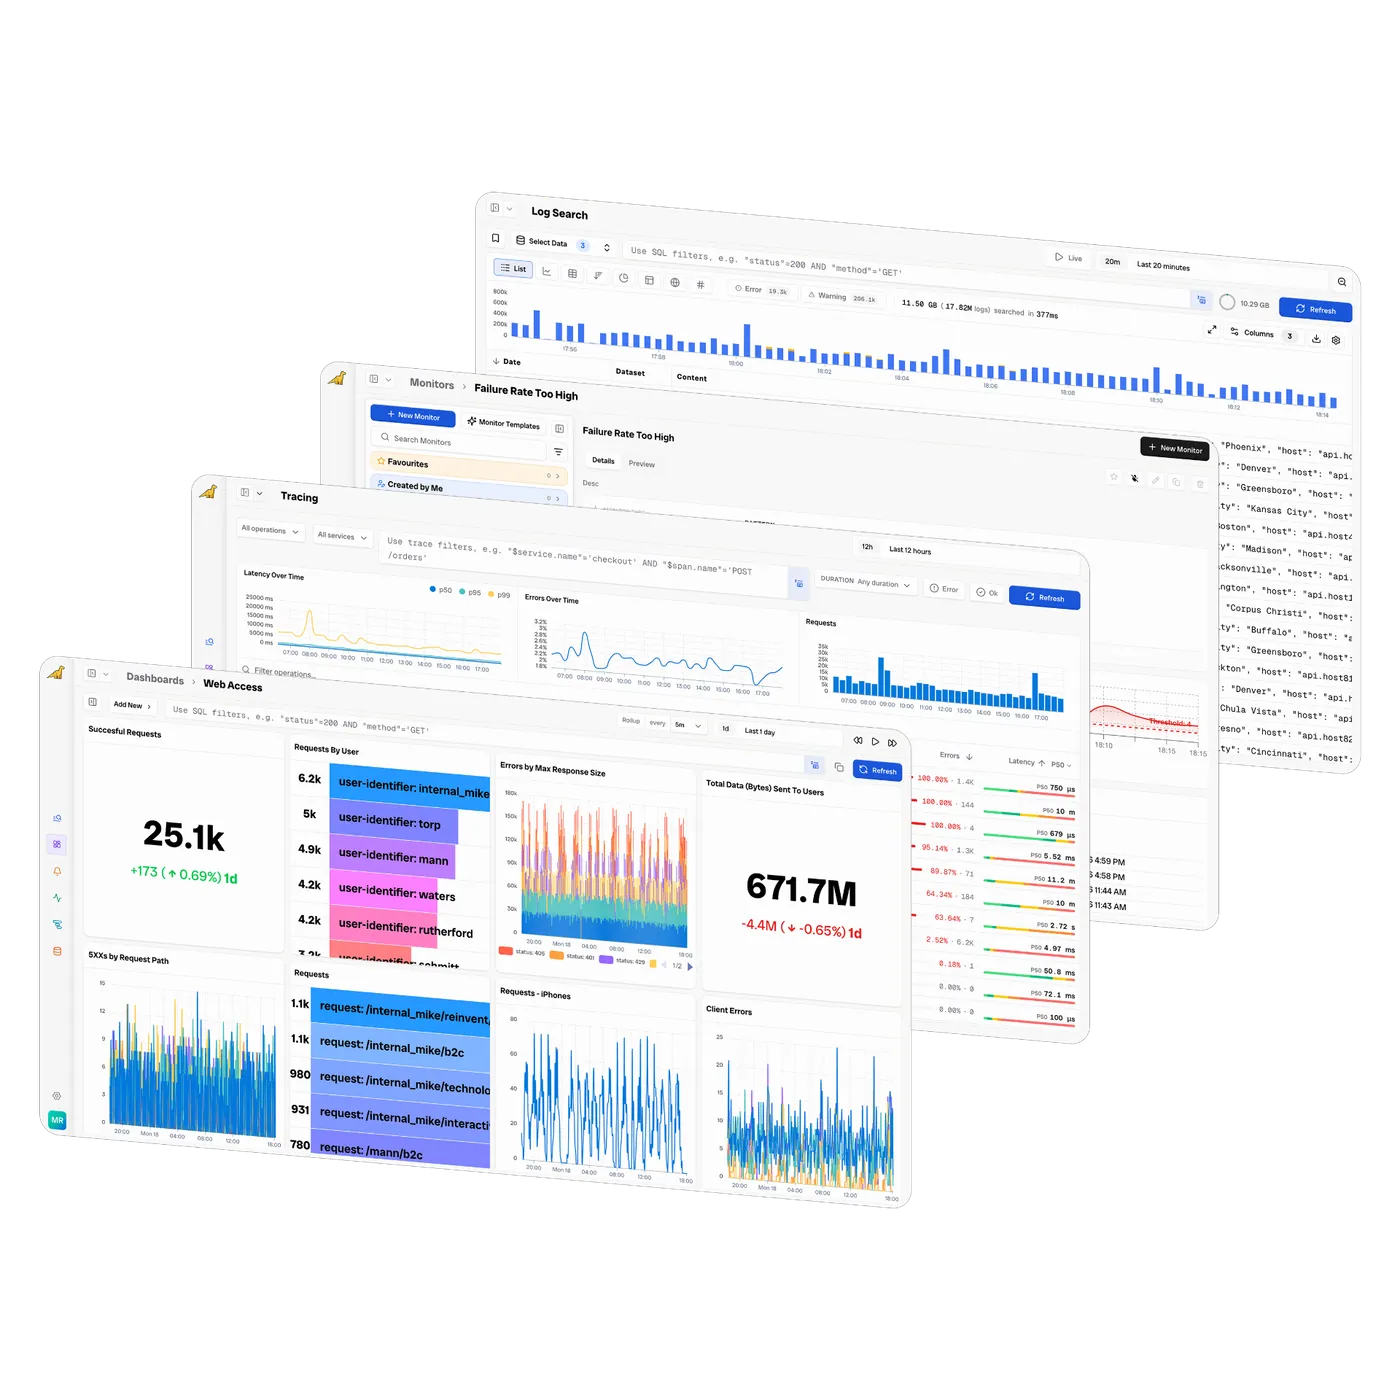
Logs
Filter with smart SQL autocomplete and keyboard-driven shortcuts. Results return in seconds — even across terabytes. Drill into any attribute, view raw logs, or jump straight into traces from the log table.


Full fidelity, always hot, fully managed data

Always Hot Data
Every byte of telemetry is instantly queryable — no rehydration, no cold tiers, no waiting.

Long-Term Retention
12 months of retention included out of the box. Keep your data as long as you need it.

Full Fidelity, Full Coverage
No sampling, no aggregation, no data loss. Every log, trace, and metric stored exactly as received.
Transparent Usage & Controls
See exactly what you're ingesting and what it costs. Set quotas, alerts, and exclusion filters in seconds.

Fast at Large Scales
Sub-second queries across petabytes of data. Purpose-built indexing that scales with your growth.

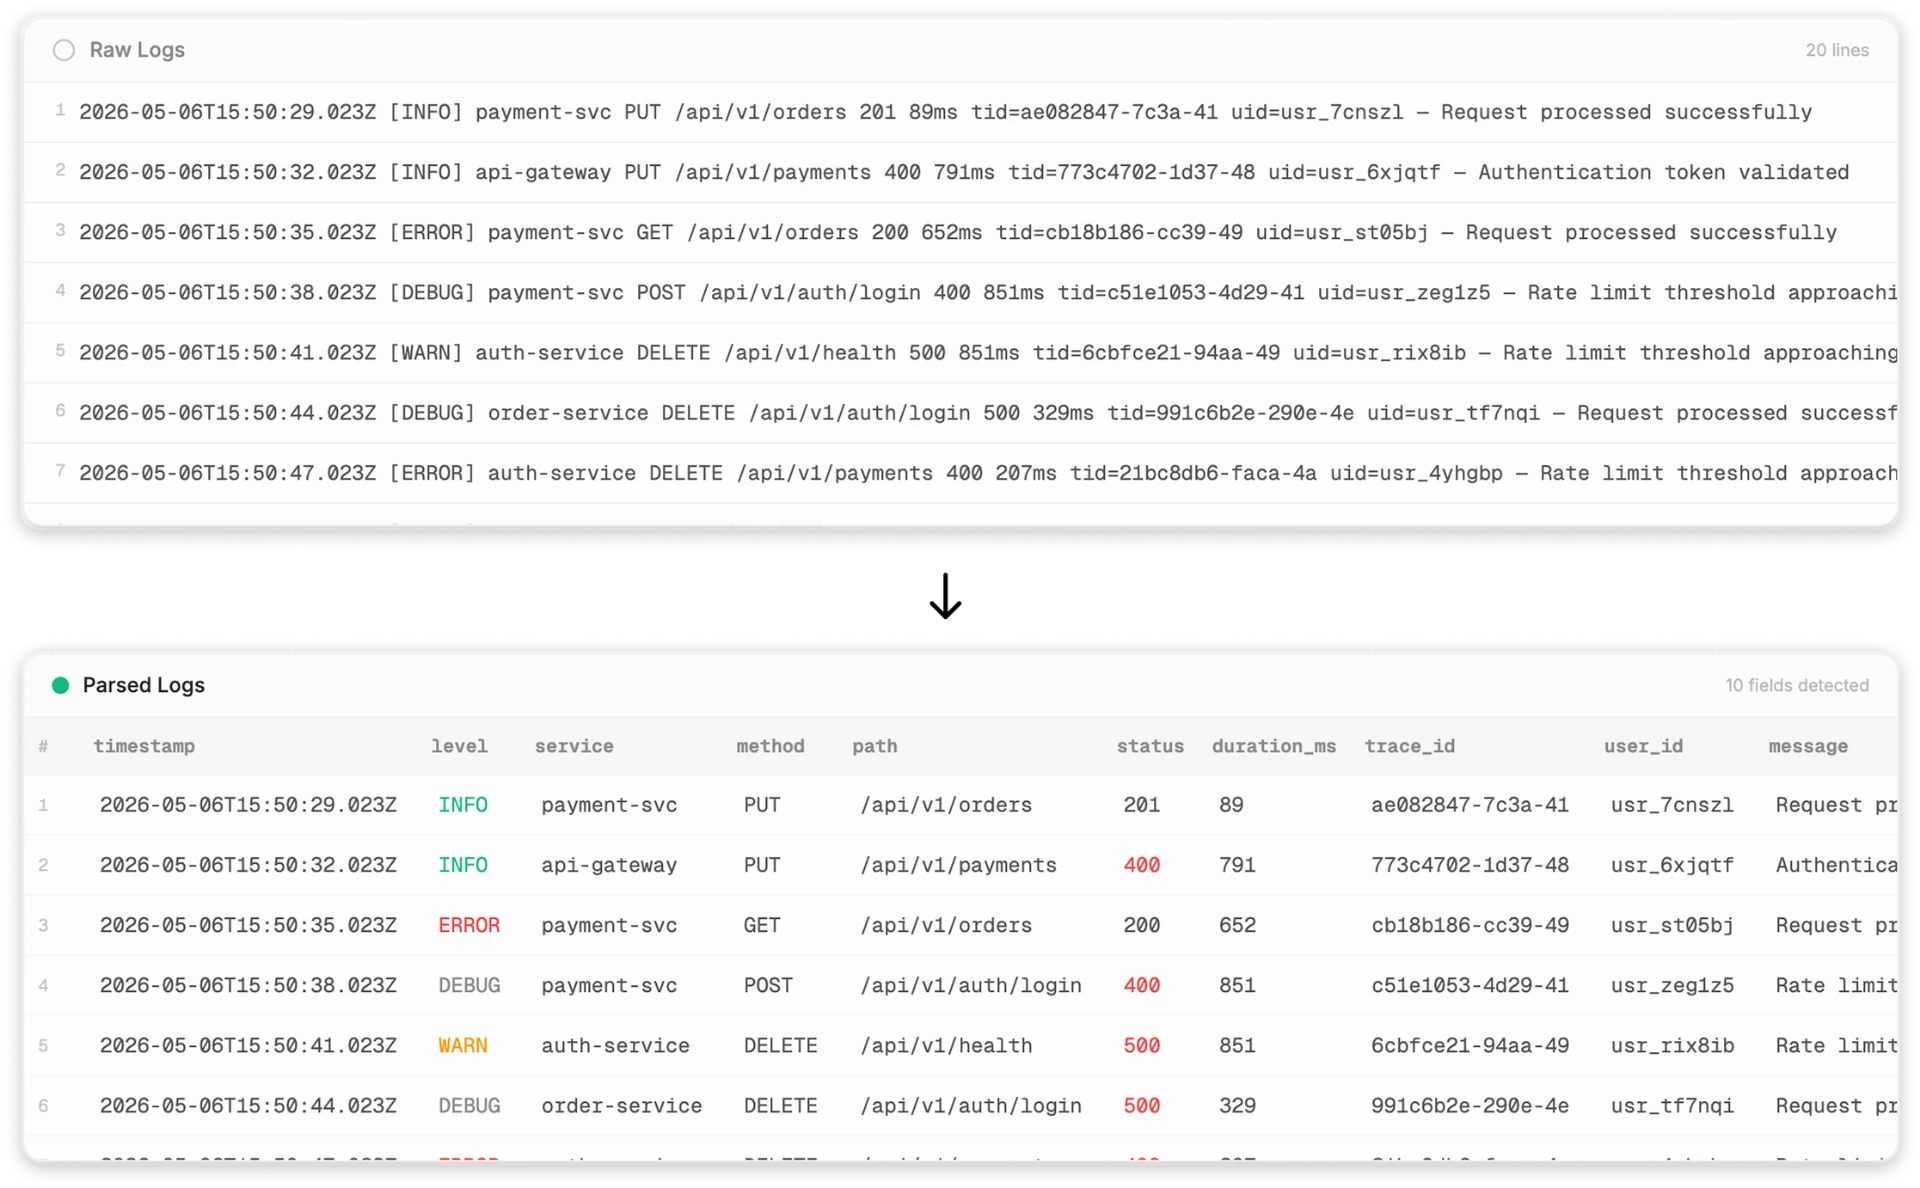
Always Parsed & Searchable
At ingestion, Bronto parses your logs using known formats or AI — so every field is structured and instantly searchable.

Simple by design, faster to resolve

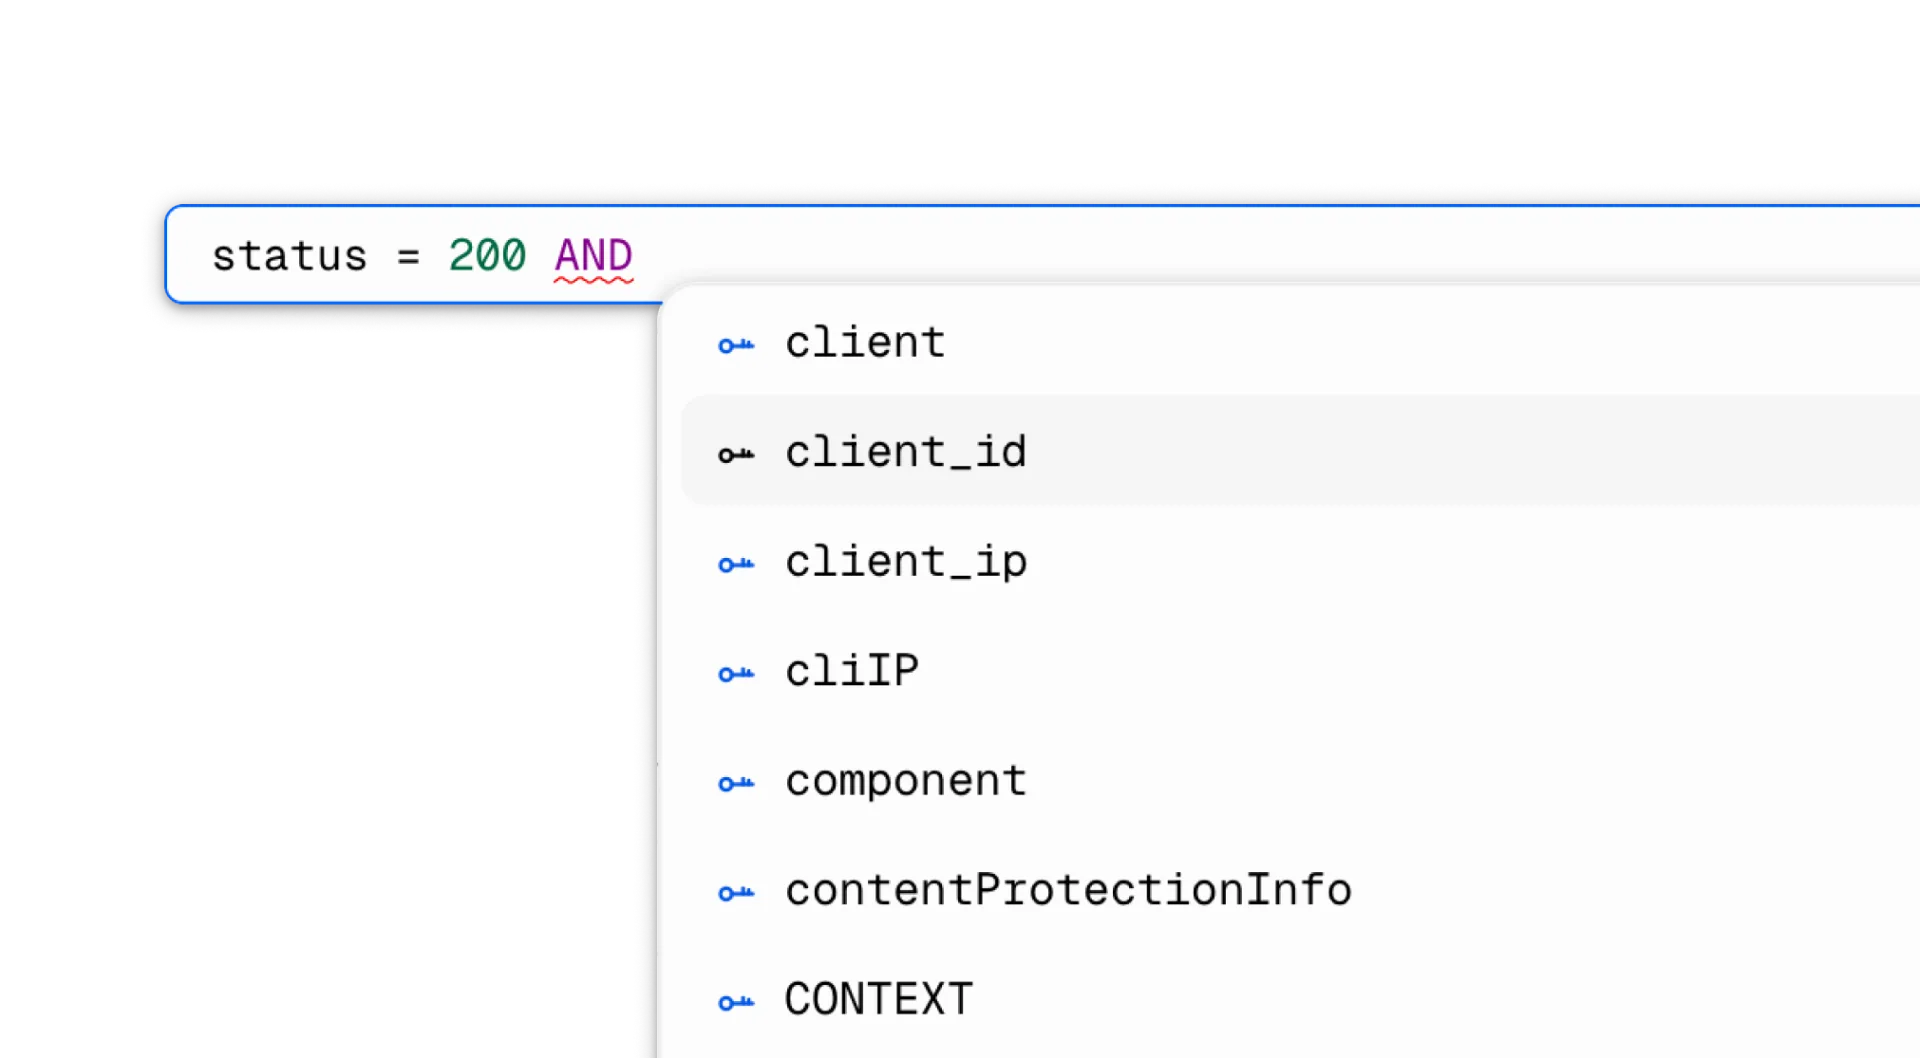
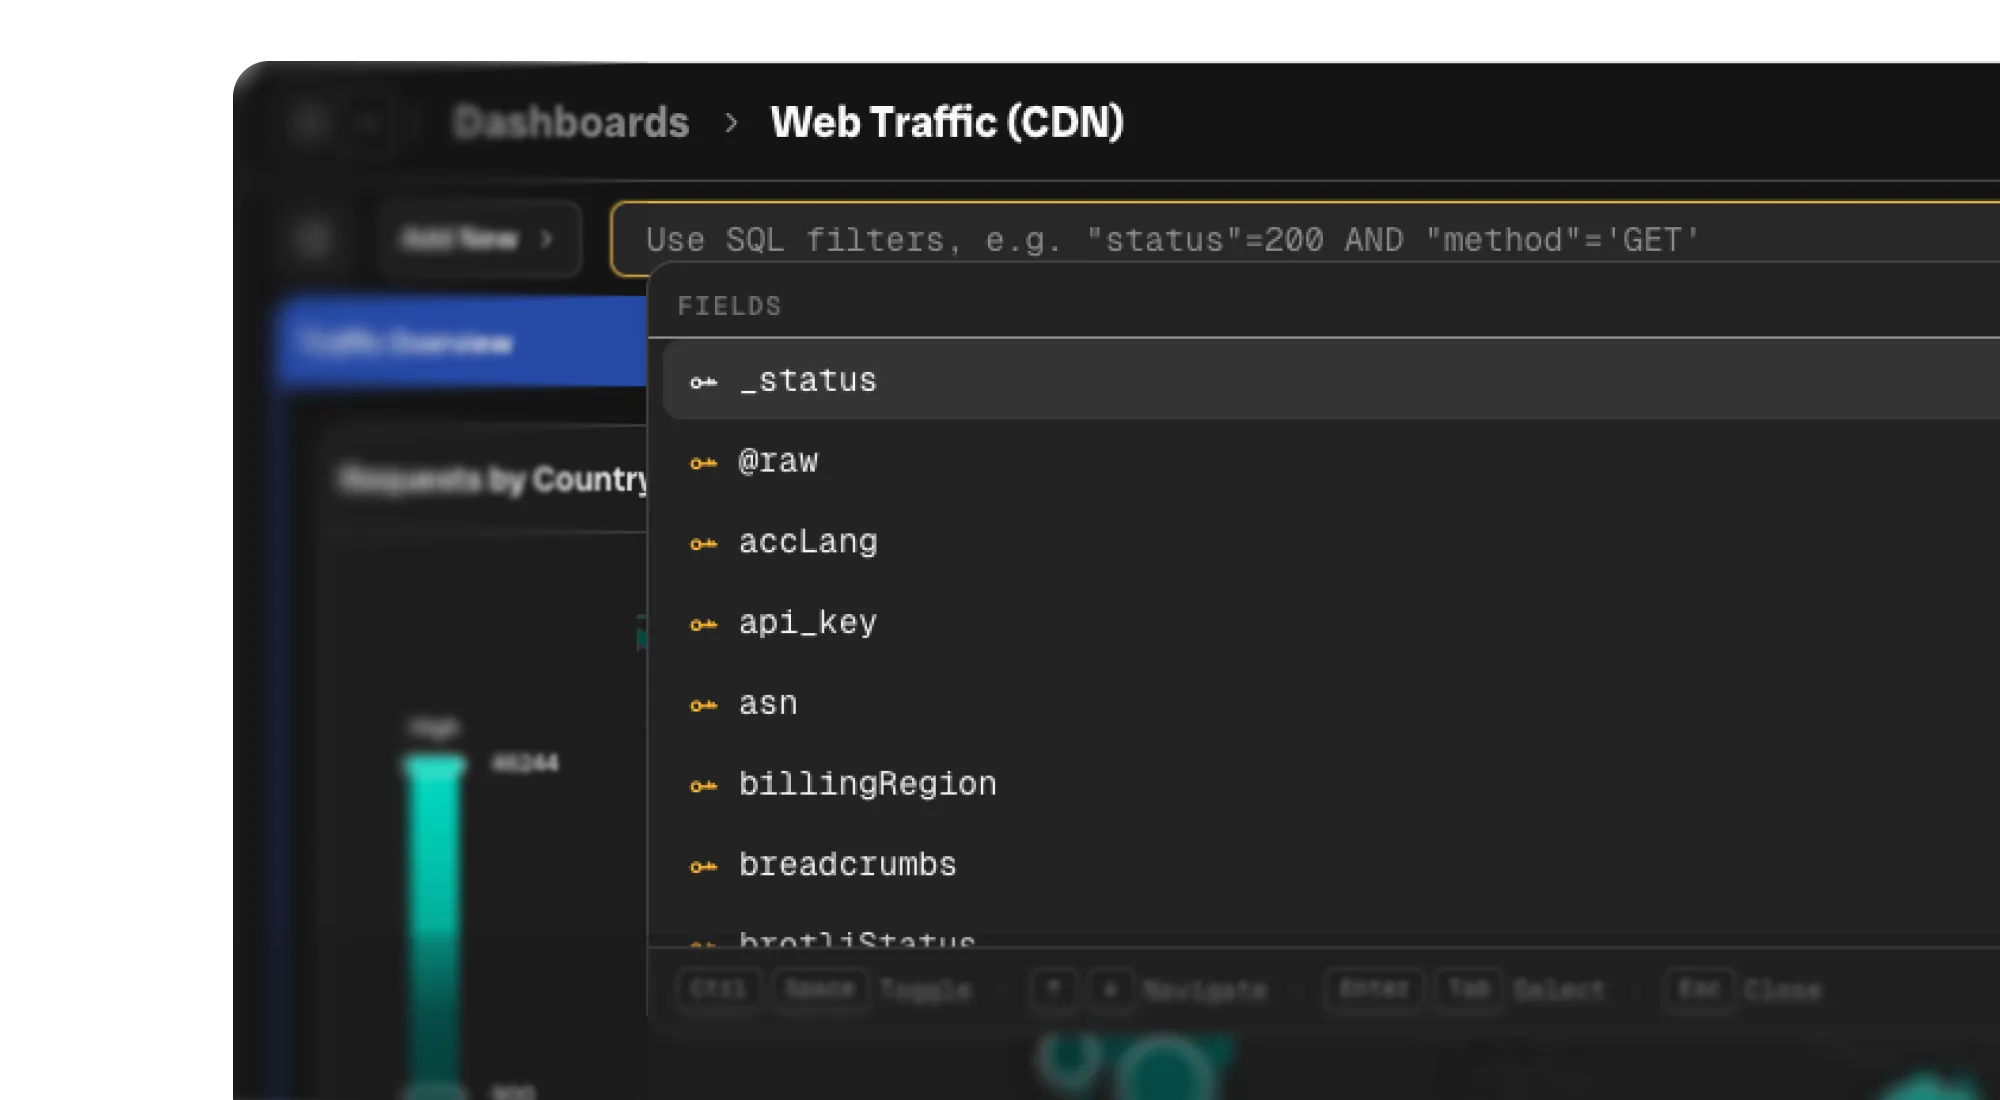
Smart SQL Autocomplete
Write queries faster with intelligent suggestions that know your schema.
Sub-Second Search
Filter terabytes of logs and get results in under a second.

Live Tail
Watch your logs stream in live as events happen, with instant filtering on the running feed.
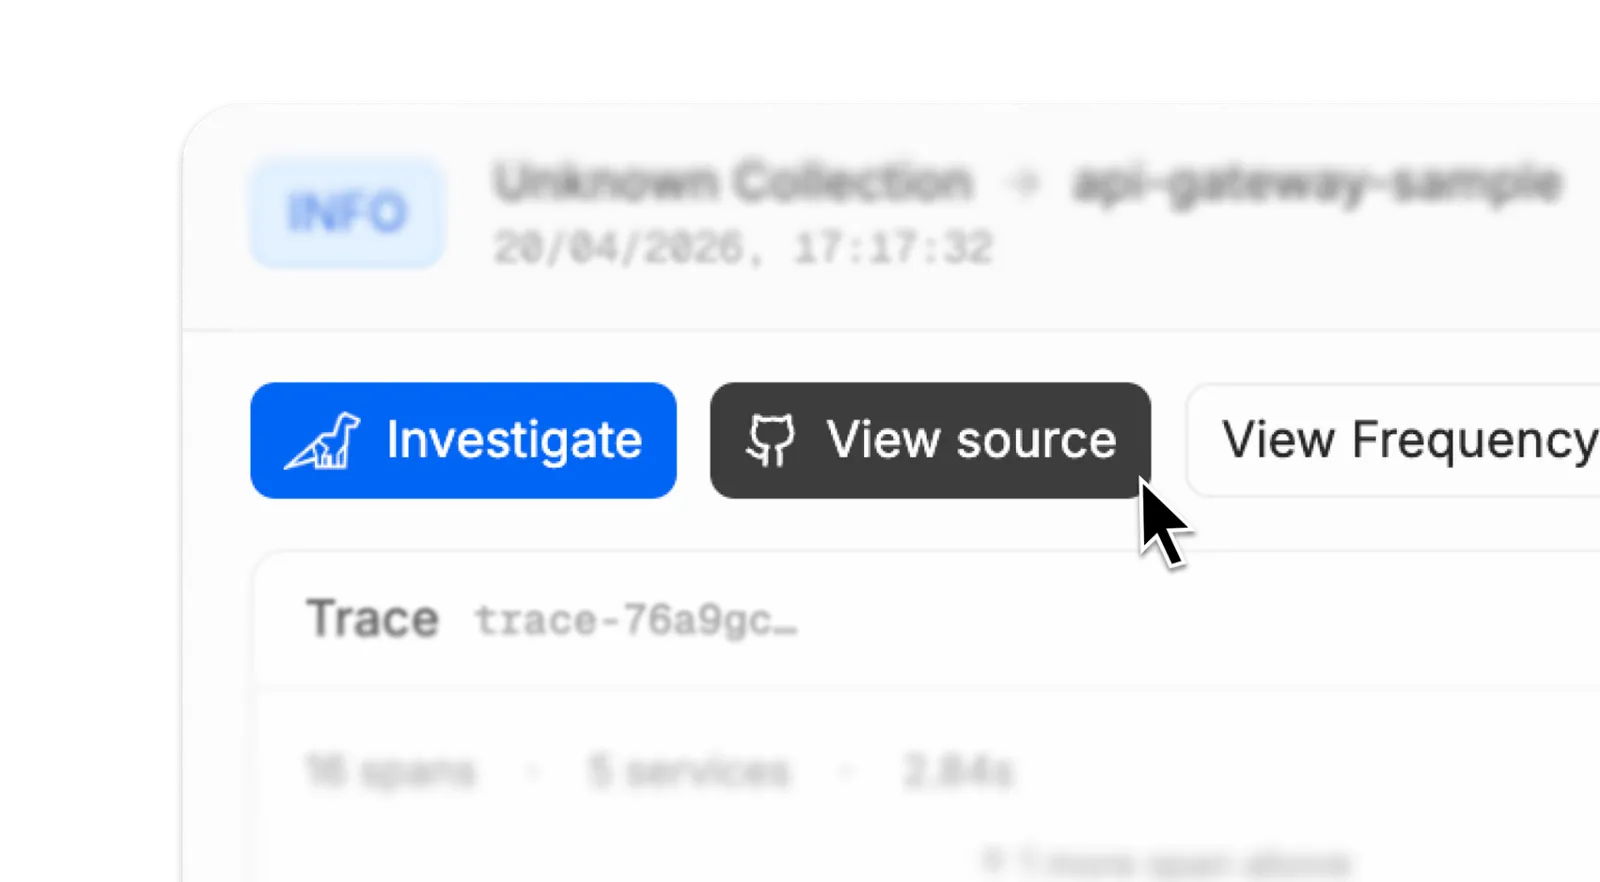
Link Logs to Code
Jump from any log line straight to the exact source line that emitted it.
Log-to-Trace Correlation
Jump from any log line directly into its parent trace.
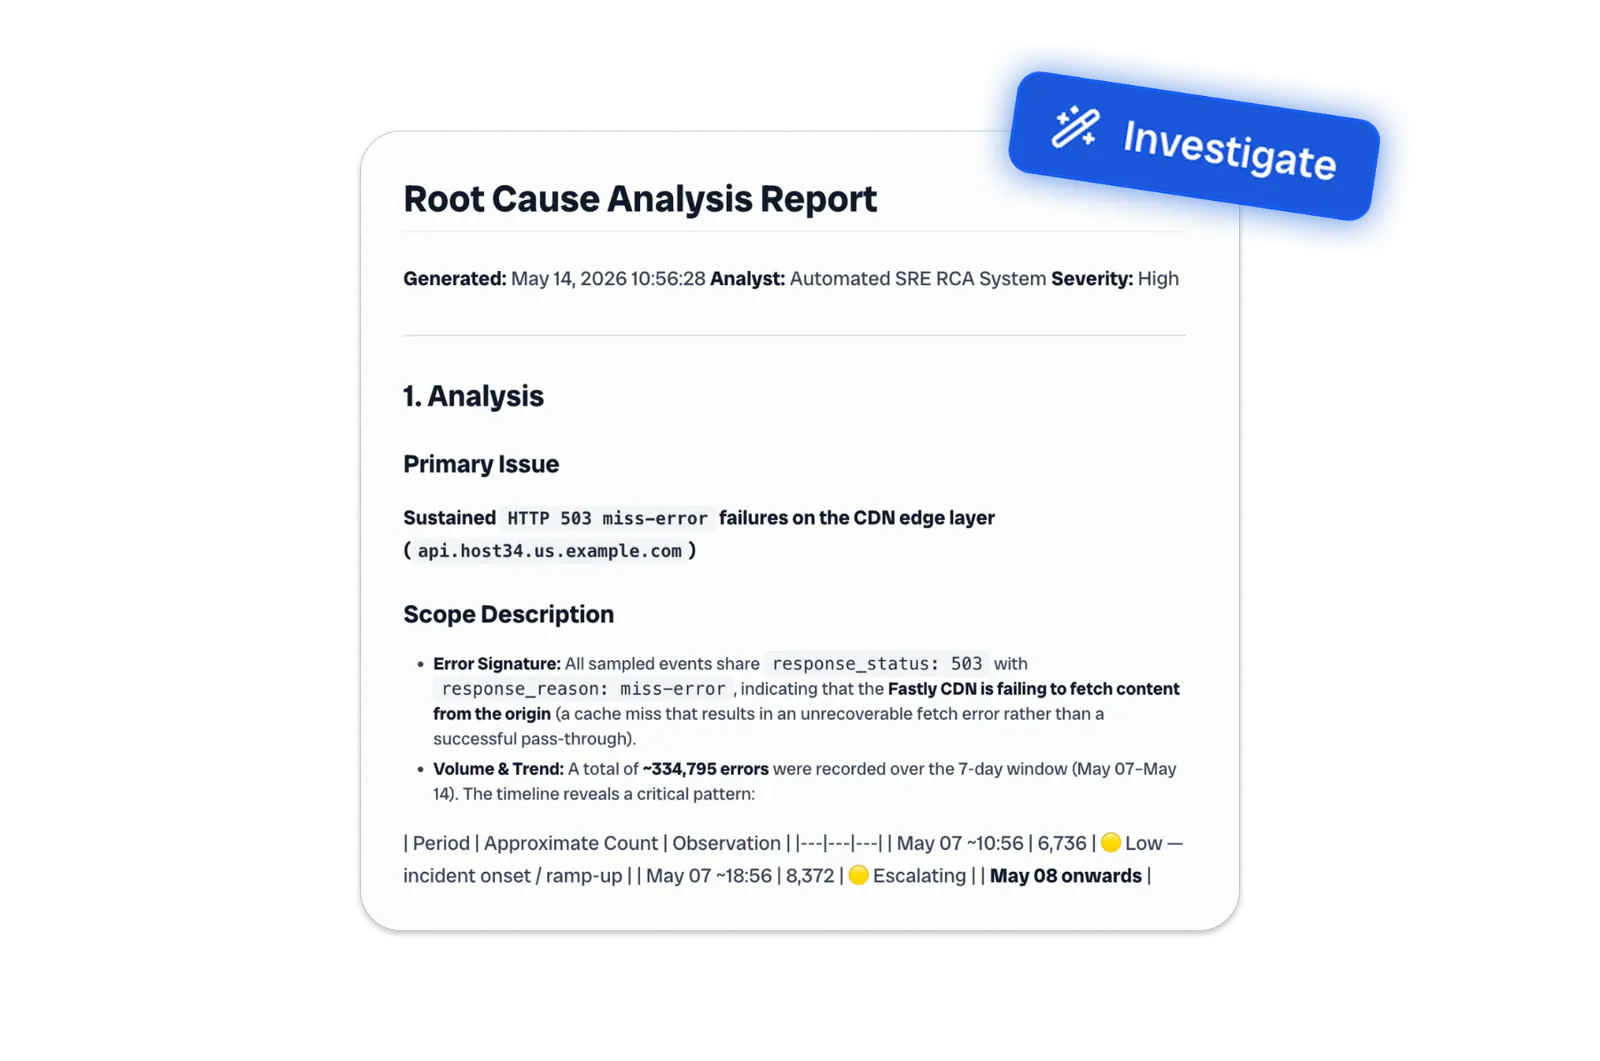
AI Investigation
Let AI investigate issues across your logs and surface root causes in seconds.

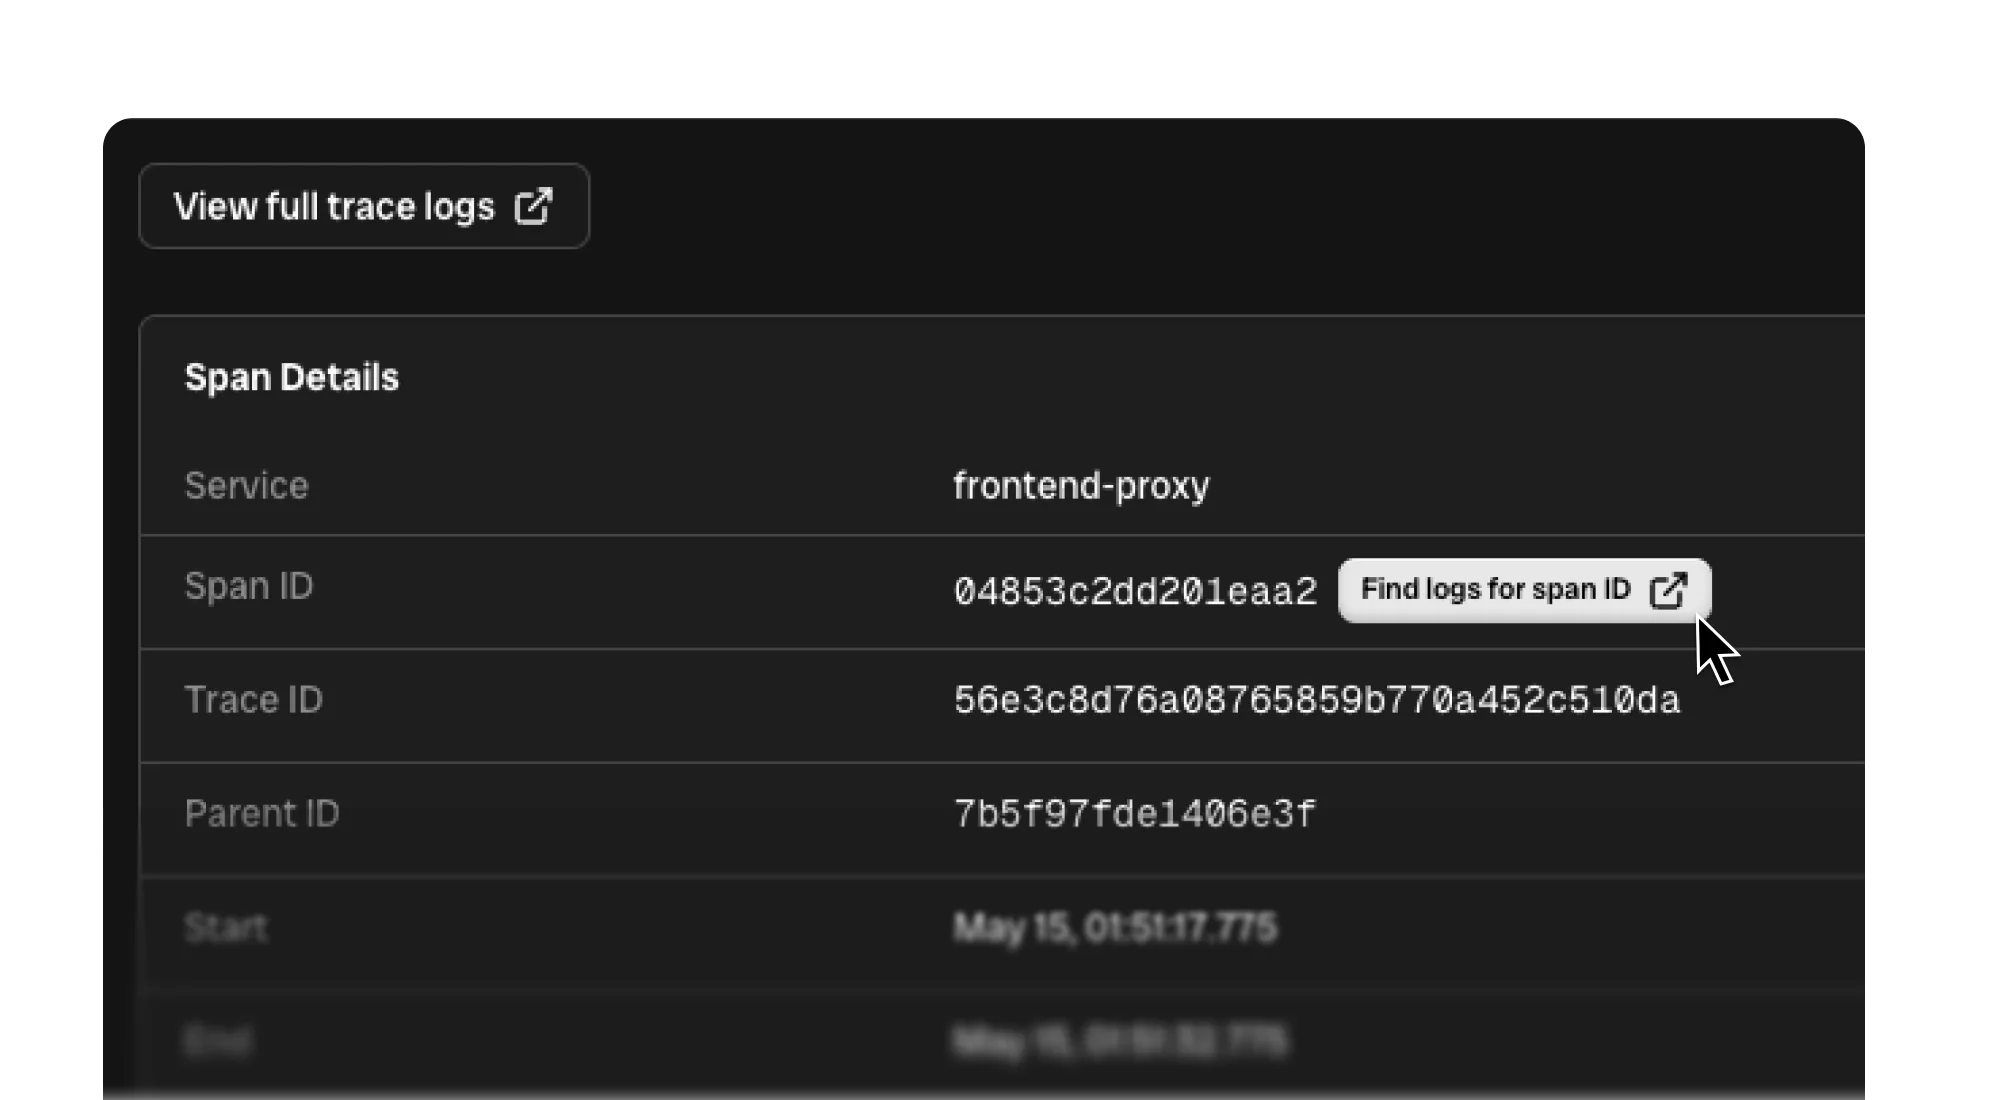
Trace-to-Log Linking
Jump from any span into its correlated log lines.
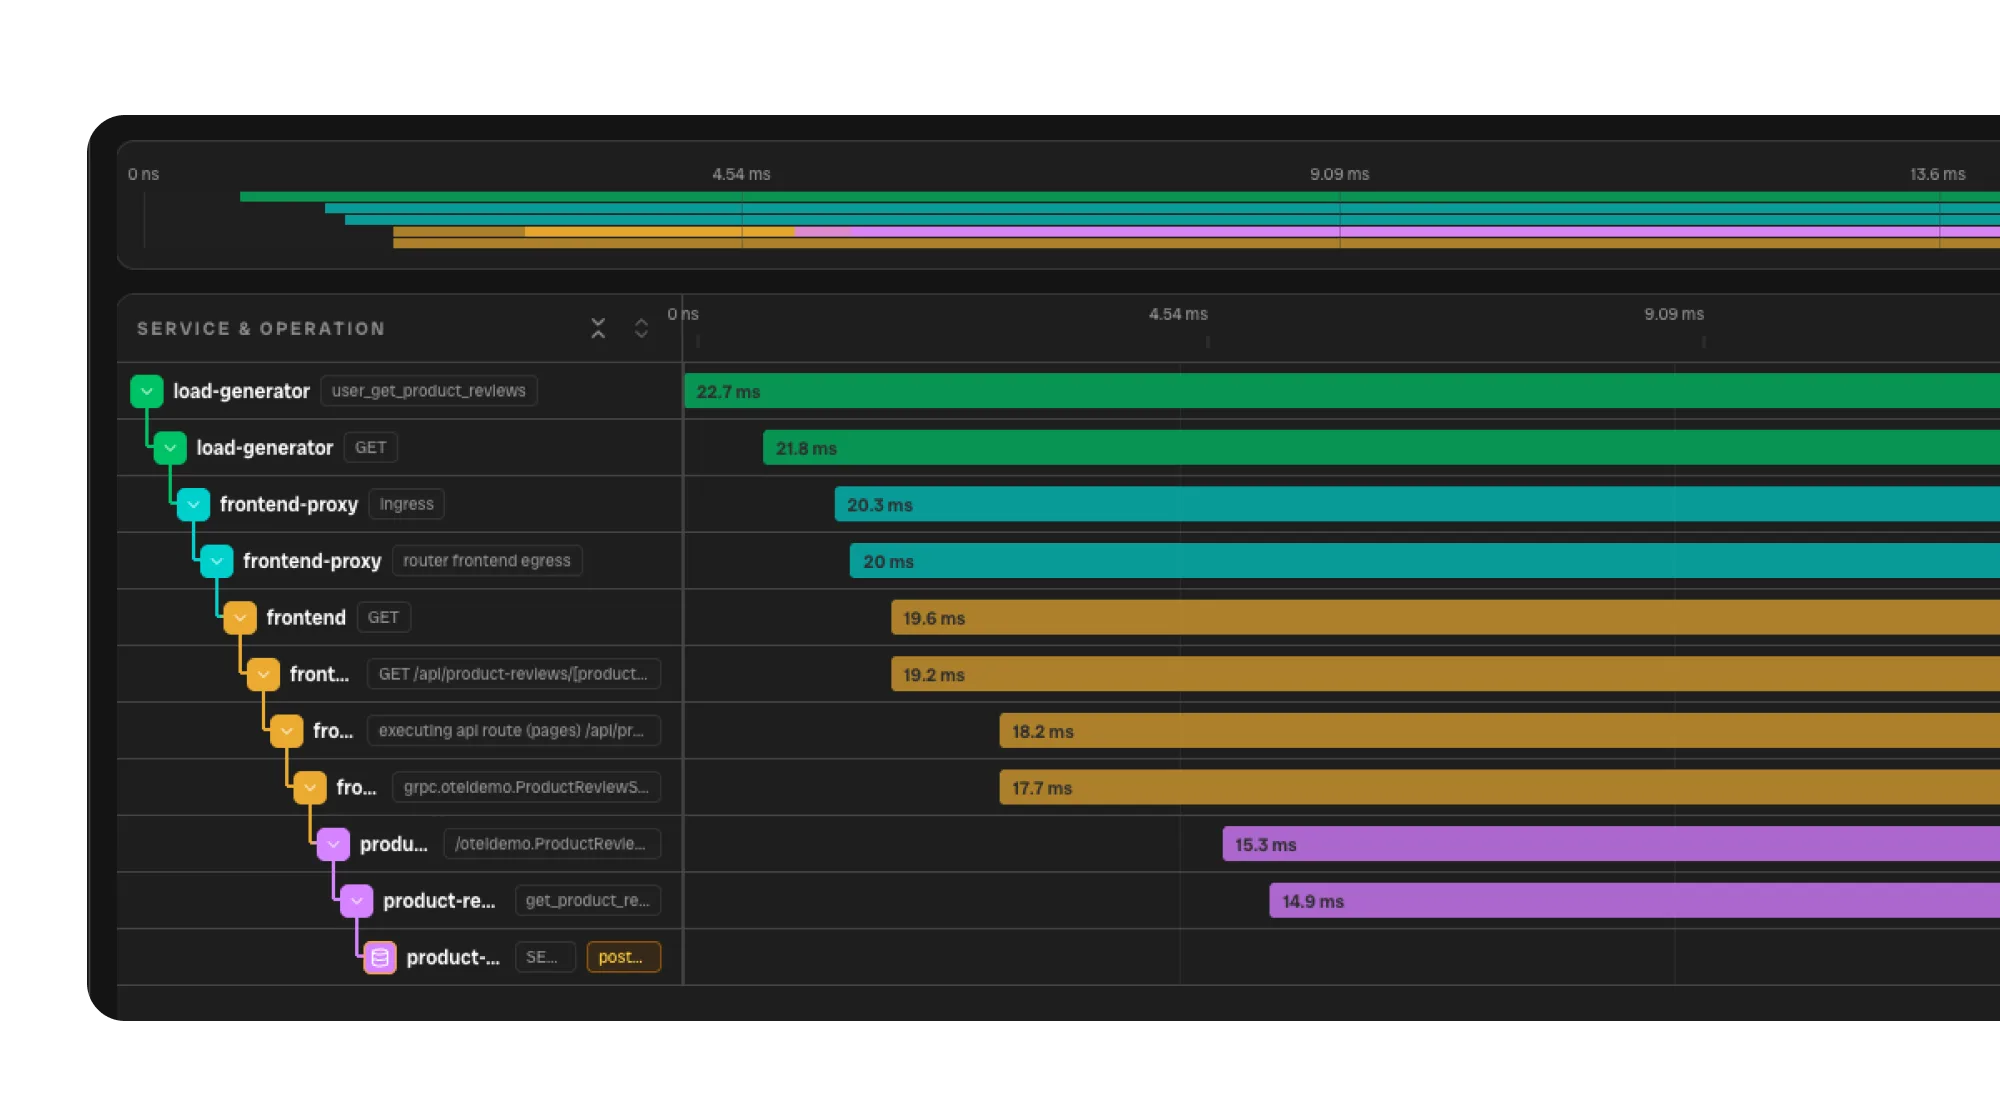
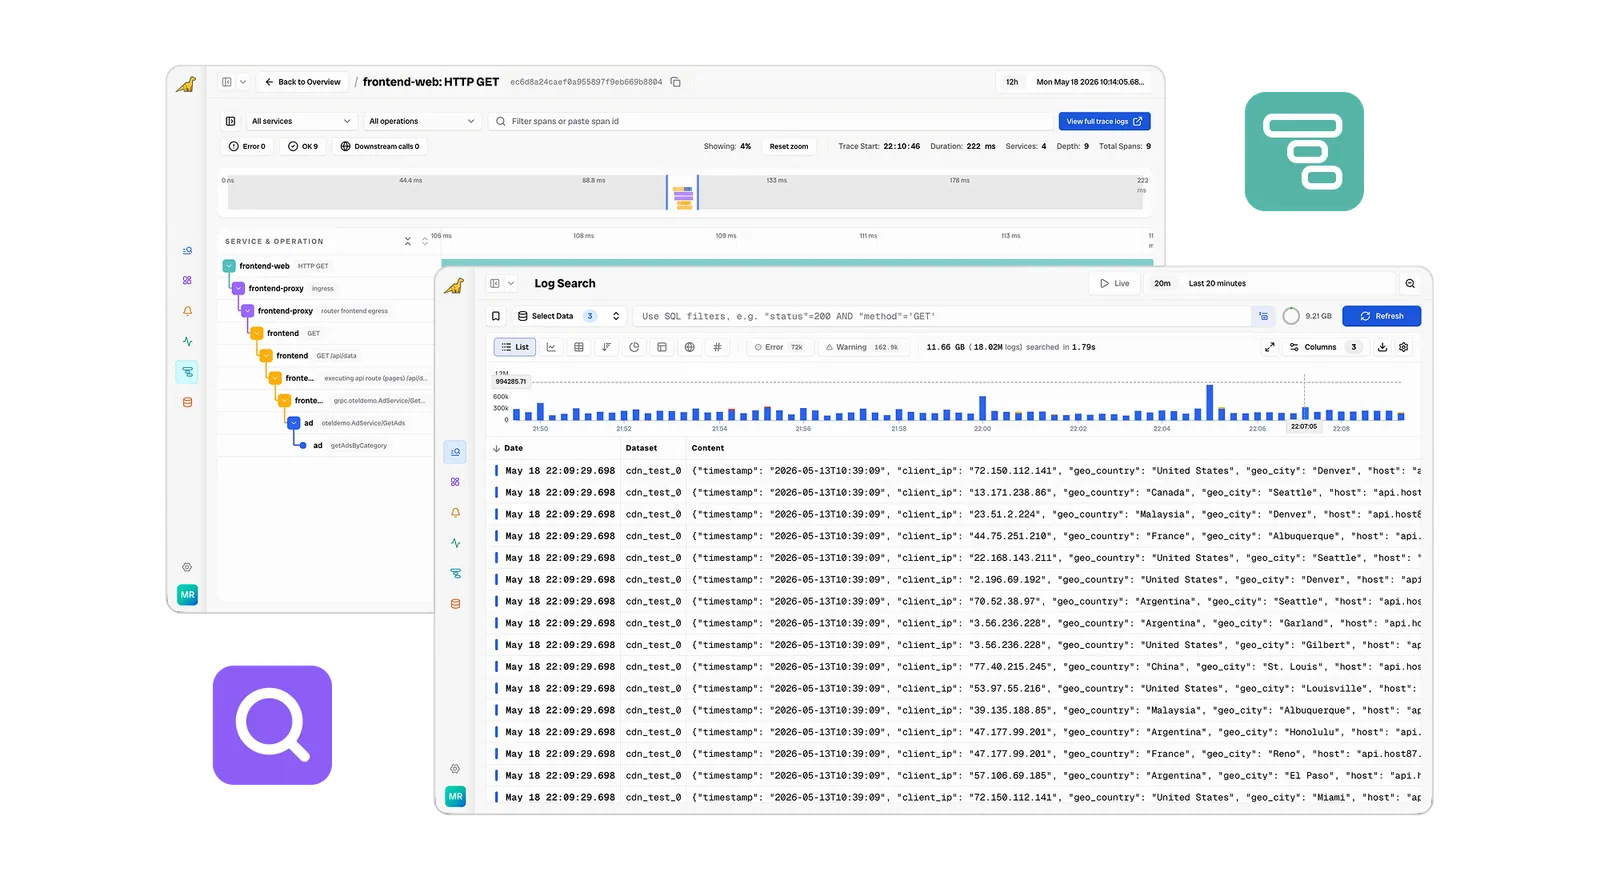
Full Span View
Drill into every span across services, spot errors instantly, and filter the waterfall to isolate slow paths.
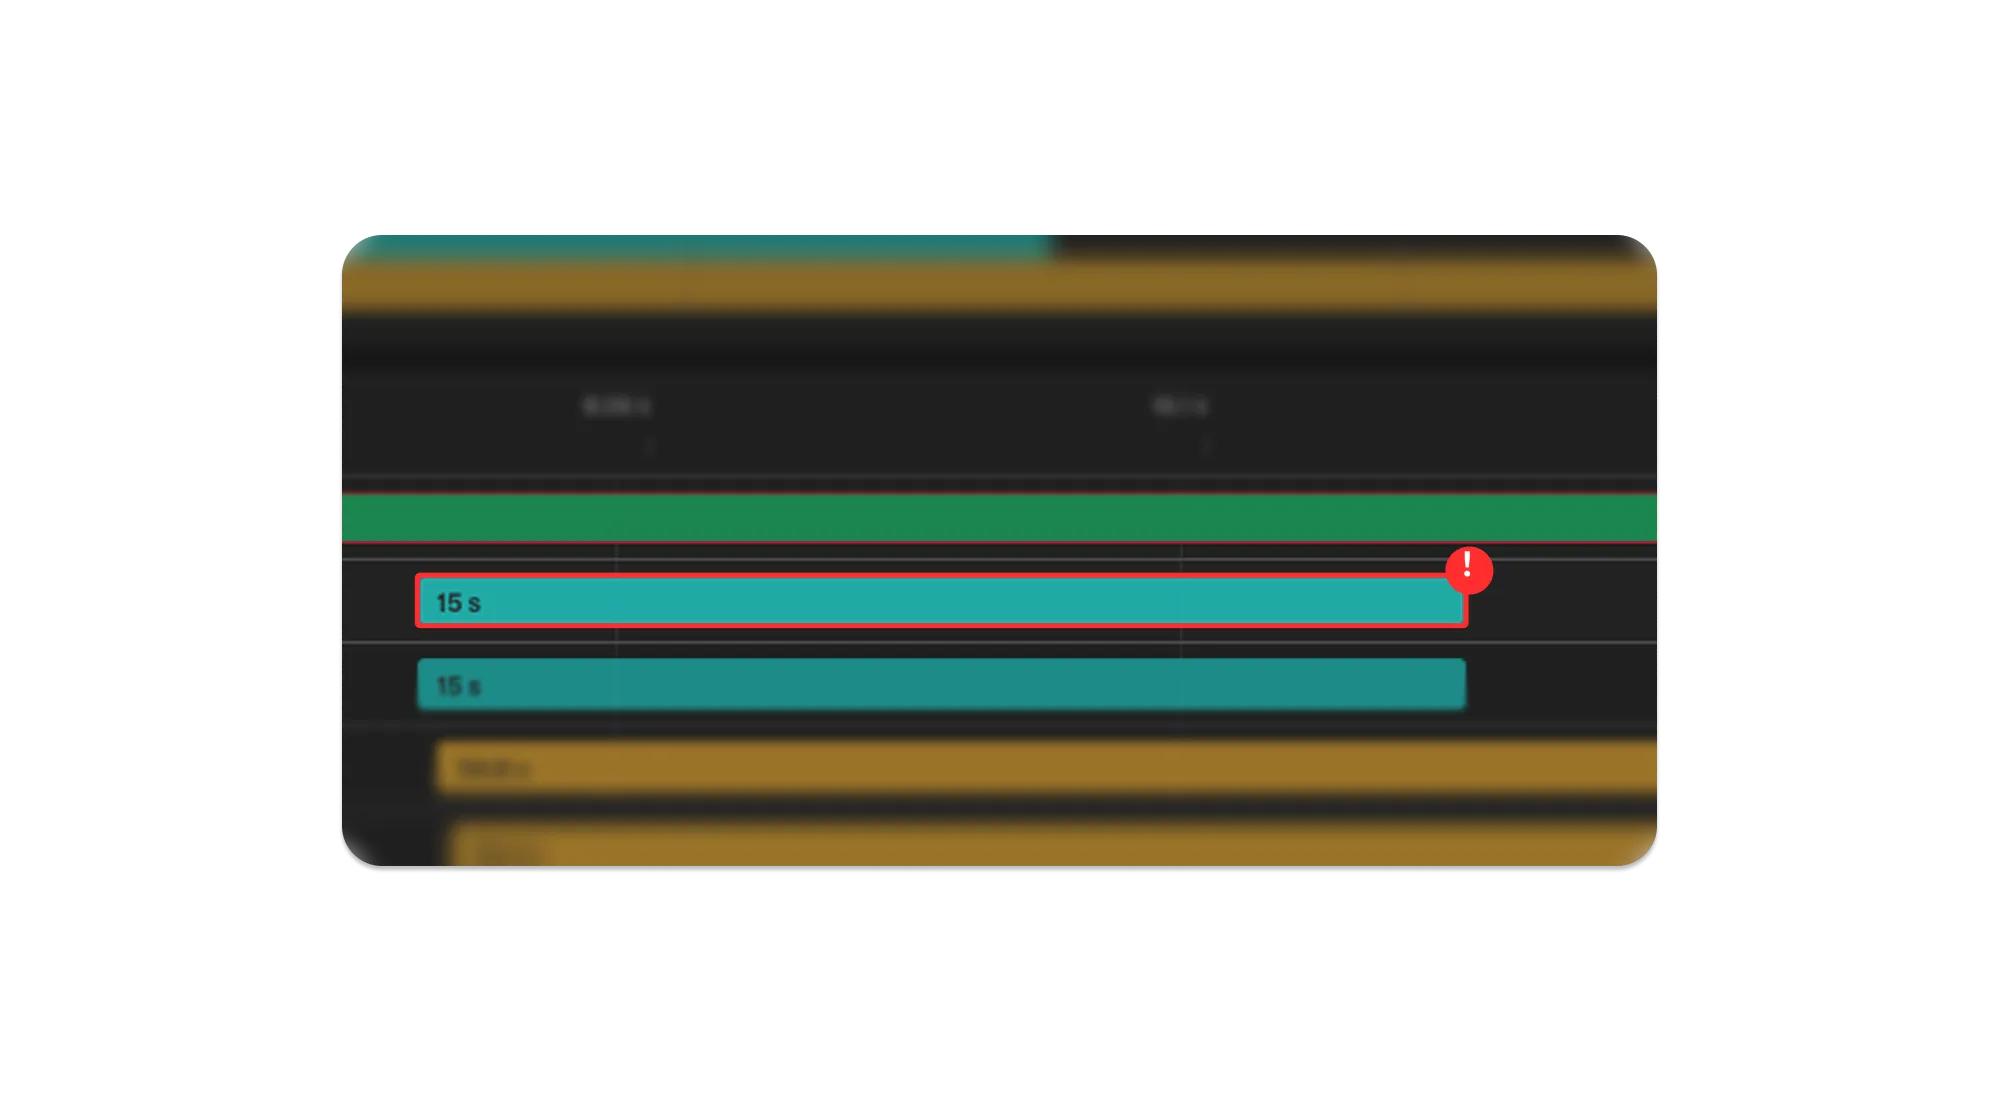
Error Pinpointing
Errored spans are highlighted and surfaced in the waterfall so you can spot problems at a glance.
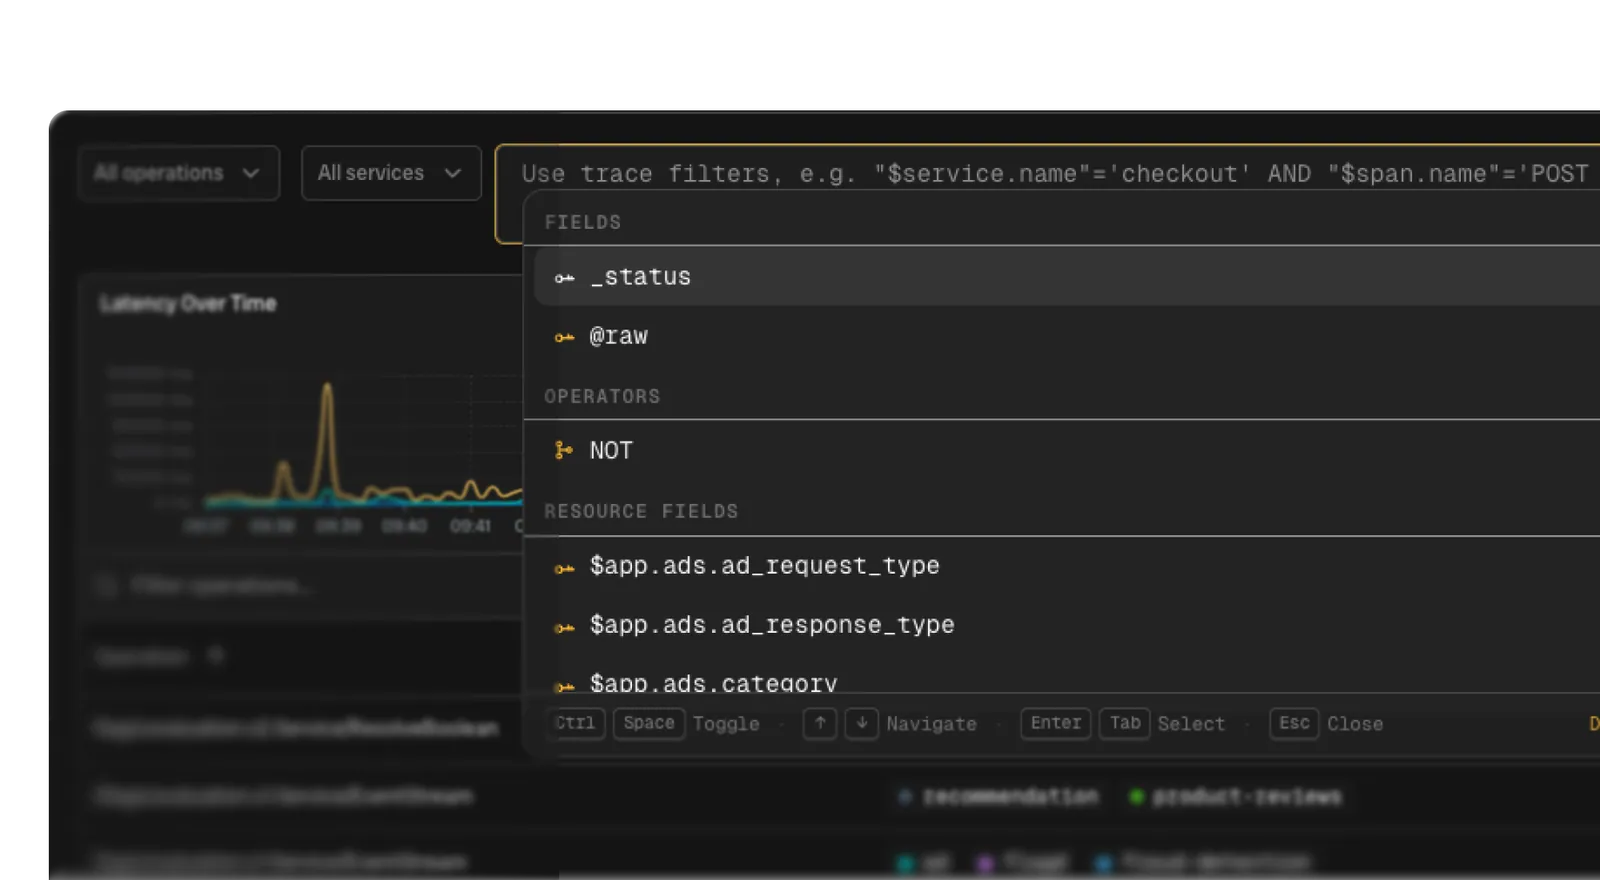
Filter Traces with SQL
Query and filter your traces with the same familiar SQL you use for logs in Bronto.
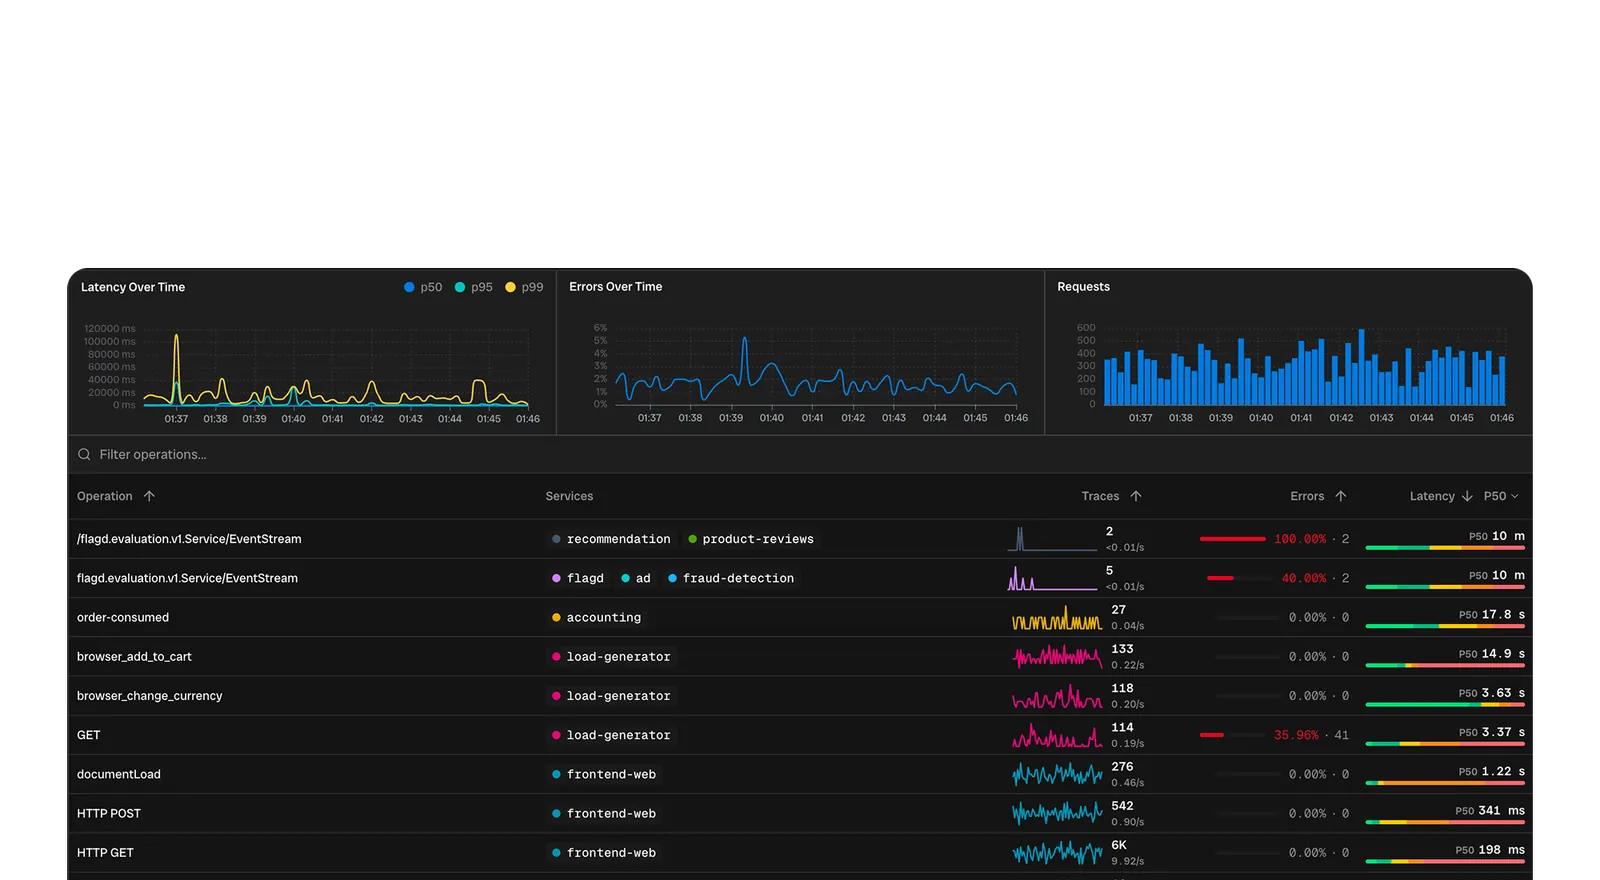
Sort & Filter by Errors or Latency
Rank every operation across services by error rate or p50/p95 latency to find the worst offenders instantly.
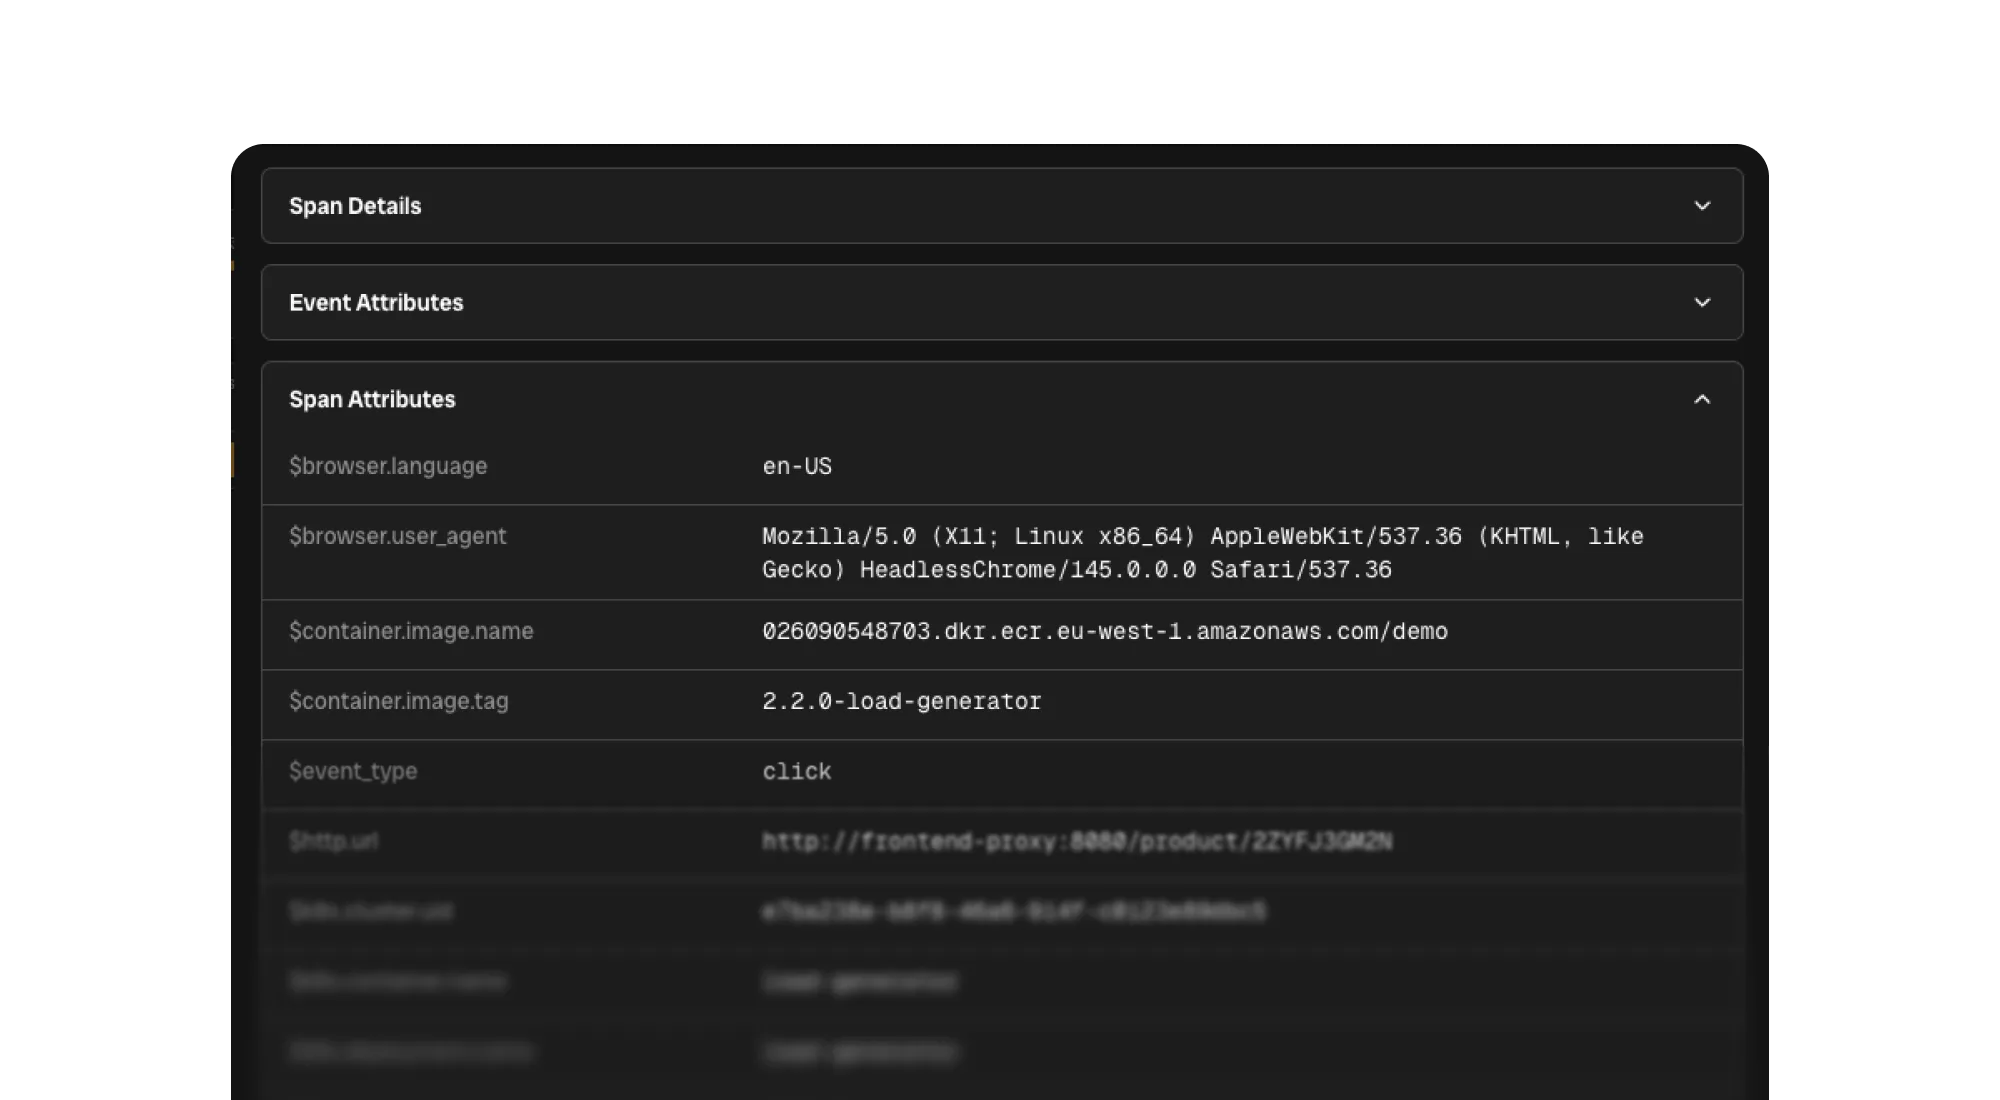
Every Span, Rich with Detail
Inspect span details, event attributes, and full span attributes for any request, then jump straight into the correlated logs.

High-Cardinality Support
Store millions of unique tag combinations without performance loss.
12-Month Retention
Every metric kept hot and queryable for a full year.
Infrastructure Metrics
CPU, memory, disk, network — collected and correlated automatically.
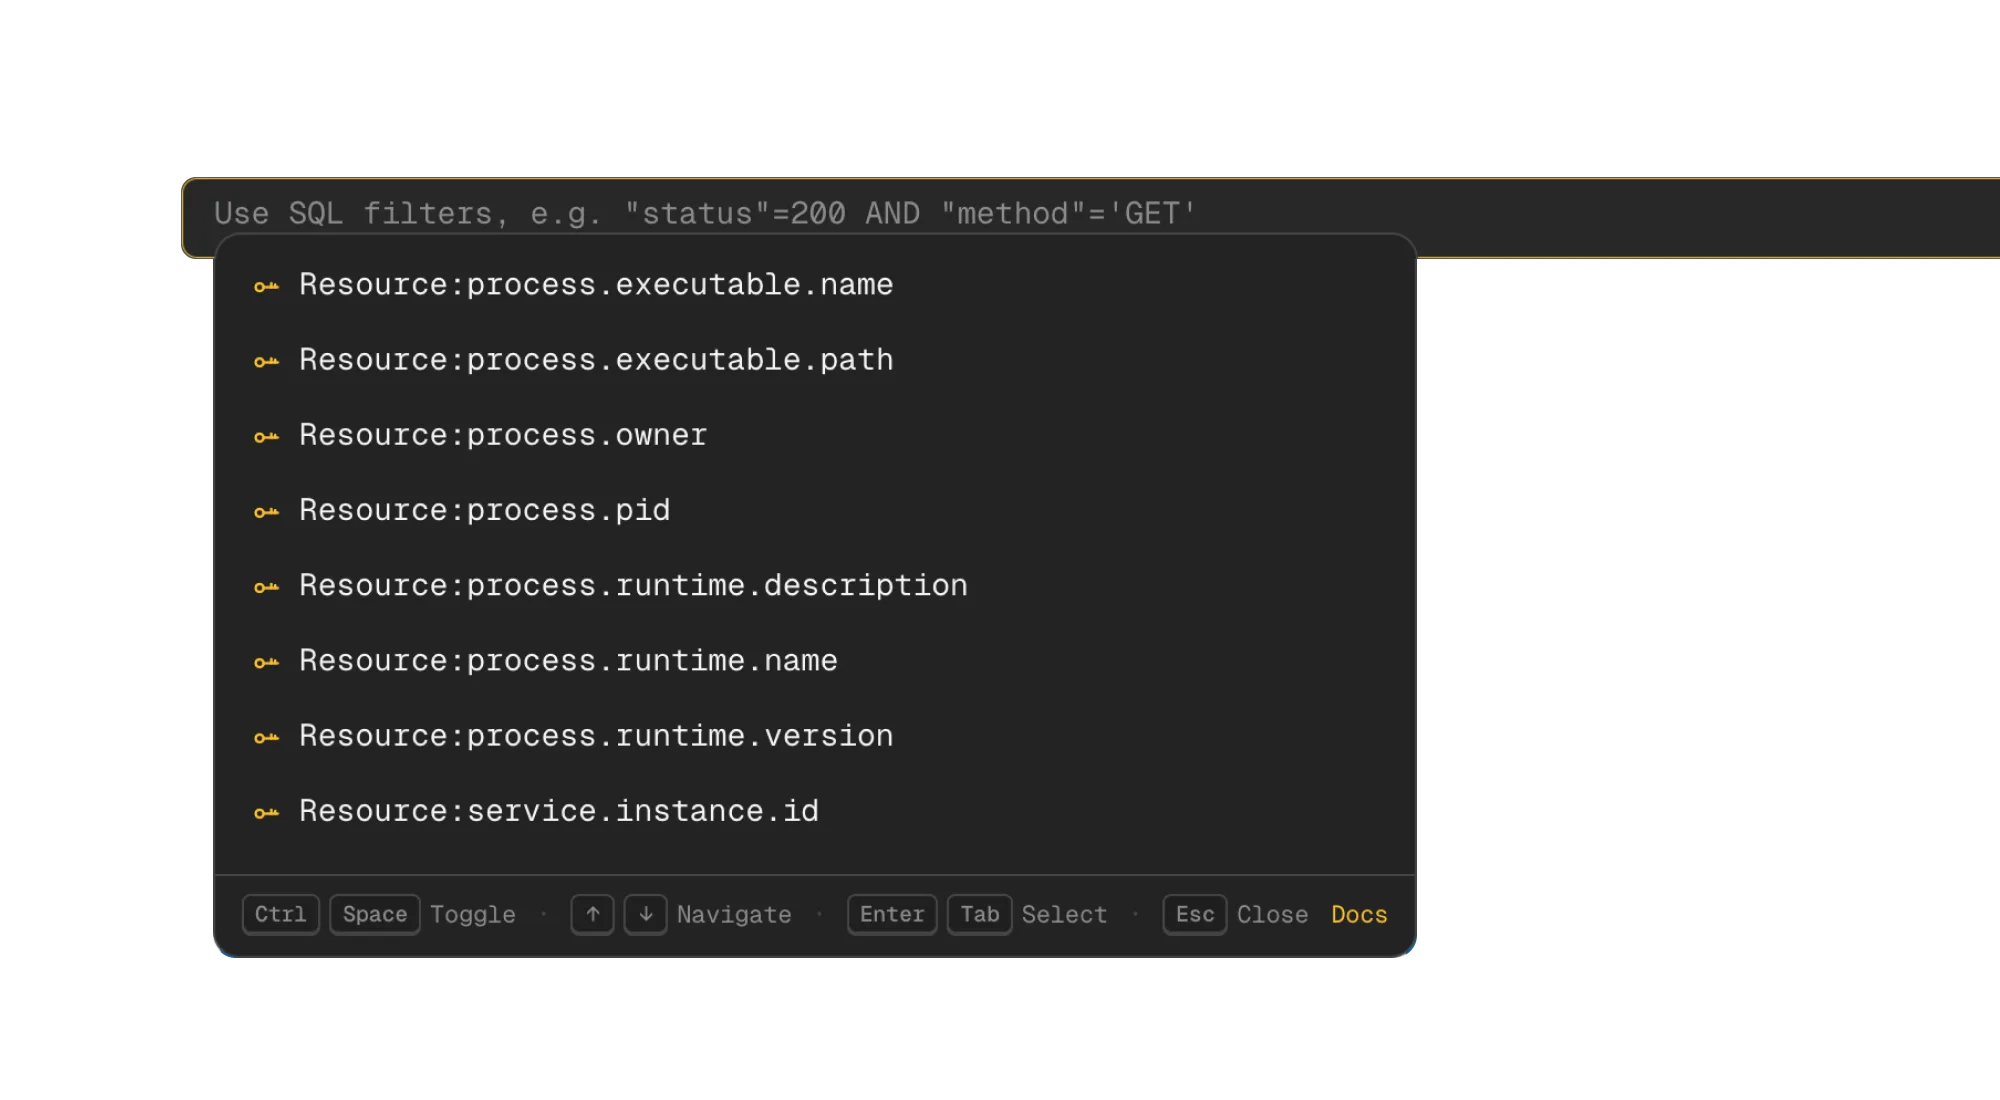
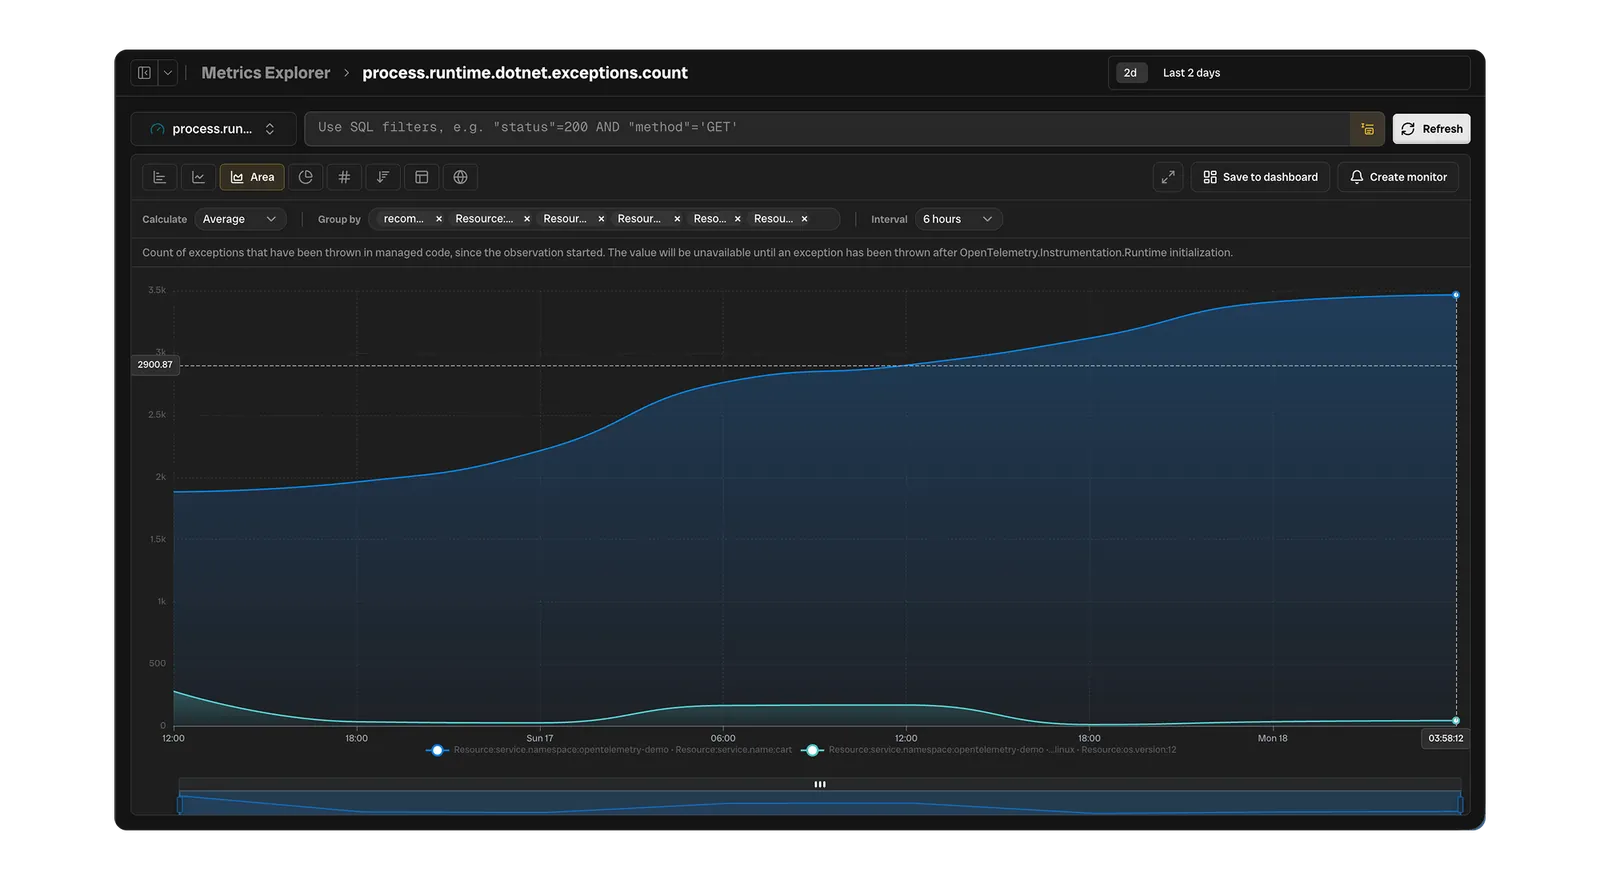
Filter Metrics with SQL
Across the entire platform — including metrics — use familiar SQL to slice and filter your data with autocomplete on every tag.

Save to Dashboard or Alert
Turn any metric into a dashboard widget or promote it straight into a monitor — one click, no rebuilding the query.
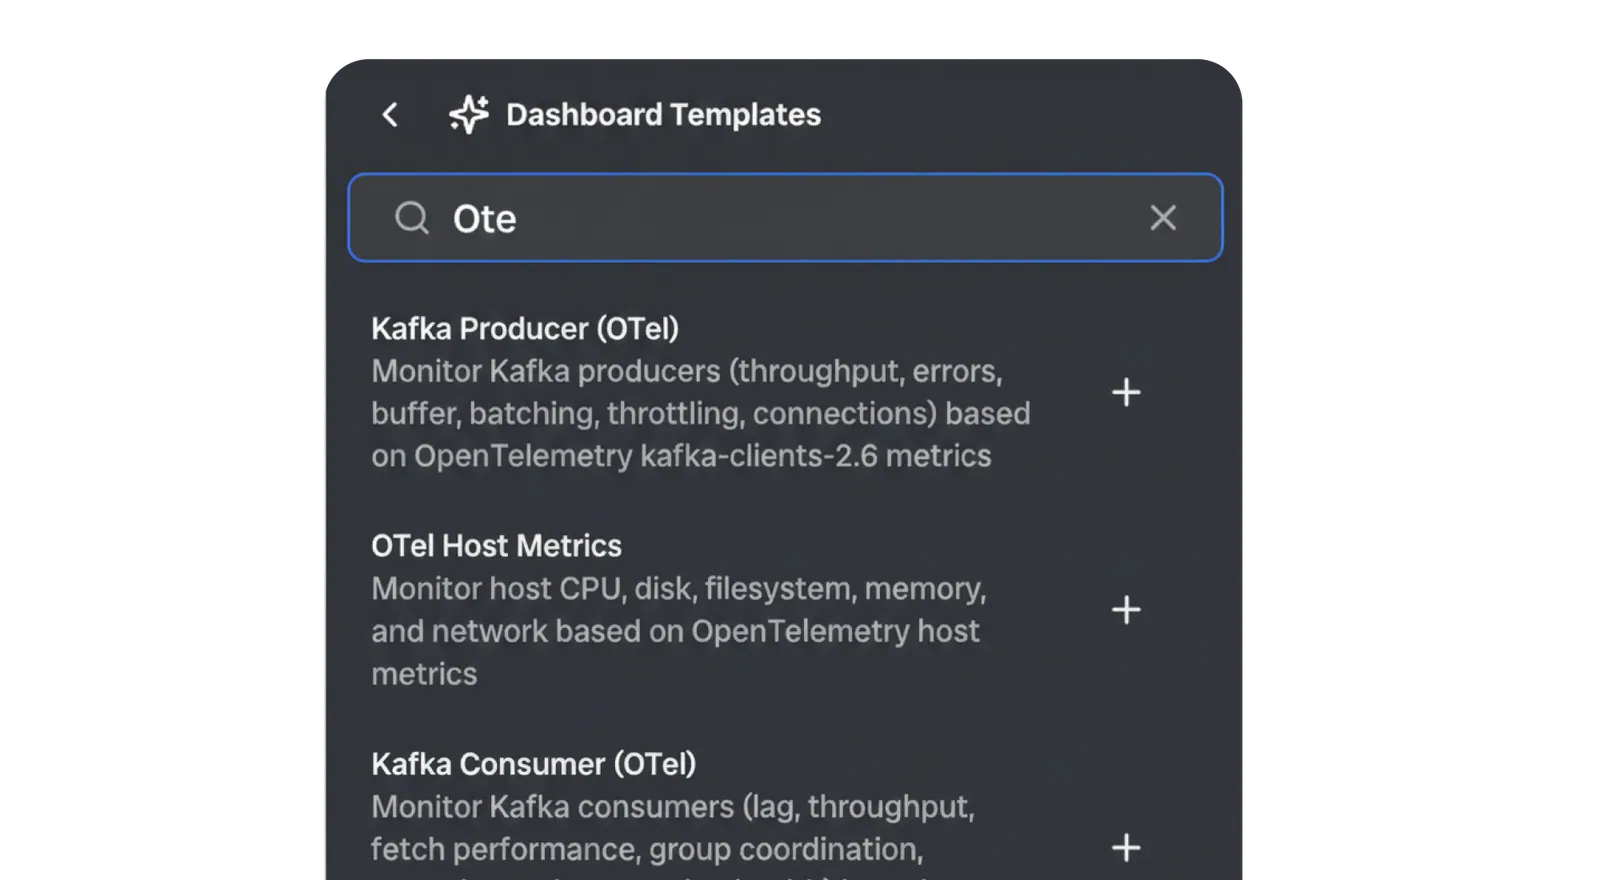
Dashboard Templates
Bronto recognises known formats — Kafka, OTel host metrics, and more — and builds a ready-to-use dashboard from your metrics in seconds.

Log-Based Metrics
Visualise petabytes of log data instantly — turn any query into a live chart with no pre-aggregation required.
SQL Filtering at Scale
Slice and filter every widget on a dashboard with blazing-fast SQL, even across massive datasets.
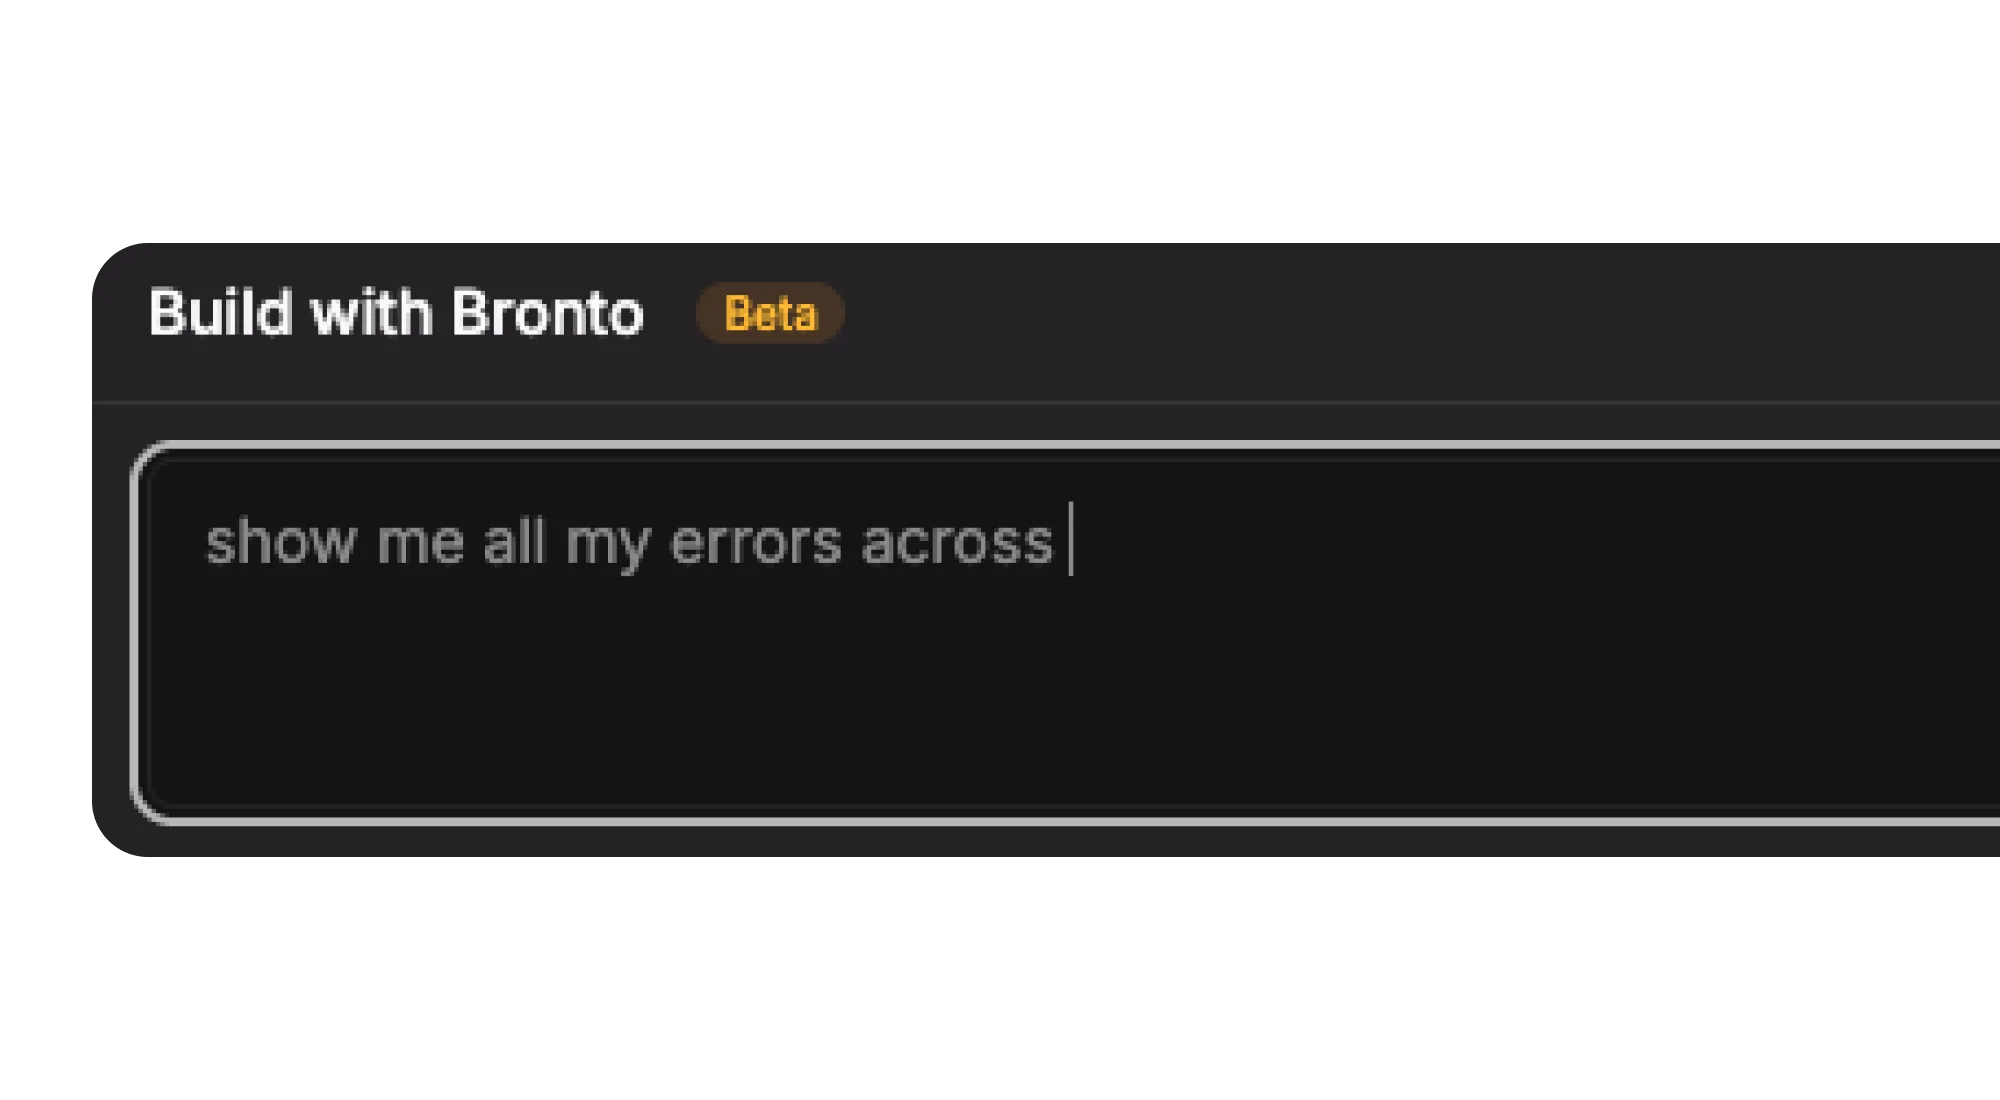
Build Widgets with Natural Language
Just describe what you want to see and Bronto figures out the rest — no query language required.
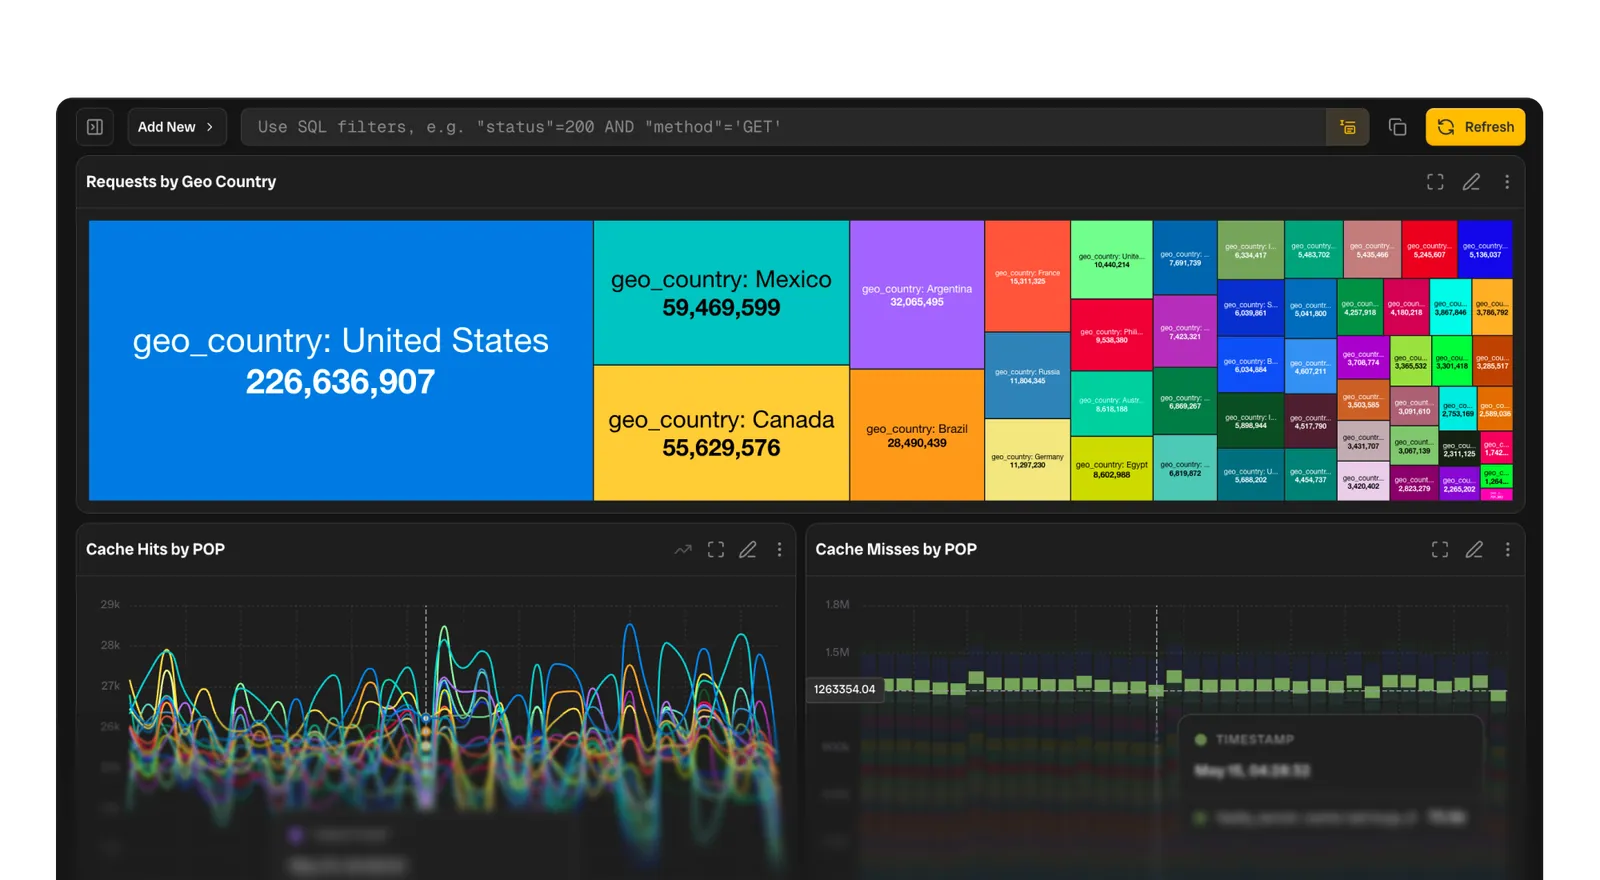
Petabyte-Scale Visuals
Charts render in seconds, even over massive data volumes.
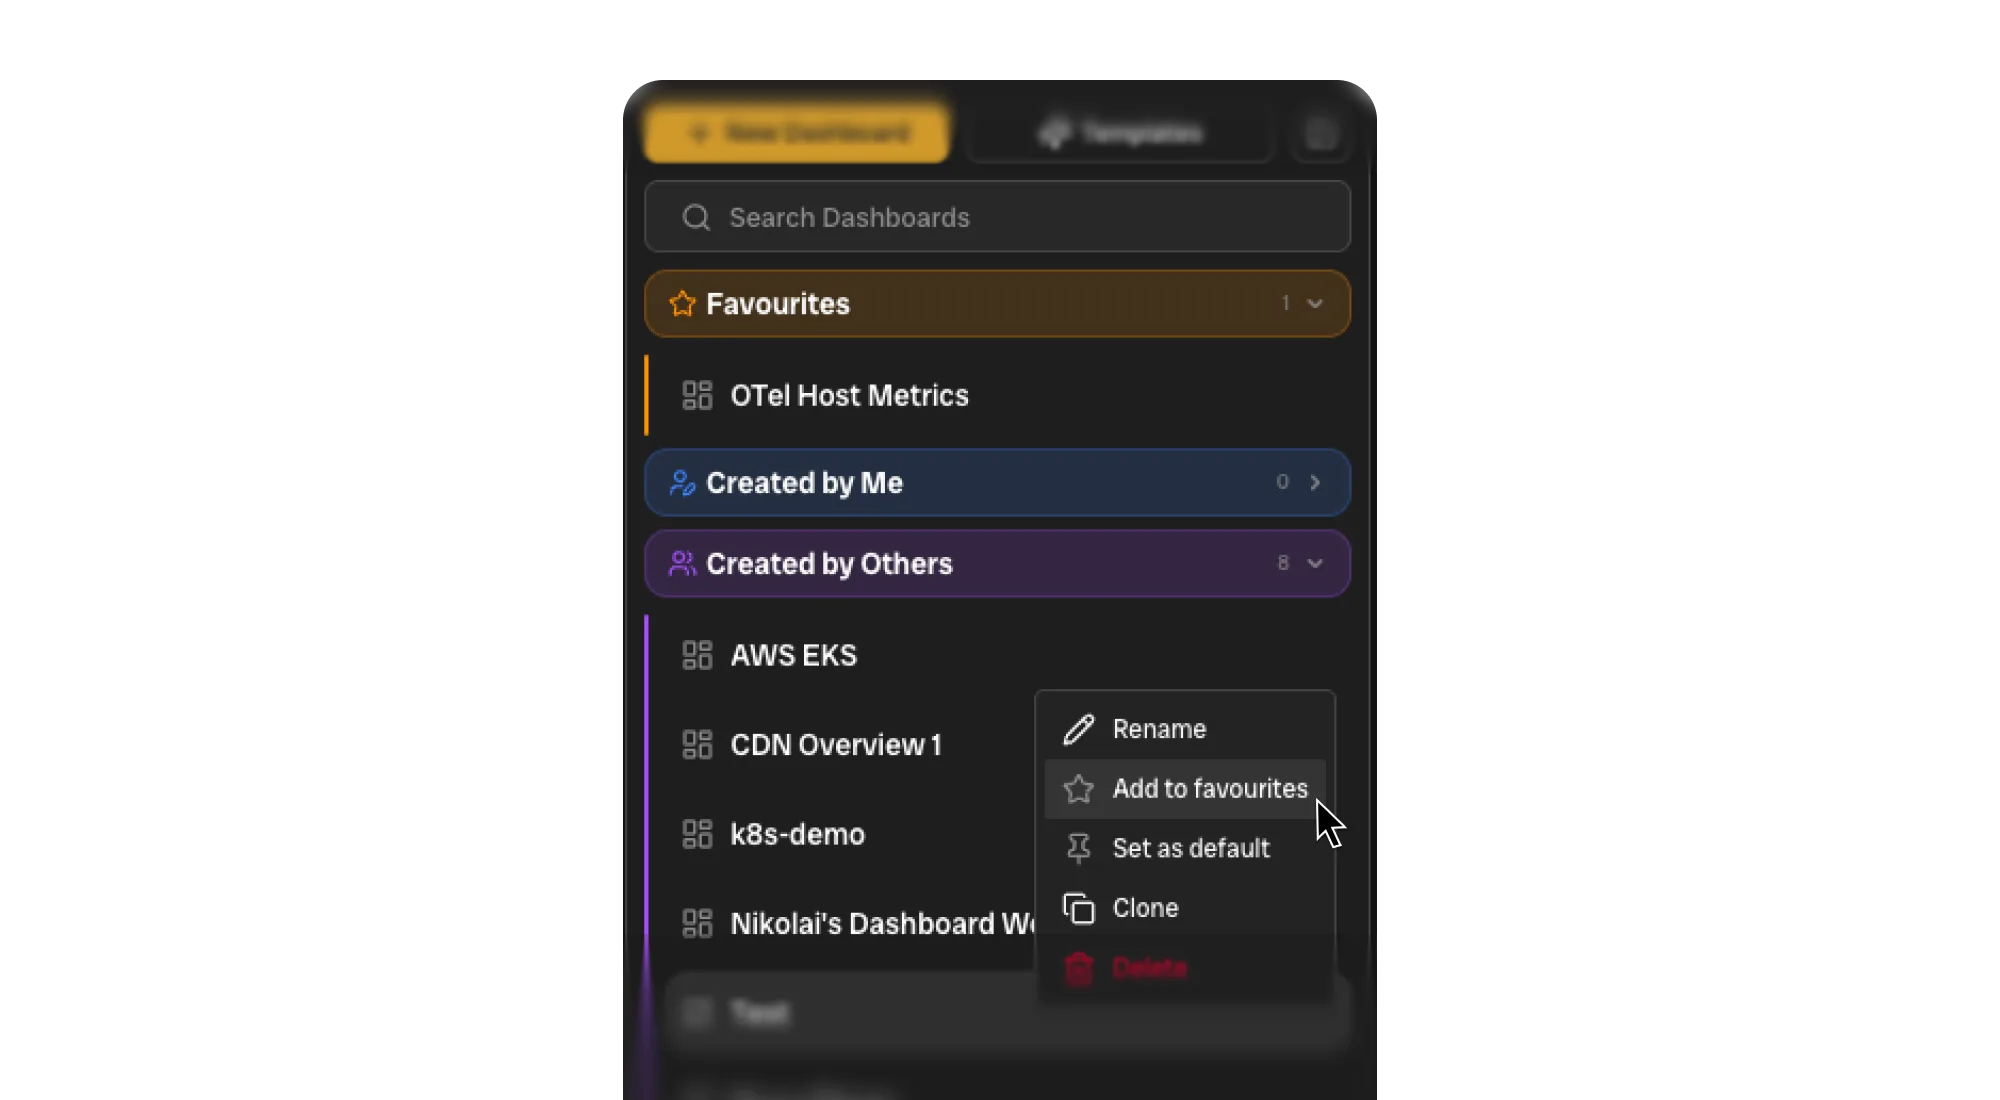
Shared & Private Views
Collaborate with your team or keep personal dashboards private.
Get the Full Picture
One-year retention by default — query long time ranges at a fraction of the cost.

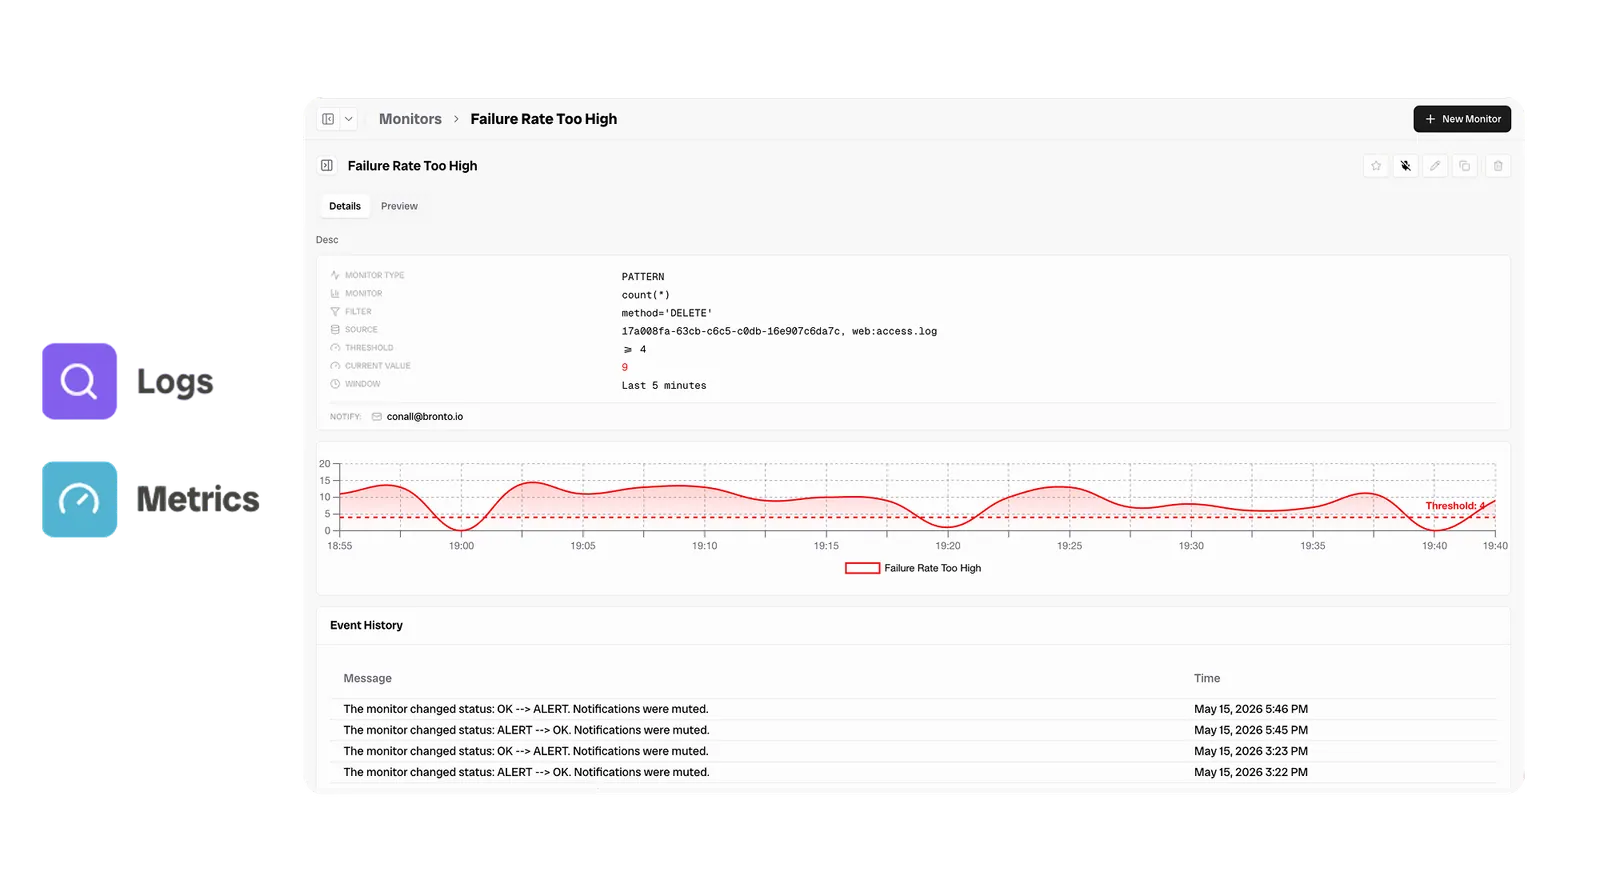
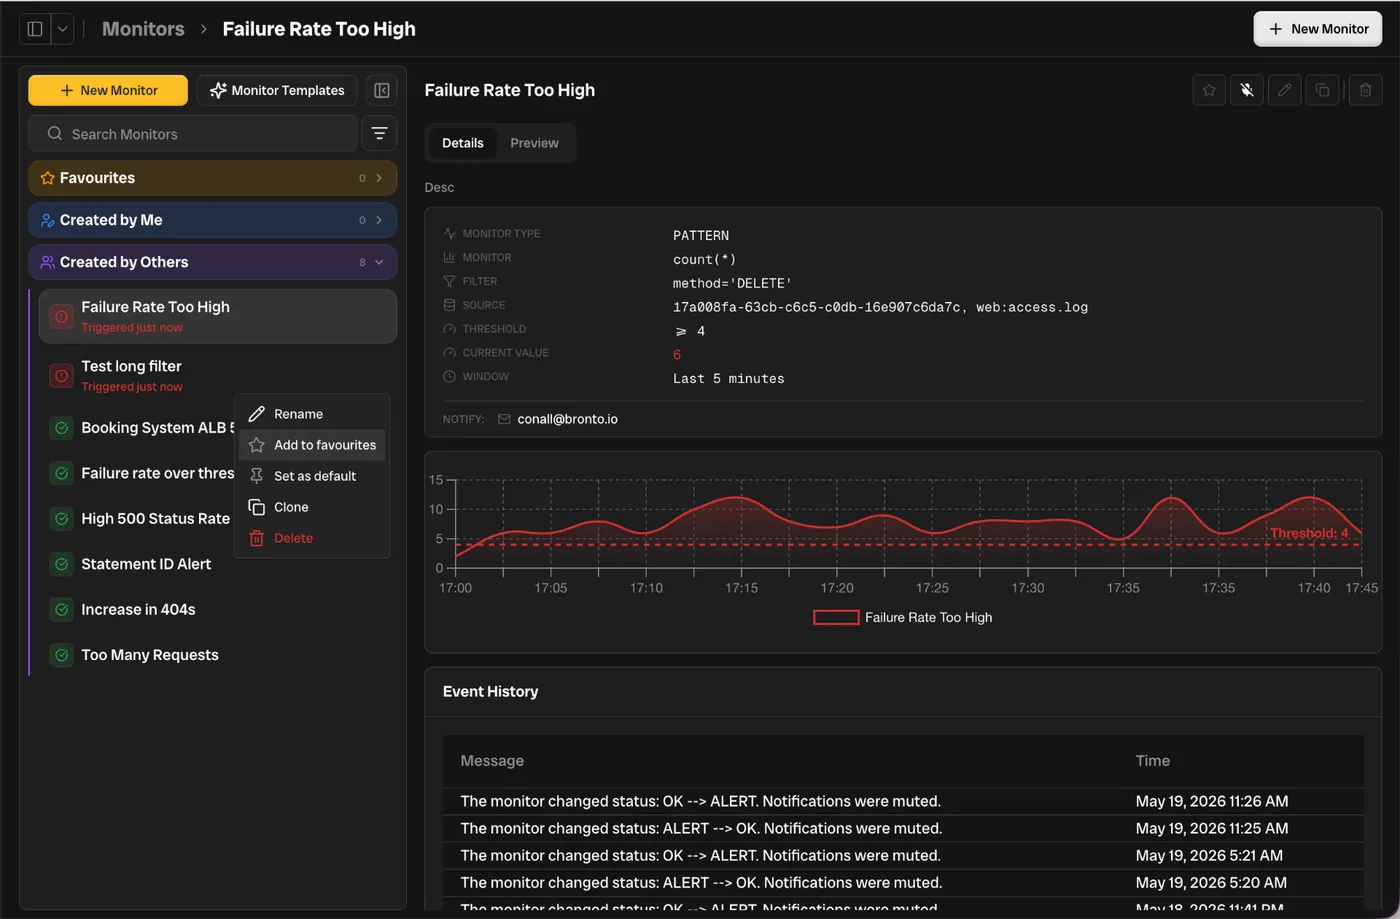
Metric & Log Alerts
Alert on any metric threshold or log pattern match.
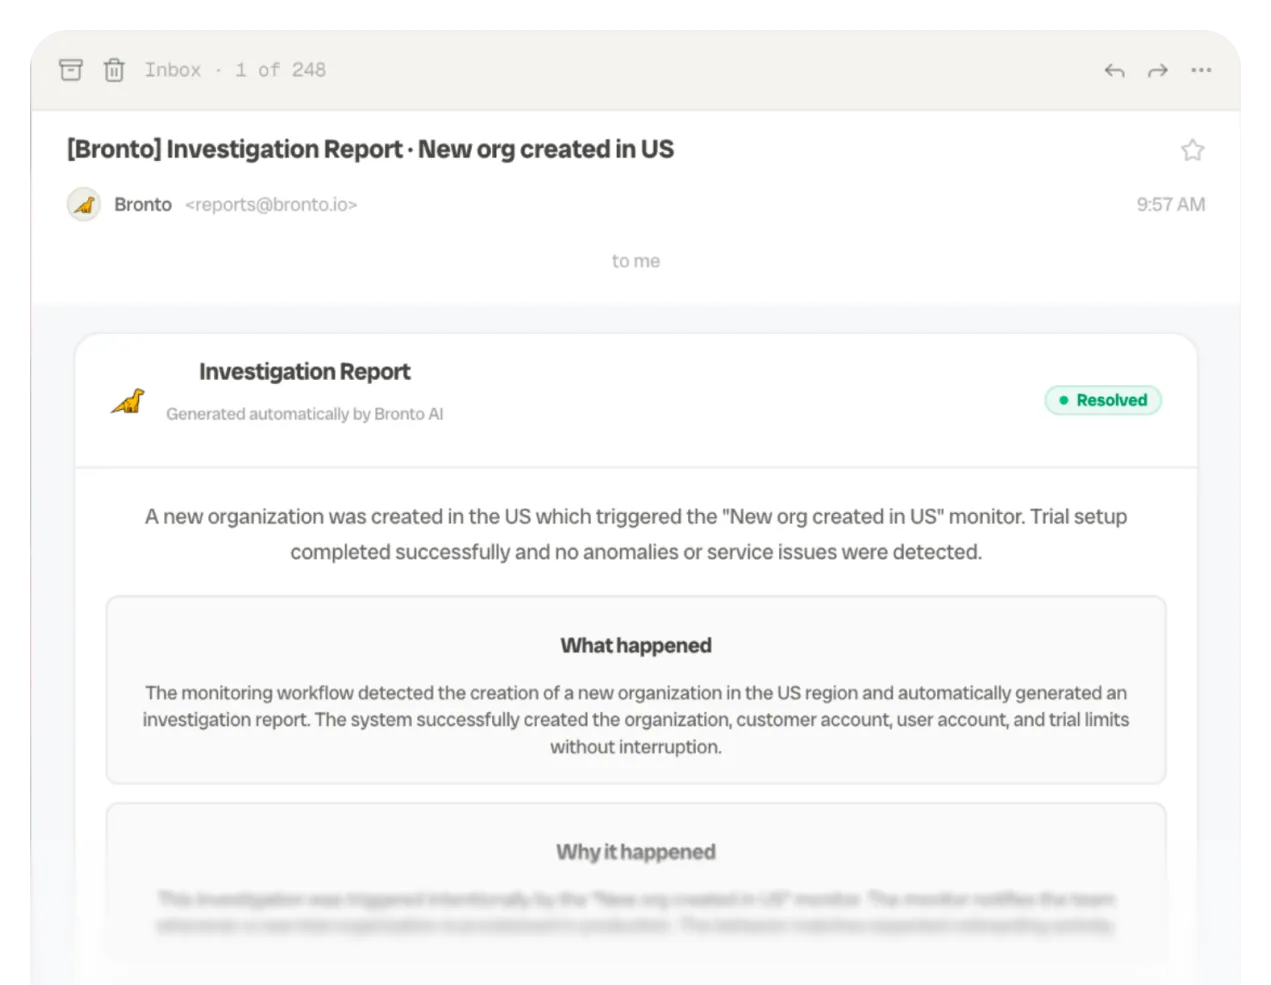
AI Investigation Reports
When triggered, AI generates root cause analysis automatically.
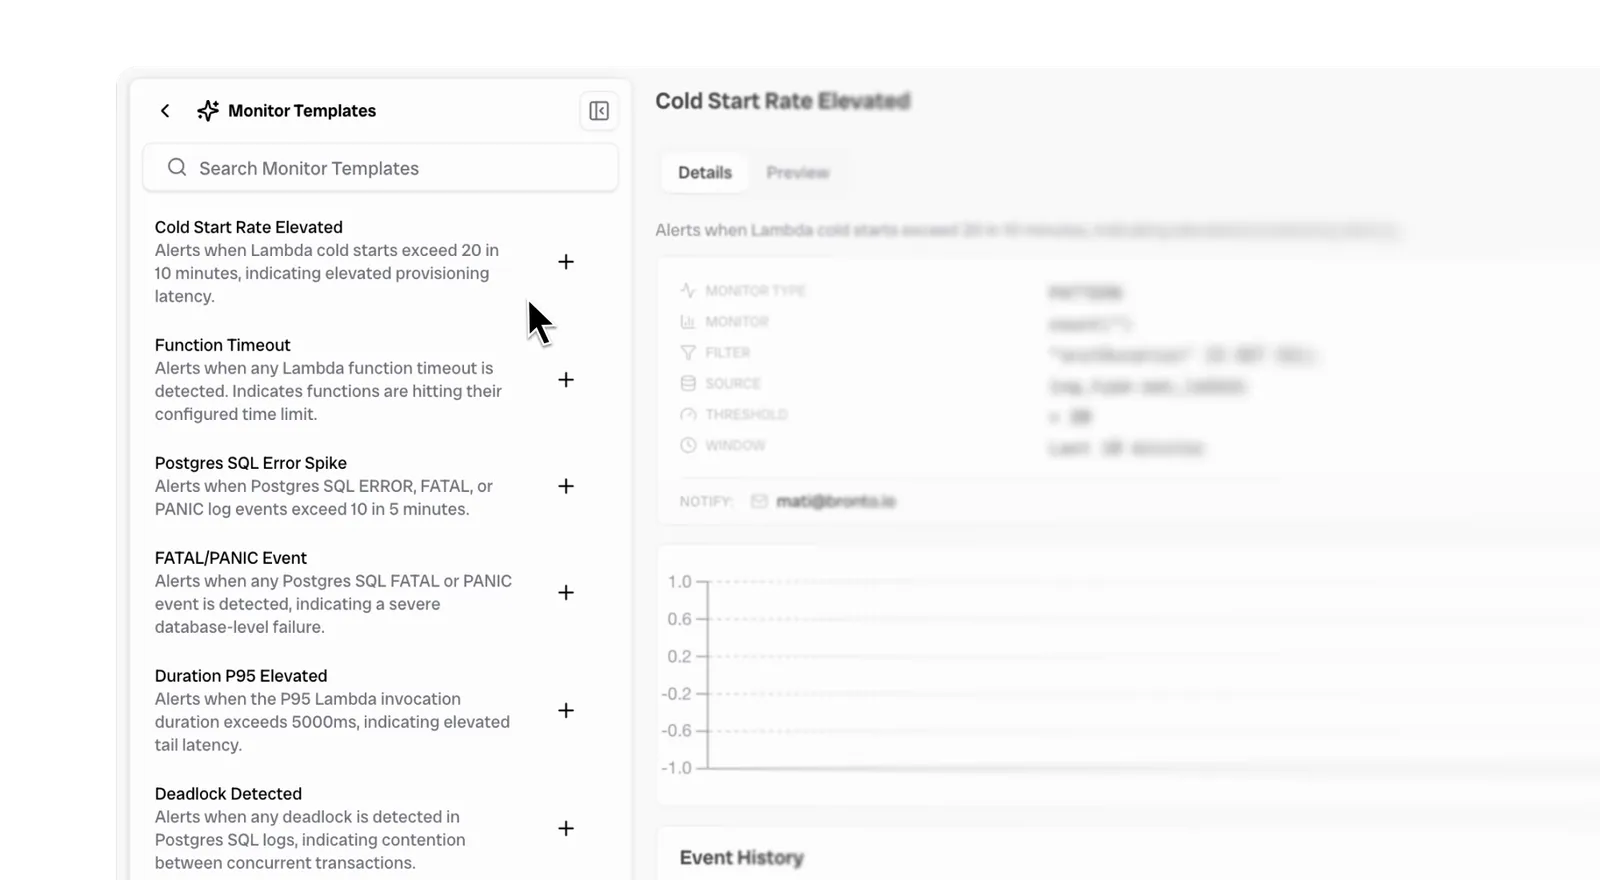
Templates Based on Your Data
Bronto detects the data formats you're sending and recommends ready-to-add monitor templates tailored to what you actually have.
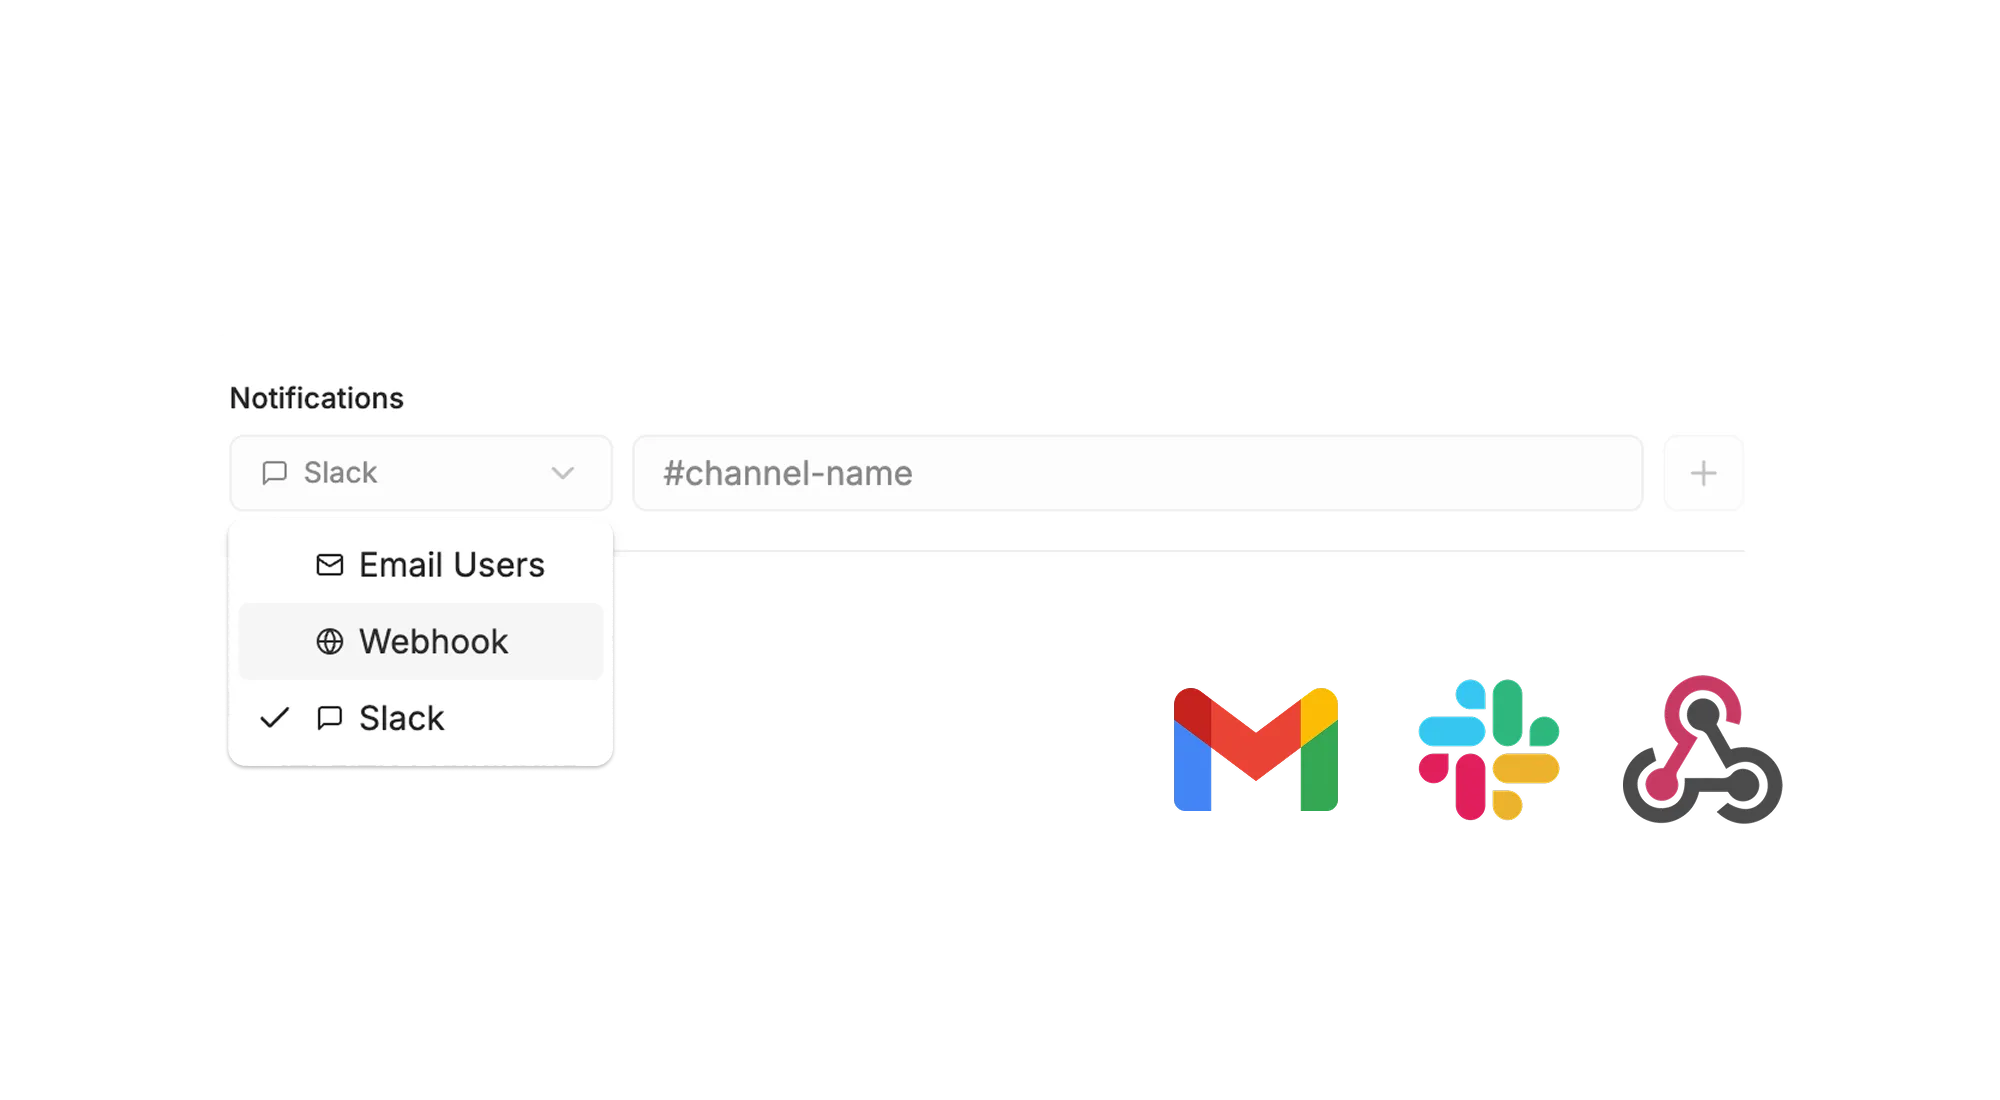
Multi-Channel Delivery
Route alerts to Slack, email, or webhooks.
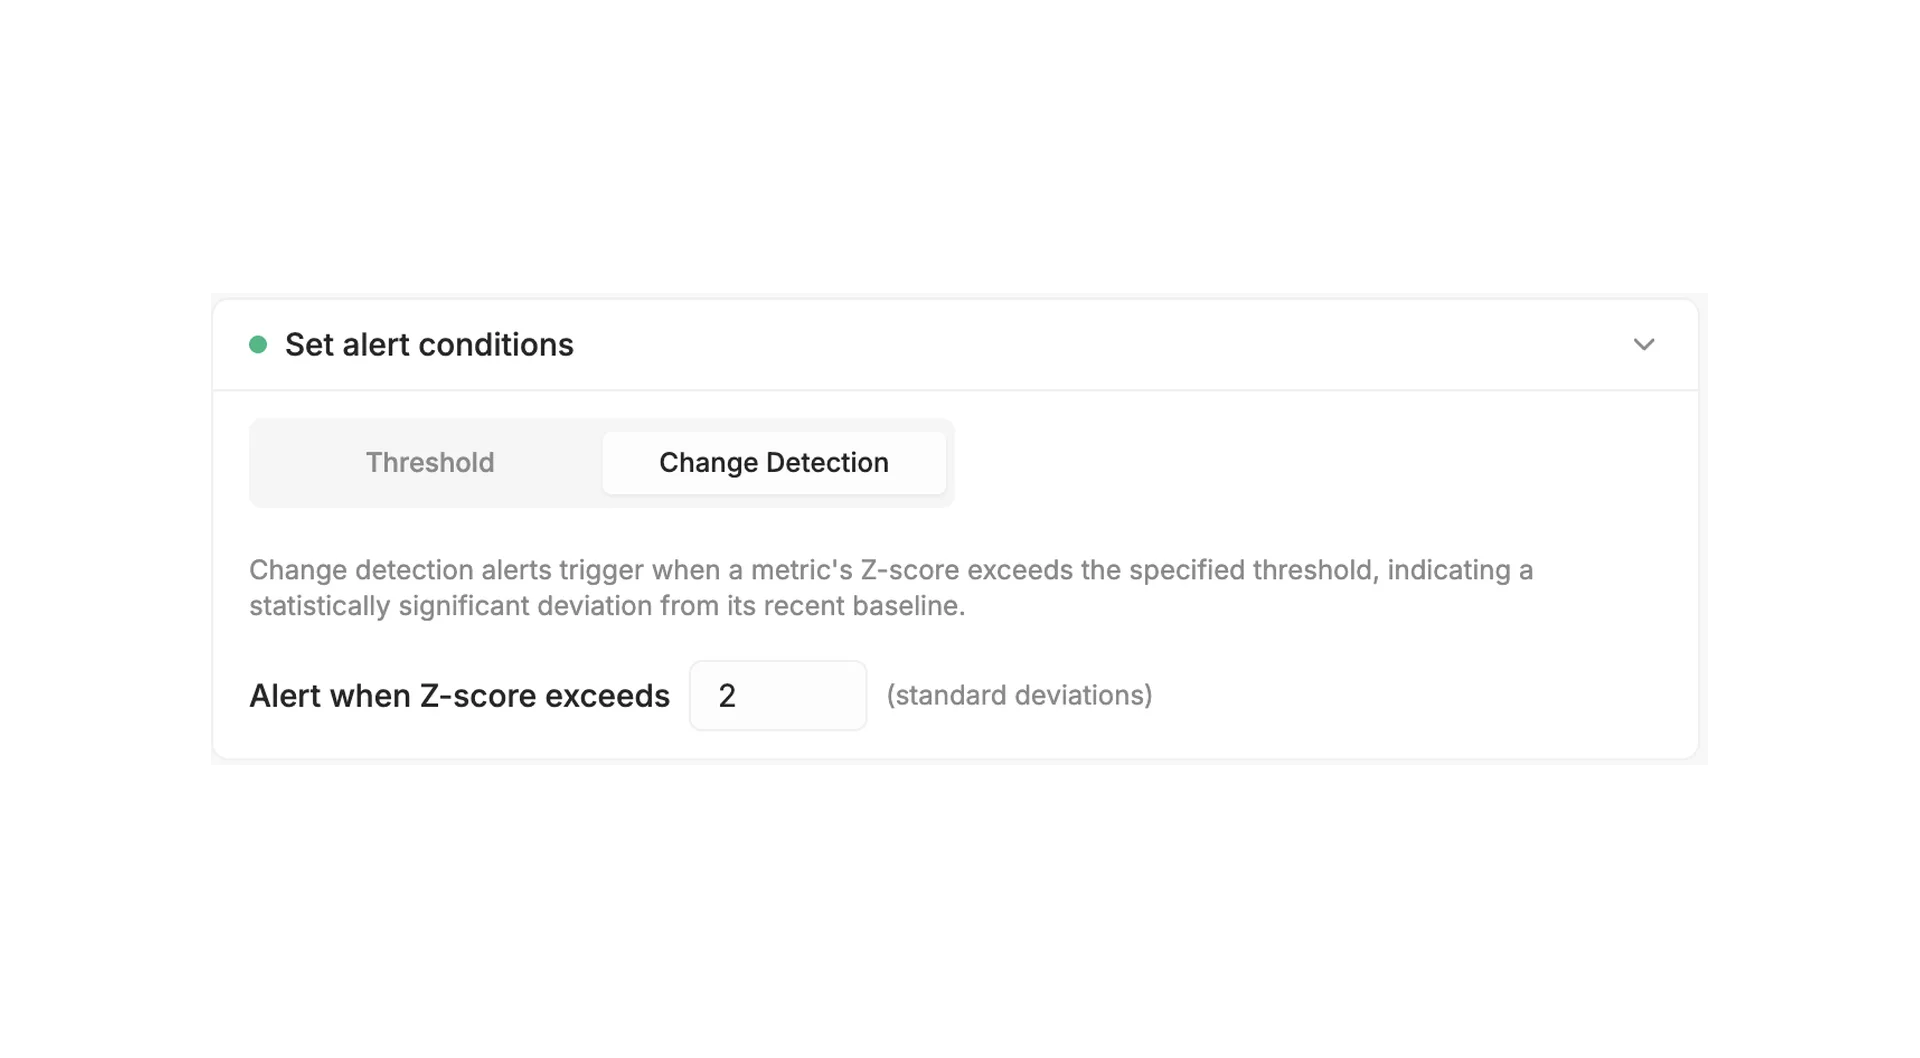
Thresholds & Change Detection
Alert on fixed thresholds or let Bronto flag statistically significant deviations from the baseline using Z-score change detection.
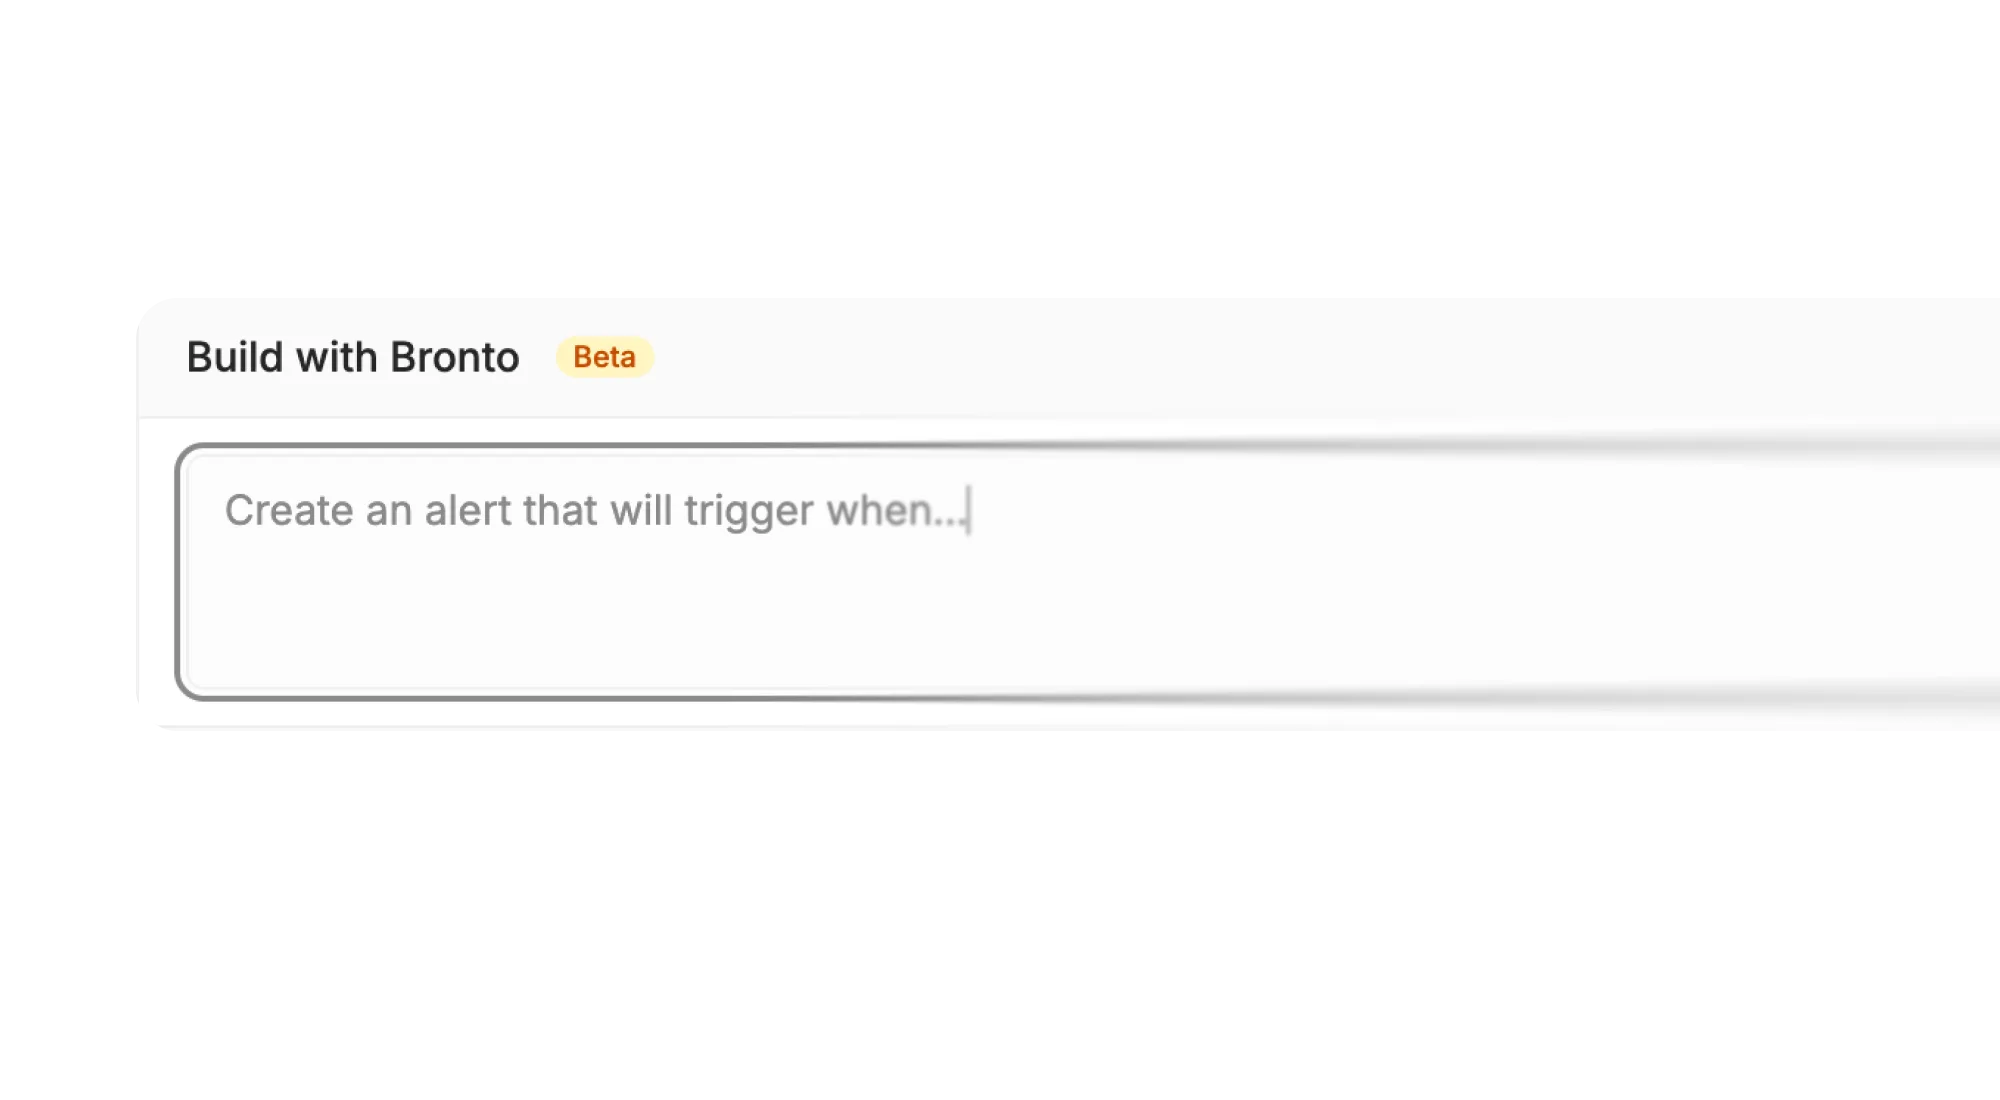
Build Monitors with a Prompt
Describe the alert you want in plain English and Bronto builds the monitor for you — no query syntax required.

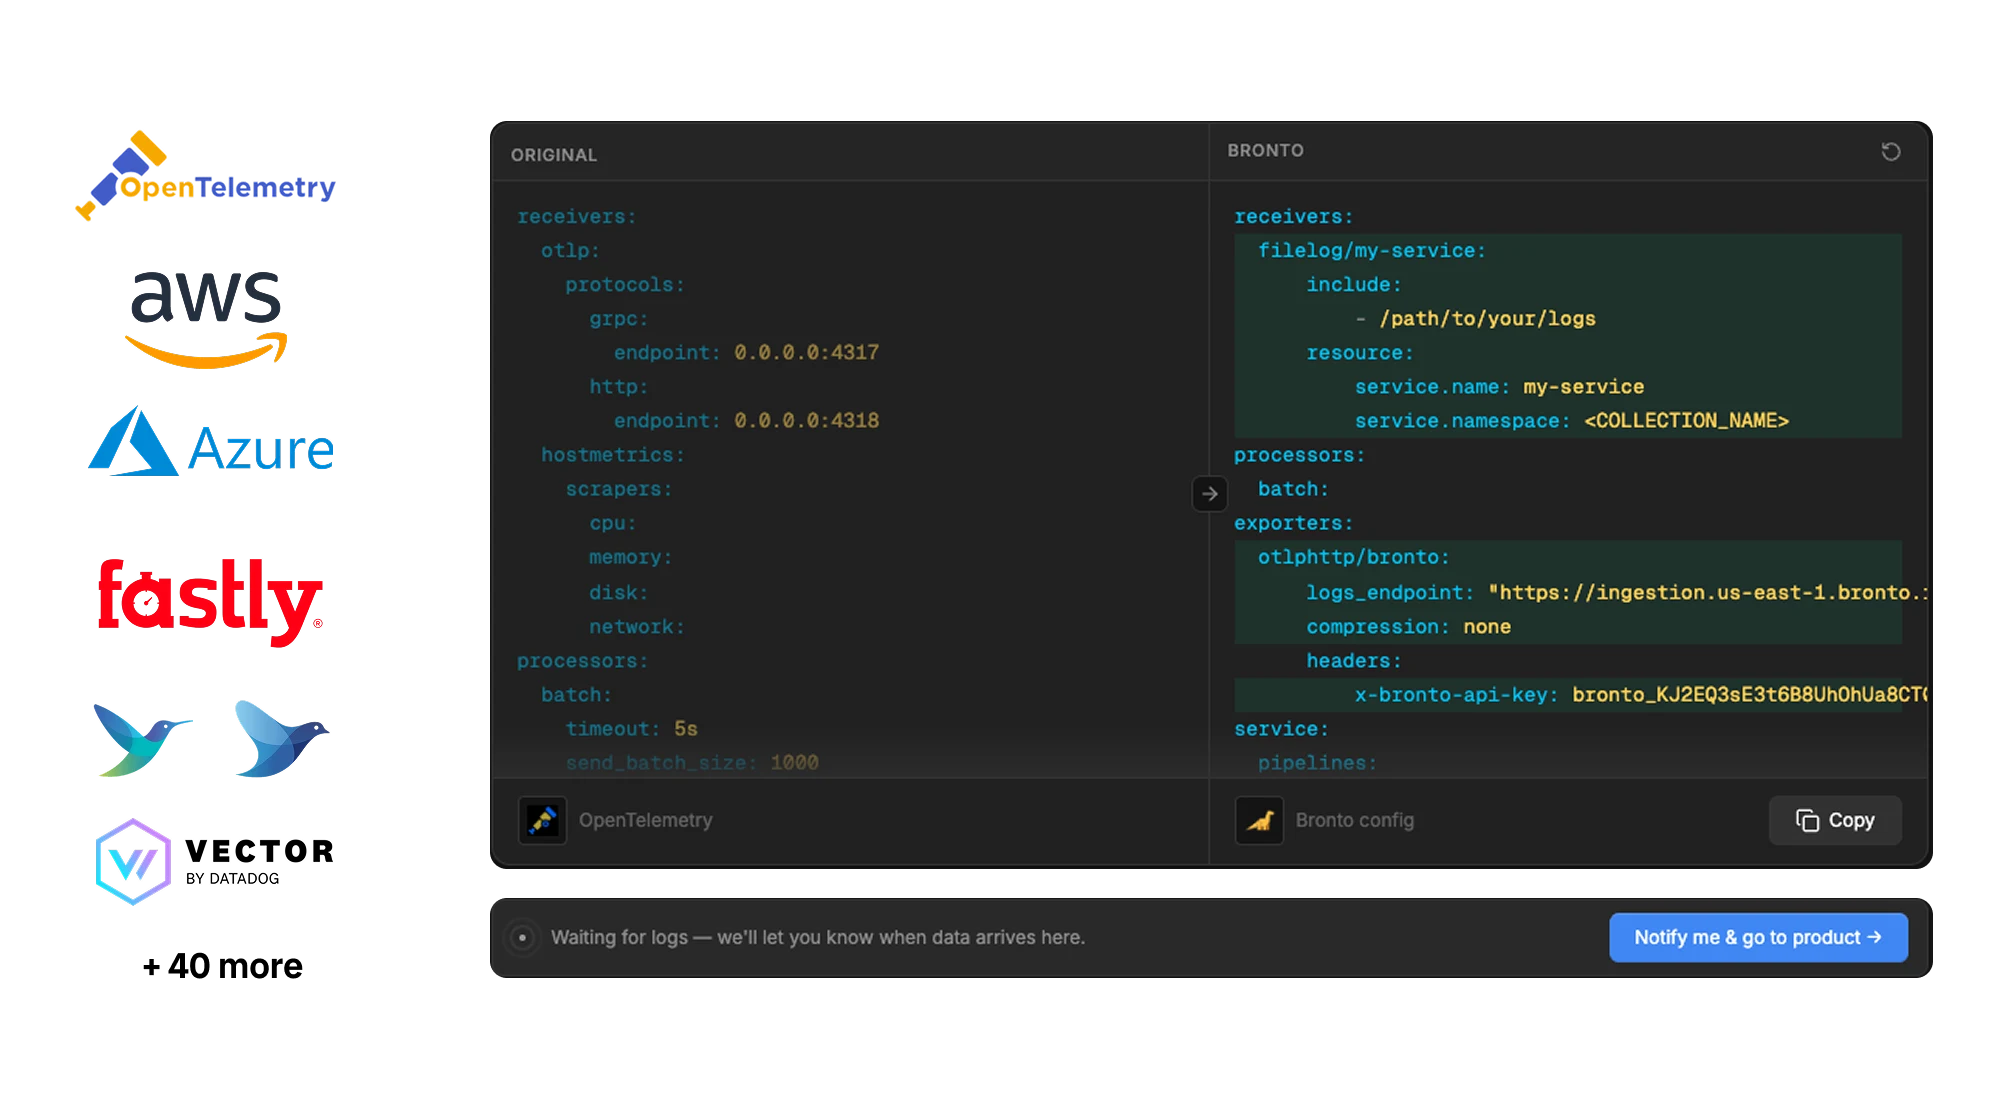
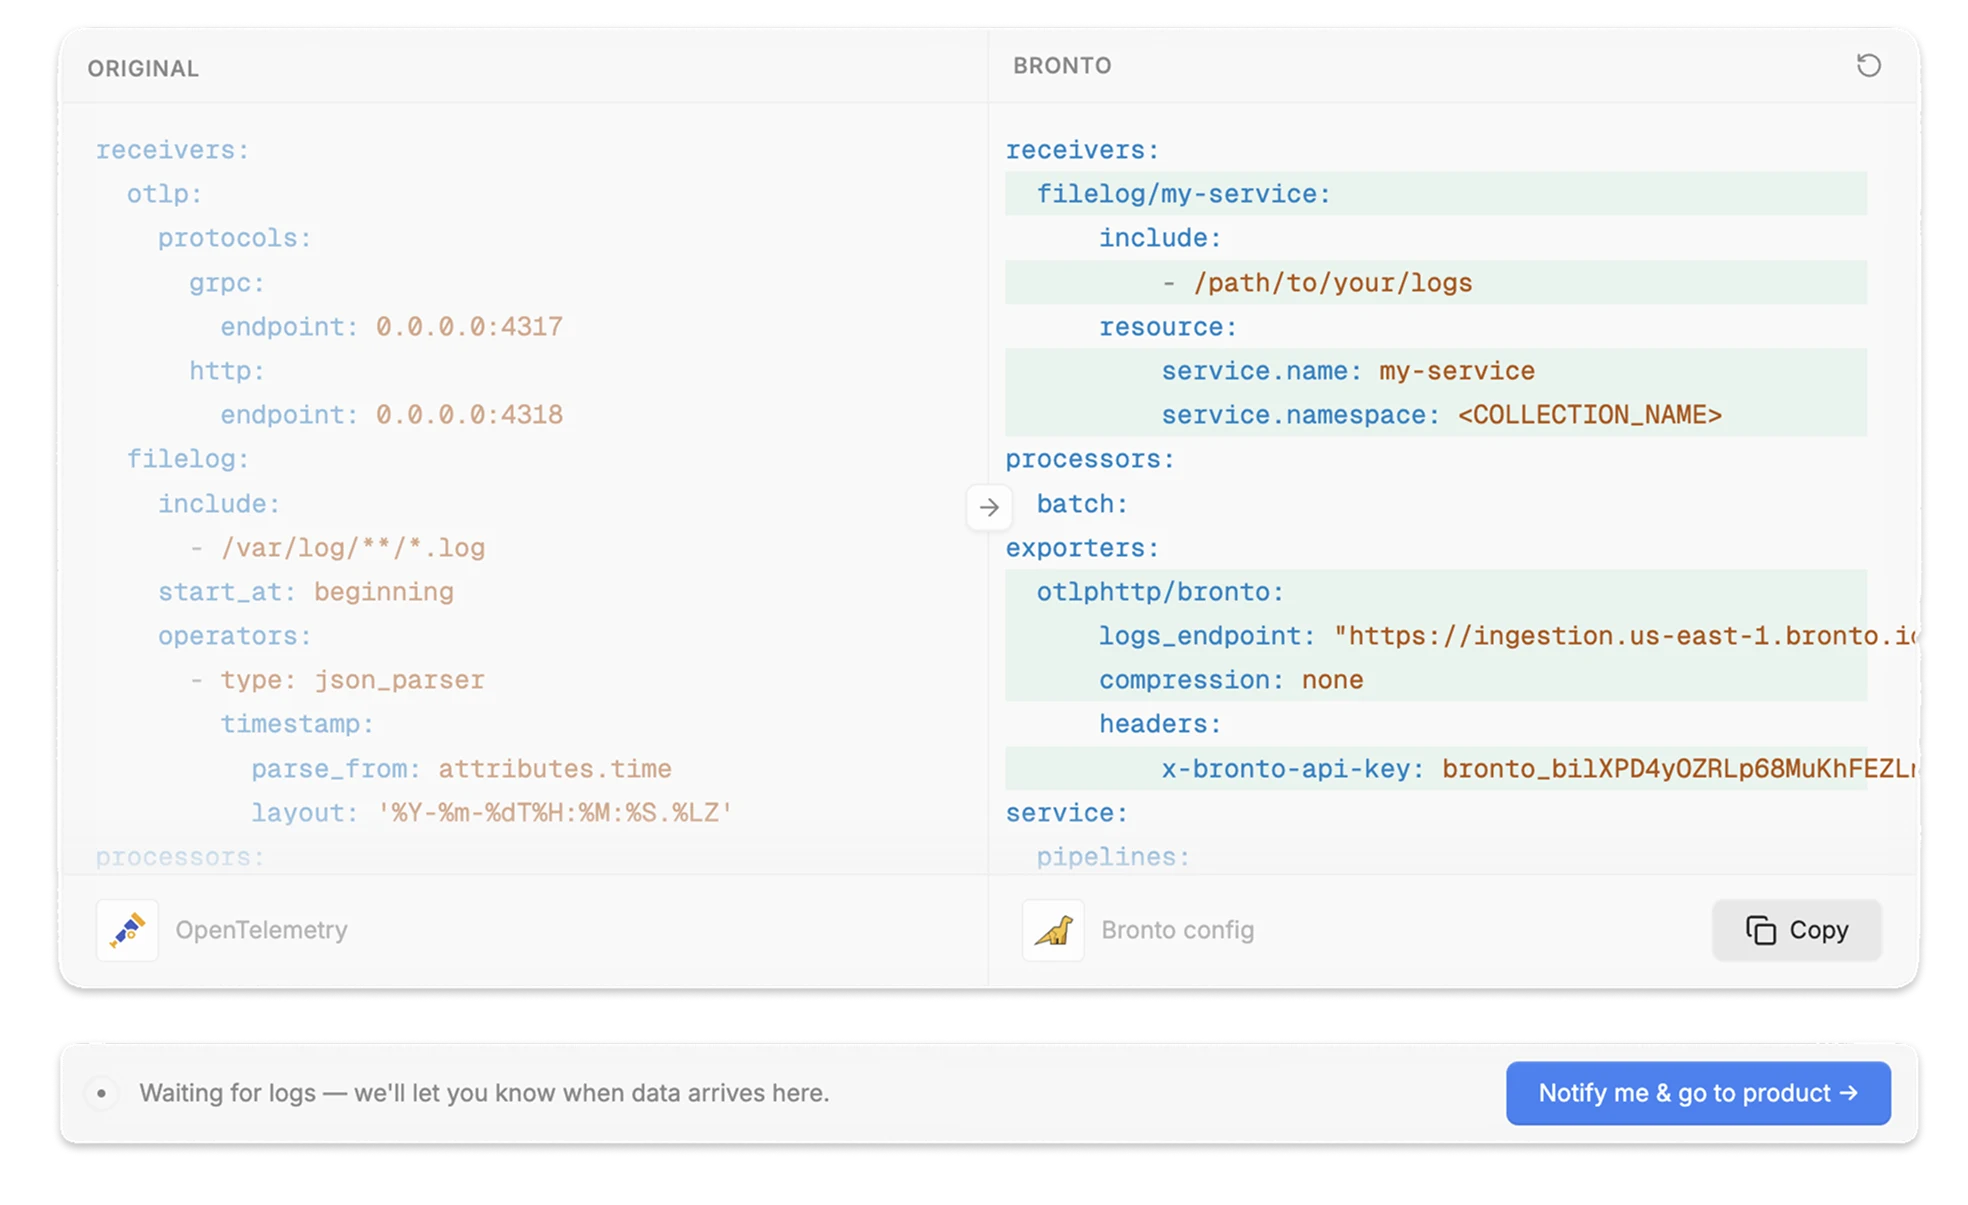
Universal Ingestion
OpenTelemetry native and more — all supported. Just paste your config in and Bronto will convert it. No vendor lock-in.
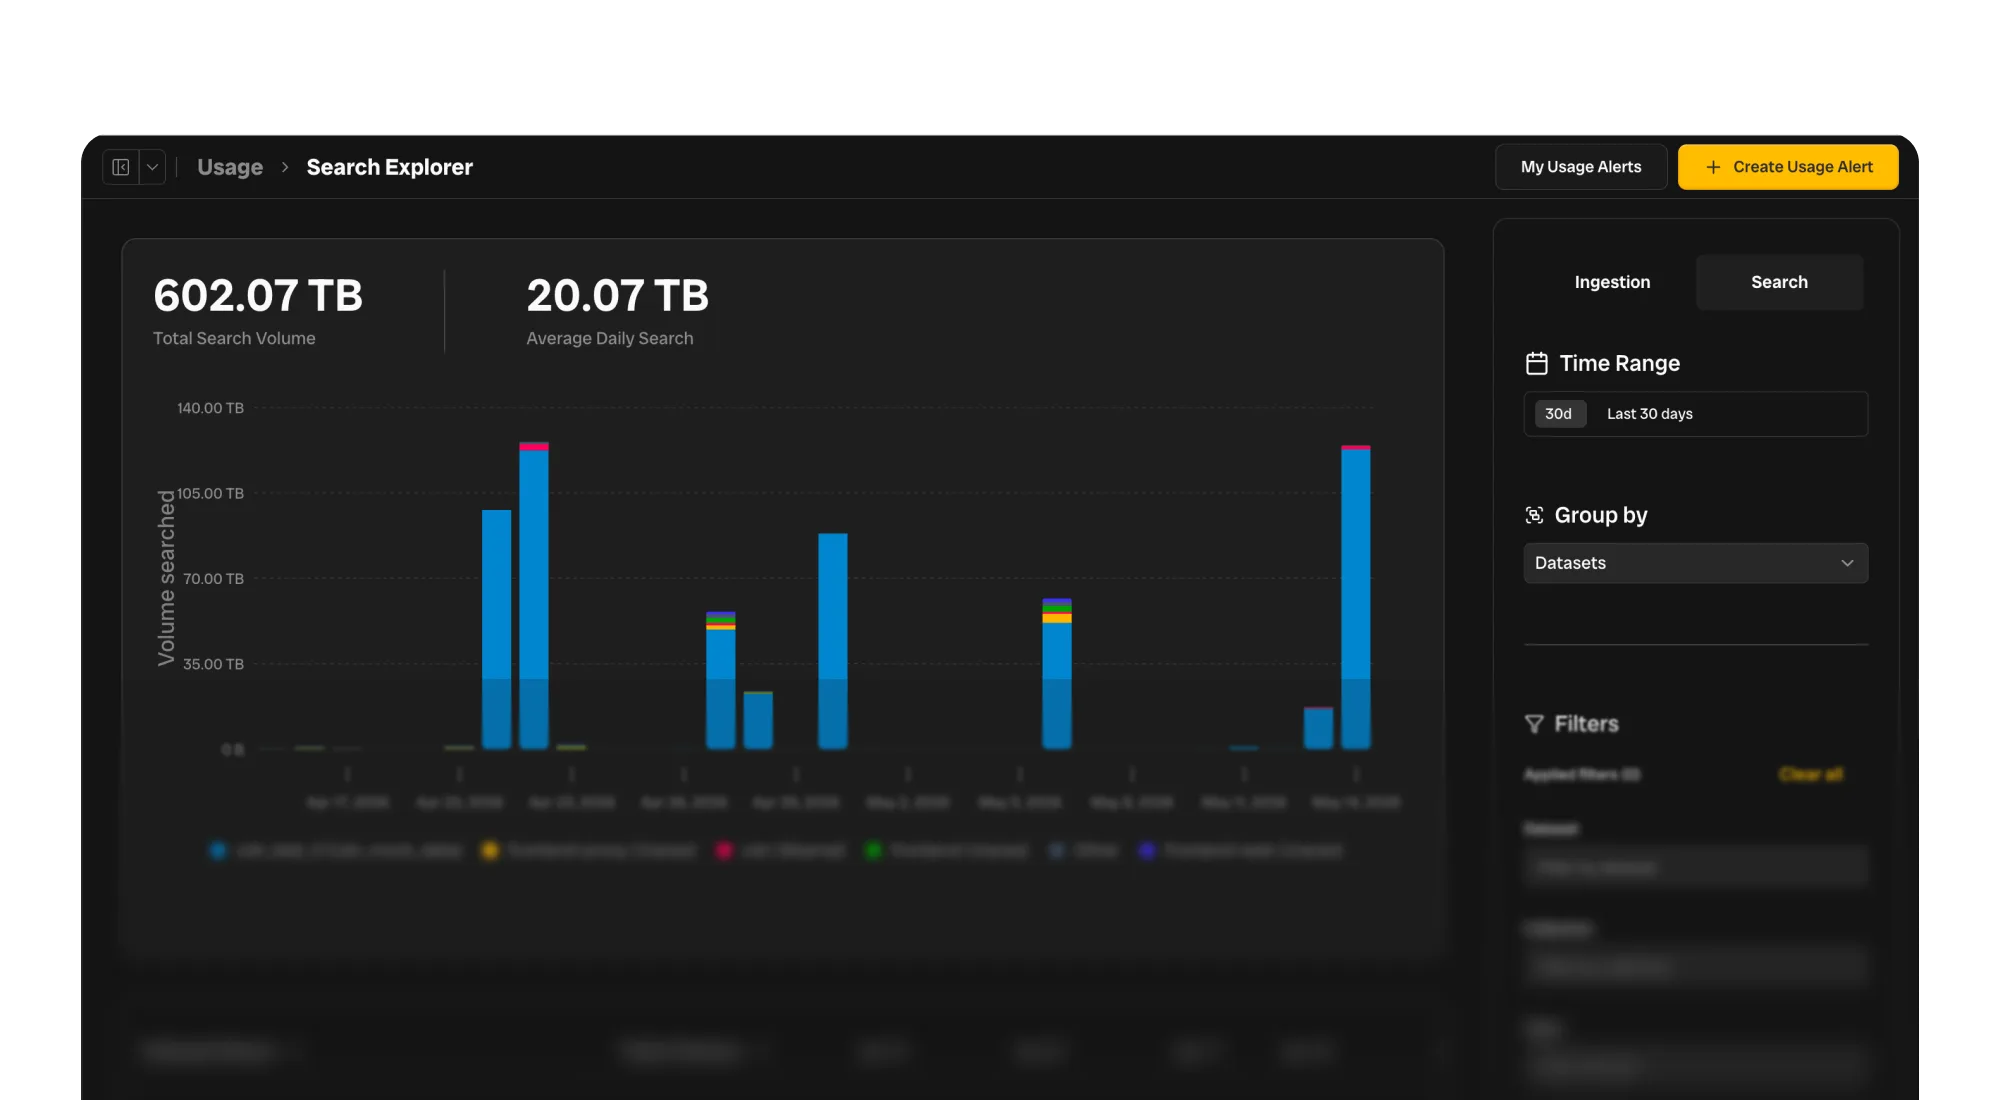
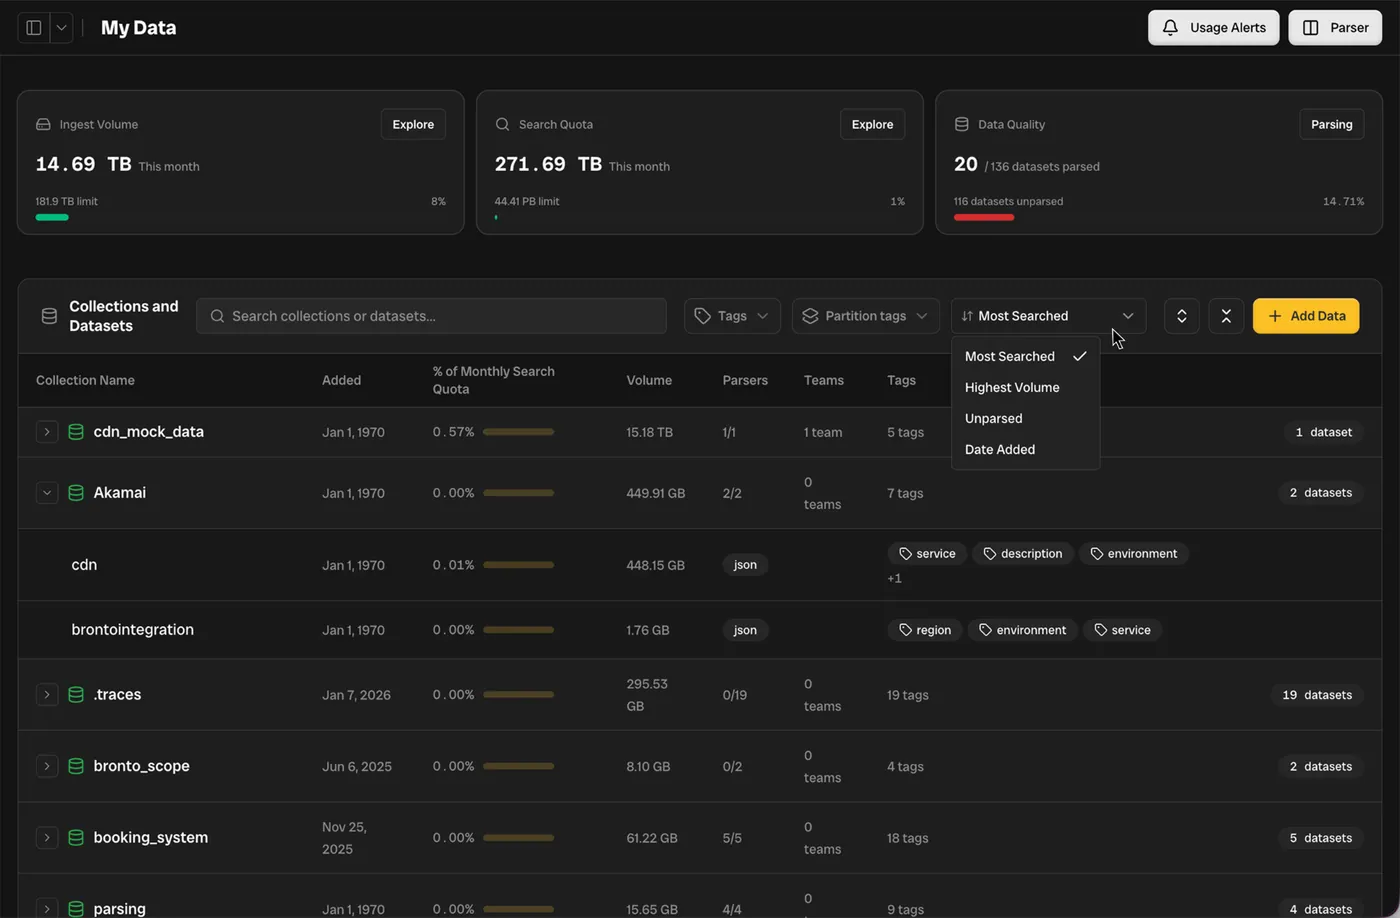
Usage Explorer
The Search & Ingestion Explorer lets you drill down into exactly how your platform is being used — by whom, on what data, and at what volume.
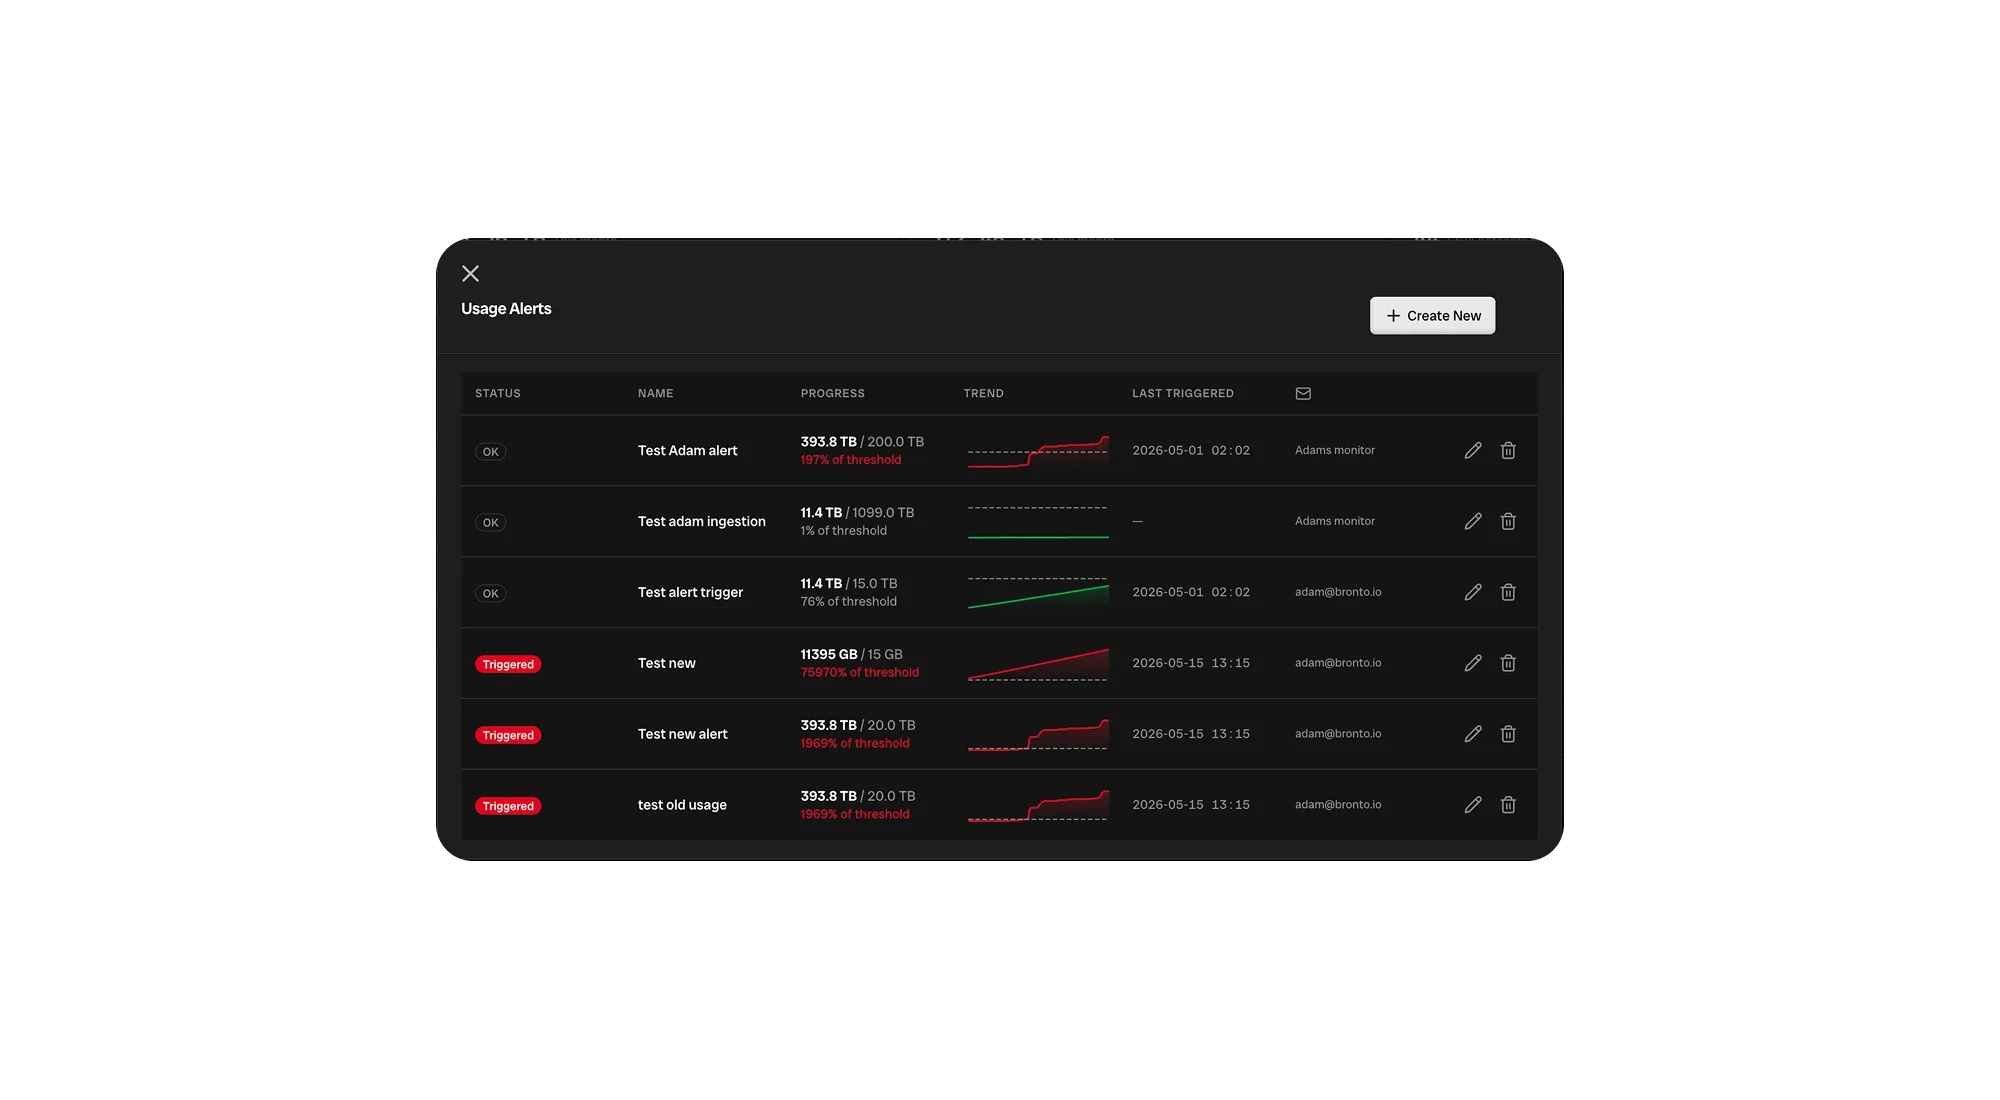
Usage Alerts
Set thresholds on ingestion and search volume — get notified the moment usage crosses your limits.
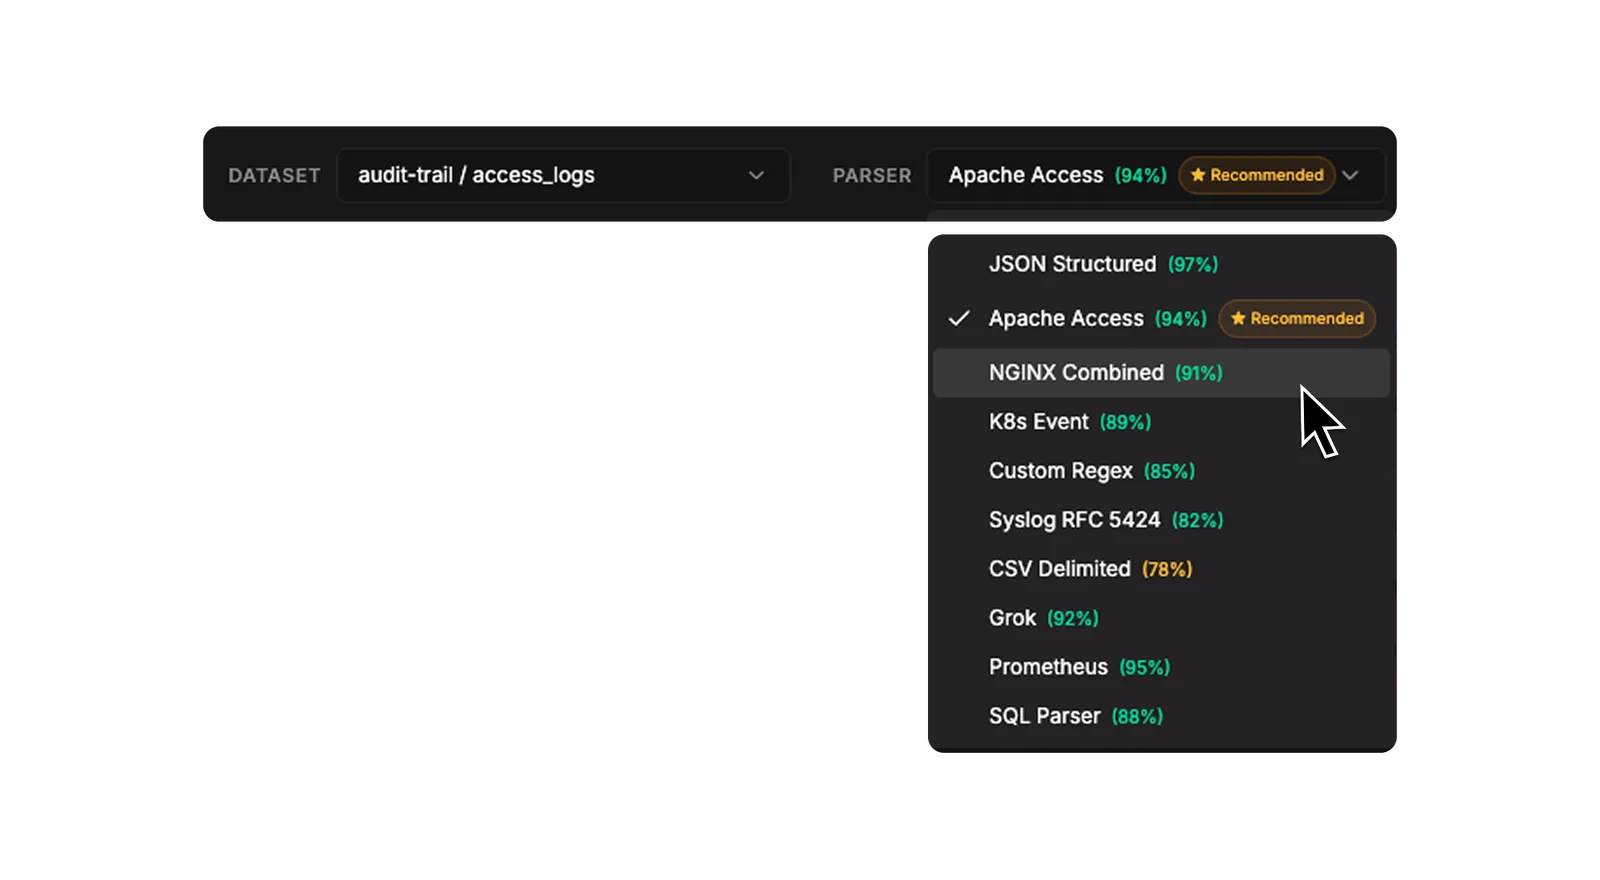
Auto-Parsing
Logs are parsed at ingestion using known formats or AI.
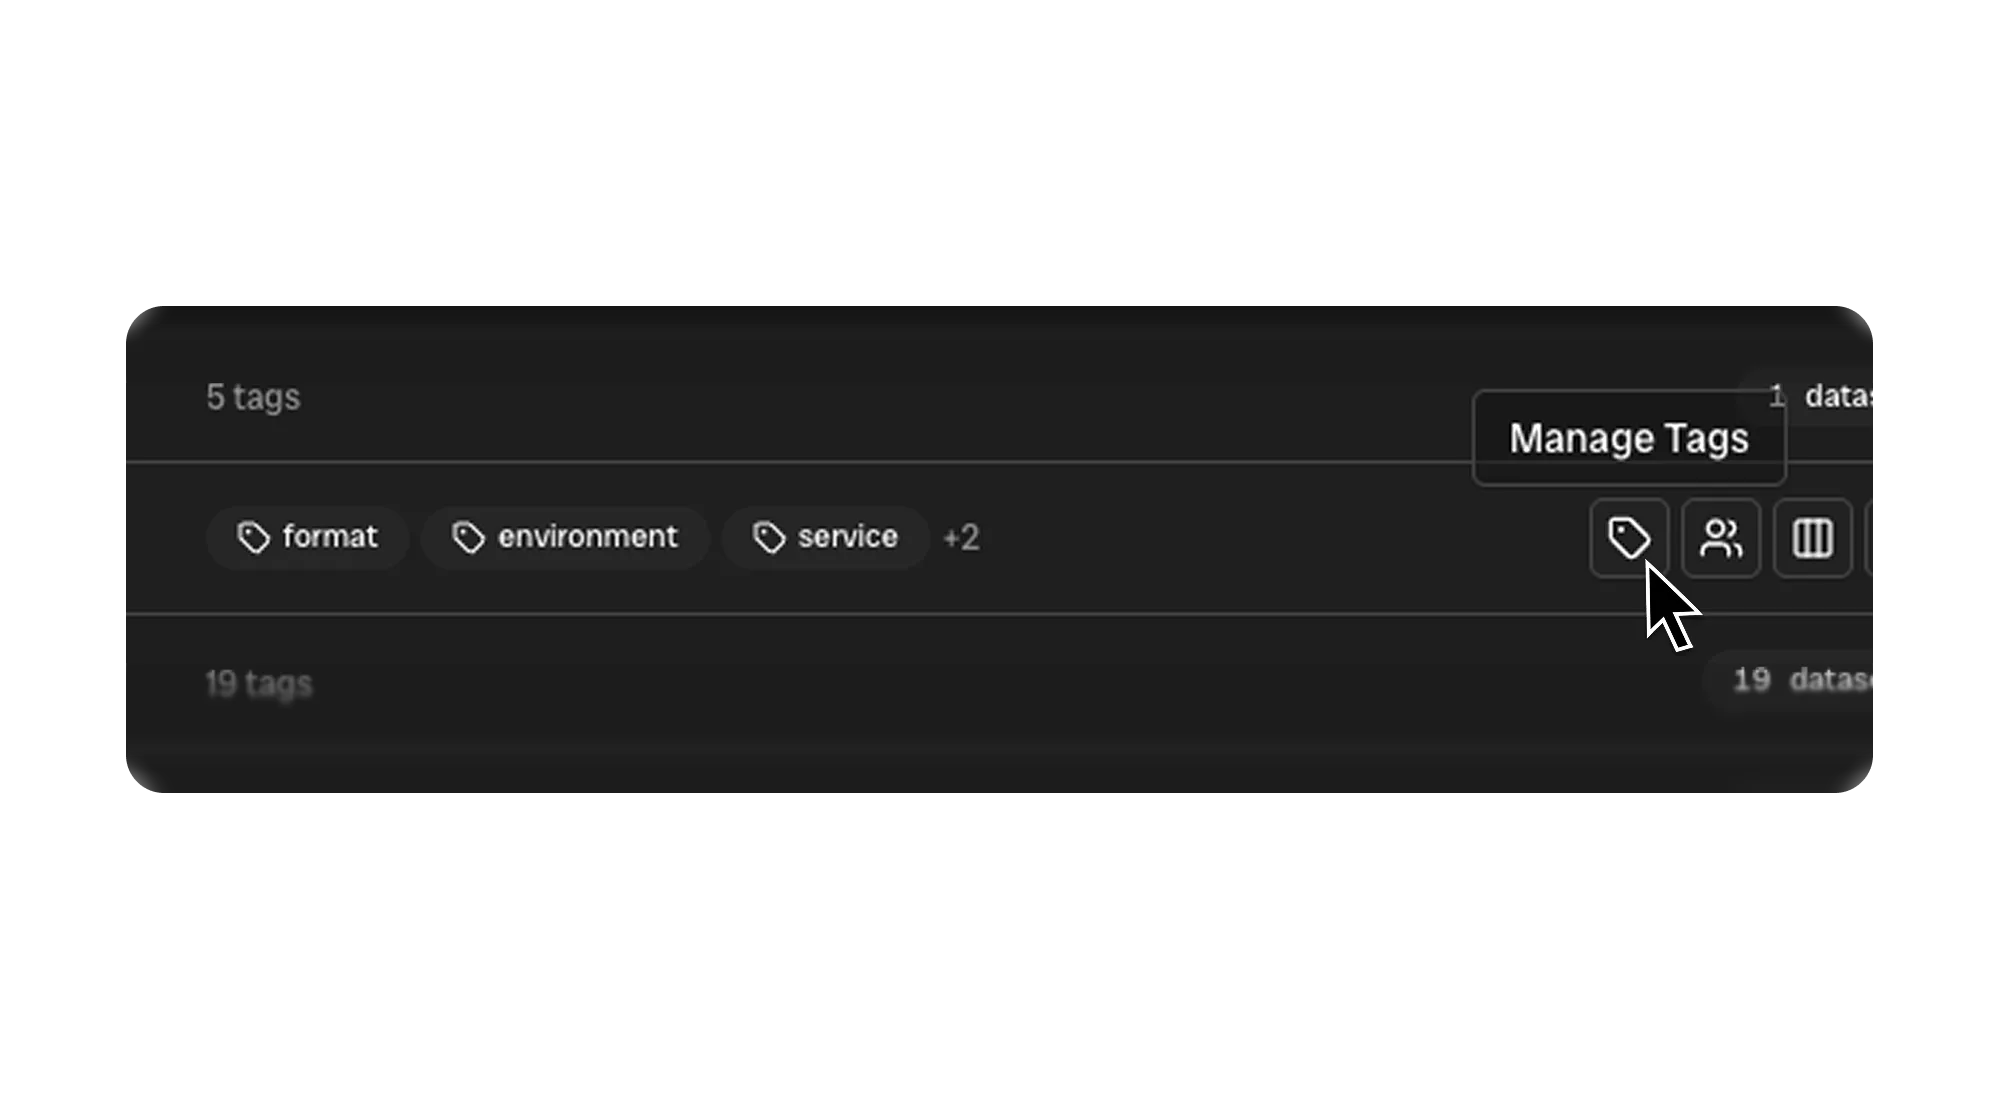
Manage Tags & Teams
Tag every dataset and assign owners so teams can organise, filter, and govern their telemetry at scale.
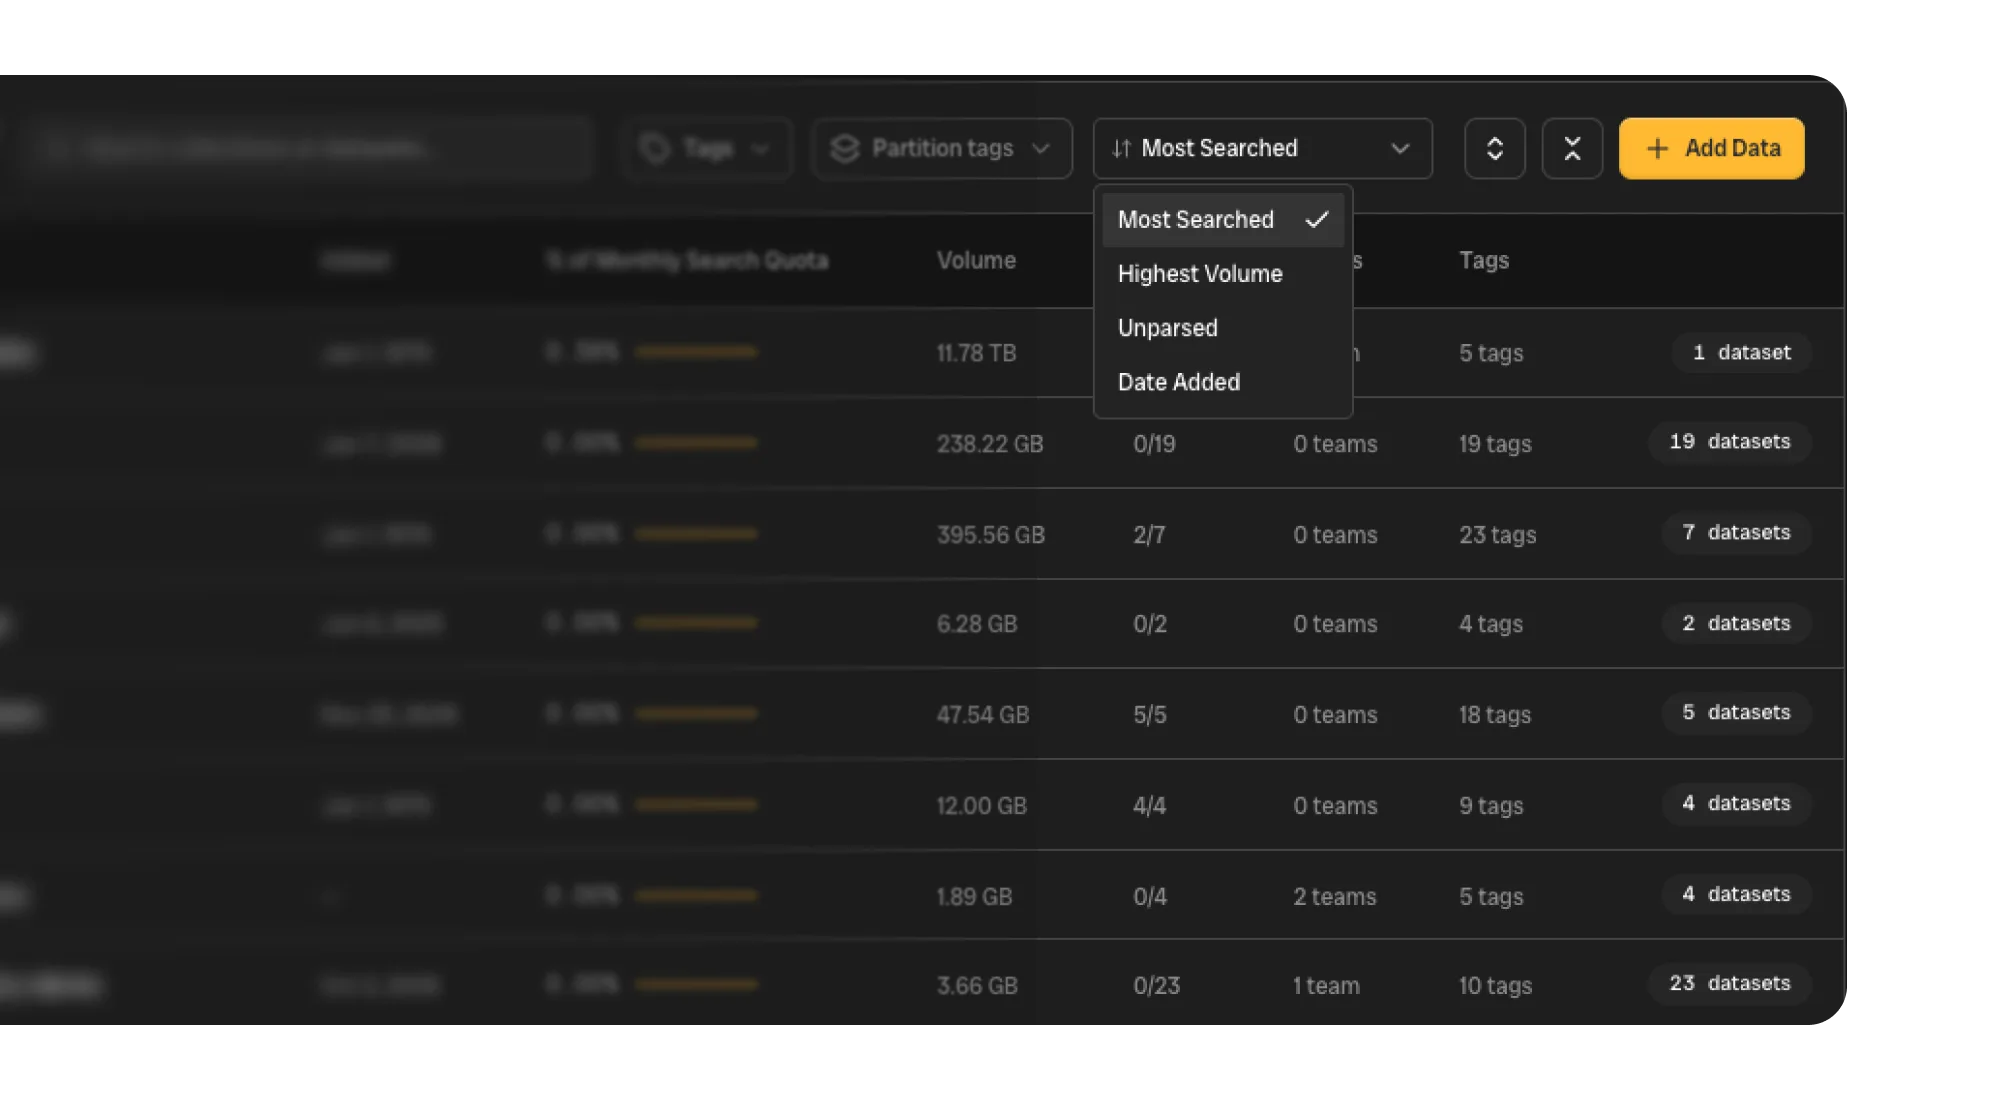
Value Attribution
See which datasets are pulling their weight — and which ones are sitting unused — so you can attribute value to every TB ingested.

Bronto AI does the hard work,
so you can keep building.
AI is embedded throughout the entire platform — removing toil, surfacing root causes, and helping your team find answers in seconds, not hours.

Root Cause Analysis Report
Generated: May 06, 2026 17:26:00 Window: Apr 29 → May 06
1. Analysis
Primary Issue
Sustained, high-volume backend receive errors (BG-ERROR-RECV) returning HTTP 503 across the API fleet.
Scope Description
- Total errors: ~7.1M across the 7-day window, 20 buckets
- Volume is consistently massive — ~343K to ~371K per bucket, indicating a chronic, systemic failure
- Signature (
BG-ERROR-RECV, HTTP 503) points to Fastly edge failing to receive a valid response from origin (api.host78.us.example.com) - Protocol anomaly:
request_protocol: "UDP"— invalid for HTTP API endpoint - Edge:
fastly_is_edge: true— failure at edge tier before app layer - Response time: 3643ms — requests stalling at backend before drop
- Trend: slight decline mid-window (Apr 30–May 02 ~360K) then rebounding sharply (May 05–06 ~371K) — worsening
2. Hypothesis & Next Steps
Probable Cause
Backend origin servers behind Fastly are failing to handle TCP connections reliably — likely origin pool exhaustion, a crashing upstream, or a network-level issue preventing edge nodes from completing the handshake. The UDP protocol field suggests either malformed requests forwarded to origin (misconfigured VCL) or a logging pipeline bug masking the true protocol.
Immediate Next Steps
- Investigate the UDP anomaly at Fastly. Review VCL config for
api.host78.us.example.com; pull real-time logs filtered tocache-iad-kcgs_*to check if errors concentrate on specific PoPs (especially IAD). - Assess origin server health. Check CPU, memory, file descriptors, and connection queue depth. Review app logs from May 05 17:00 → May 06 17:26 for crash loops, OOM events, or dependency failures.
Report confidence: High — volume consistency and error signature indicate a reproducible failure mode requiring parallel edge and origin investigation.
Related queries
- service:api status:503 host:"api.host78.us.example.com"
- fastly_is_edge:true error_code:BG-ERROR-RECV
- pop:cache-iad-kcgs_* response_time:>3000
[Bronto] Investigation Report · New org created in US
A new organization was created in the US which triggered the "New org created in US" monitor. Trial setup completed successfully and no anomalies or service issues were detected.
The monitoring workflow detected the creation of a new organization in the US region and automatically generated an investigation report. The system successfully created the organization, customer account, user account, and trial limits without interruption.
This investigation was triggered intentionally by the "New org created in US" monitor. The monitor notifies the team whenever a new trial organization is provisioned in production. The behavior matches expected onboarding activity.
No immediate action is required. Recommended follow-up: validate welcome email delivery, monitor early ingestion activity, and confirm billing and trial entitlements remain correctly applied over the next 24 hours.
| # | timestamp | level | service | method | path | status | duration | trace_id | user_id | message |
|---|---|---|---|---|---|---|---|---|---|---|
| 1 | 2026-05-06T15:50:29.023Z | INFO | payment-svc | PUT | /api/v1/orders | 201 | 89 | ae082847-7c3a-41 | usr_7cnszl | Request processed successfully |
| 2 | 2026-05-06T15:50:32.023Z | INFO | api-gateway | PUT | /api/v1/payments | 400 | 791 | 773c4702-1d37-48 | usr_6xjqtf | Authentication token validated |
| 3 | 2026-05-06T15:50:35.023Z | ERROR | payment-svc | GET | /api/v1/orders | 200 | 652 | cb18b186-cc39-49 | usr_st05bj | Request processed successfully |
| 4 | 2026-05-06T15:50:38.023Z | DEBUG | payment-svc | POST | /api/v1/auth/login | 400 | 851 | c51e1053-4d29-41 | usr_zeg1z5 | Rate limit threshold approaching |
| 5 | 2026-05-06T15:50:41.023Z | WARN | auth-service | DELETE | /api/v1/health | 500 | 851 | 6cbfce21-94aa-49 | usr_rix8ib | Rate limit threshold approaching |
| 6 | 2026-05-06T15:50:44.023Z | DEBUG | order-service | DELETE | /api/v1/auth/login | 500 | 329 | 991c6b2e-290e-4e | usr_tf7nqi | Request processed successfully |
| 7 | 2026-05-06T15:50:47.023Z | ERROR | auth-service | DELETE | /api/v1/payments | 400 | 207 | 21bc8db6-faca-4a | usr_4yhgbp | Rate limit threshold approaching |
| 8 | 2026-05-06T15:50:50.023Z | INFO | api-gateway | POST | /api/v1/orders | 201 | 142 | f47ac10b-58cc-4a | usr_k3m9wp | Authentication token validated |
| 9 | 2026-05-06T15:50:53.023Z | WARN | payment-svc | GET | /api/v1/payments | 200 | 998 | b7d2c891-3f12-49 | usr_8nv2qs | Request processed successfully |
| 10 | 2026-05-06T15:50:56.023Z | ERROR | auth-service | PUT | /api/v1/health | 500 | 412 | a92e0c14-9b88-4d | usr_pl4xtb | Rate limit threshold approaching |
| 11 | 2026-05-06T15:50:59.023Z | INFO | order-service | POST | /api/v1/orders | 201 | 76 | 5e1f8a73-2c44-41 | usr_q9c1zr | Request processed successfully |
| 12 | 2026-05-06T15:51:02.023Z | DEBUG | payment-svc | GET | /api/v1/payments | 200 | 583 | c2d9b6e0-7f33-48 | usr_h7d3yf | Authentication token validated |
| 13 | 2026-05-06T15:51:05.023Z | INFO | api-gateway | DELETE | /api/v1/auth/login | 400 | 921 | e8b4f3a1-4d28-42 | usr_b2x8mn | Rate limit threshold approaching |
| 14 | 2026-05-06T15:51:08.023Z | WARN | auth-service | PUT | /api/v1/health | 500 | 305 | 3a7c9d2e-1b55-4f | usr_v4w6ks | Request processed successfully |
| 15 | 2026-05-06T15:51:11.023Z | ERROR | payment-svc | POST | /api/v1/orders | 201 | 188 | 8f2e1a6c-9c77-43 | usr_j1n5pq | Authentication token validated |
| 16 | 2026-05-06T15:51:14.023Z | INFO | order-service | GET | /api/v1/payments | 200 | 754 | d4b8e7f0-3a99-45 | usr_t8r2lc | Request processed successfully |
| 17 | 2026-05-06T15:51:17.023Z | DEBUG | api-gateway | PUT | /api/v1/auth/login | 400 | 432 | 1c5b9e8d-6e22-4a | usr_g6f9hd | Rate limit threshold approaching |
| 18 | 2026-05-06T15:51:20.023Z | INFO | payment-svc | DELETE | /api/v1/health | 500 | 611 | 9b3d6f2a-8c11-49 | usr_m3e7vb | Request processed successfully |
| 19 | 2026-05-06T15:51:23.023Z | WARN | auth-service | POST | /api/v1/orders | 201 | 95 | 7e2a4b1c-5d66-48 | usr_y5u1xa | Authentication token validated |
| 20 | 2026-05-06T15:51:26.023Z | ERROR | order-service | GET | /api/v1/payments | 200 | 488 | 2f8c1d9e-4b33-47 | usr_o2k4wn | Request processed successfully |
Loved by teams
around the world
“Bronto fundamentally changed how we think about logging. We went from treating logs as a necessary evil — expensive, unreliable, and limited — to making them a key asset. The combination of unlimited retention, lightning-fast search, and AI-powered insights means we catch issues much earlier, often before customers notice them. But the real transformation is cultural: every team now has access to the data they need, when they need it.”

Paul Griffin
Head of Platform Engineering
“Bronto's long-term always-hot days mean we can access data with sub-second search, whether it's from last week or last year. This is huge for our security and AI strategy as we continue to revolutionize how we work at Nitro. For AI-powered analysis of our logs, data availability is key — it's just not possible with only a few days of retention. Bronto has become a key part of our toolkit when we think of log data and how it will play an important role for engineering, security and product teams going forward.”

John Fitzpatrick
CTO
“Tasks that used to take 15 minutes are now almost instant. I find myself using Bronto much more than the previous tool simply because it's faster and more responsive. I can quickly ask questions and get immediate answers, which makes it easier to explore insights that were previously hard to uncover. With a year's worth of data retention instead of just 90 days, I can now identify annual trends and patterns I couldn't see before. This extended retention opens the door for much deeper analytics.”

Brian Elliott
Senior Engineering Manager, SaaS Services
“It's a night and day difference to our previous logging provider. Bronto typically returns results in seconds, while our old vendor took over 30 minutes and frequently failed to render visualizations. Bronto has come a long way with everything from usage to UI. Our users are getting what they're looking for.”

Jaymin Patel
Team Lead
“Bronto helped us cut costs and centralize our multi-cloud application logging, as well as providing cost-effective 12 month retention for billing-related events. Troubleshooting is now significantly faster, and having all our logs correlate properly in one place has been a game-changer for our team.”

Joaquín Sargiotto
DevOps Team Lead
“The TCO reduction is significant — we're saving hundreds of thousands annually. But the real value is in new and significantly enhanced capabilities. A significant reduction in time to root cause, investigating issues from months ago, having logs actually available during incidents — these aren't just improvements, they're game-changers. Our SysOps team now get to work on platform innovation instead of keeping Graylog alive.”
Aodh O'Mahony
Engineering Manager
“Bronto fundamentally changed how we think about logging. We went from treating logs as a necessary evil — expensive, unreliable, and limited — to making them a key asset. The combination of unlimited retention, lightning-fast search, and AI-powered insights means we catch issues much earlier, often before customers notice them. But the real transformation is cultural: every team now has access to the data they need, when they need it.”
Paul Griffin
Head of Platform Engineering
“Bronto's long-term always-hot days mean we can access data with sub-second search, whether it's from last week or last year. This is huge for our security and AI strategy as we continue to revolutionize how we work at Nitro. For AI-powered analysis of our logs, data availability is key — it's just not possible with only a few days of retention. Bronto has become a key part of our toolkit when we think of log data and how it will play an important role for engineering, security and product teams going forward.”
John Fitzpatrick
CTO
“Tasks that used to take 15 minutes are now almost instant. I find myself using Bronto much more than the previous tool simply because it's faster and more responsive. I can quickly ask questions and get immediate answers, which makes it easier to explore insights that were previously hard to uncover. With a year's worth of data retention instead of just 90 days, I can now identify annual trends and patterns I couldn't see before. This extended retention opens the door for much deeper analytics.”
Brian Elliott
Senior Engineering Manager, SaaS Services
“It's a night and day difference to our previous logging provider. Bronto typically returns results in seconds, while our old vendor took over 30 minutes and frequently failed to render visualizations. Bronto has come a long way with everything from usage to UI. Our users are getting what they're looking for.”
Jaymin Patel
Team Lead
“Bronto helped us cut costs and centralize our multi-cloud application logging, as well as providing cost-effective 12 month retention for billing-related events. Troubleshooting is now significantly faster, and having all our logs correlate properly in one place has been a game-changer for our team.”
Joaquín Sargiotto
DevOps Team Lead
“The TCO reduction is significant — we're saving hundreds of thousands annually. But the real value is in new and significantly enhanced capabilities. A significant reduction in time to root cause, investigating issues from months ago, having logs actually available during incidents — these aren't just improvements, they're game-changers. Our SysOps team now get to work on platform innovation instead of keeping Graylog alive.”
Aodh O'Mahony
Engineering Manager
From zero to insight in minutes
Bronto is designed so your team can start finding answers on day one — not day thirty.
Connect your data
Send logs, metrics, and traces using OpenTelemetry, Fluentd, Datadog agents, or any standard format. No proprietary lock-in.


%20--%3e%3csvg%20version='1.1'%20id='Layer_1'%20xmlns='http://www.w3.org/2000/svg'%20xmlns:xlink='http://www.w3.org/1999/xlink'%20x='0px'%20y='0px'%20viewBox='0%200%20304%20182'%20style='enable-background:new%200%200%20304%20182;'%20xml:space='preserve'%3e%3cstyle%20type='text/css'%3e%20.st0{fill:%23252F3E;}%20.st1{fill-rule:evenodd;clip-rule:evenodd;fill:%23FF9900;}%20%3c/style%3e%3cg%3e%3cpath%20class='st0'%20d='M86.4,66.4c0,3.7,0.4,6.7,1.1,8.9c0.8,2.2,1.8,4.6,3.2,7.2c0.5,0.8,0.7,1.6,0.7,2.3c0,1-0.6,2-1.9,3l-6.3,4.2%20c-0.9,0.6-1.8,0.9-2.6,0.9c-1,0-2-0.5-3-1.4C76.2,90,75,88.4,74,86.8c-1-1.7-2-3.6-3.1-5.9c-7.8,9.2-17.6,13.8-29.4,13.8%20c-8.4,0-15.1-2.4-20-7.2c-4.9-4.8-7.4-11.2-7.4-19.2c0-8.5,3-15.4,9.1-20.6c6.1-5.2,14.2-7.8,24.5-7.8c3.4,0,6.9,0.3,10.6,0.8%20c3.7,0.5,7.5,1.3,11.5,2.2v-7.3c0-7.6-1.6-12.9-4.7-16c-3.2-3.1-8.6-4.6-16.3-4.6c-3.5,0-7.1,0.4-10.8,1.3c-3.7,0.9-7.3,2-10.8,3.4%20c-1.6,0.7-2.8,1.1-3.5,1.3c-0.7,0.2-1.2,0.3-1.6,0.3c-1.4,0-2.1-1-2.1-3.1v-4.9c0-1.6,0.2-2.8,0.7-3.5c0.5-0.7,1.4-1.4,2.8-2.1%20c3.5-1.8,7.7-3.3,12.6-4.5c4.9-1.3,10.1-1.9,15.6-1.9c11.9,0,20.6,2.7,26.2,8.1c5.5,5.4,8.3,13.6,8.3,24.6V66.4z%20M45.8,81.6%20c3.3,0,6.7-0.6,10.3-1.8c3.6-1.2,6.8-3.4,9.5-6.4c1.6-1.9,2.8-4,3.4-6.4c0.6-2.4,1-5.3,1-8.7v-4.2c-2.9-0.7-6-1.3-9.2-1.7%20c-3.2-0.4-6.3-0.6-9.4-0.6c-6.7,0-11.6,1.3-14.9,4c-3.3,2.7-4.9,6.5-4.9,11.5c0,4.7,1.2,8.2,3.7,10.6%20C37.7,80.4,41.2,81.6,45.8,81.6z%20M126.1,92.4c-1.8,0-3-0.3-3.8-1c-0.8-0.6-1.5-2-2.1-3.9L96.7,10.2c-0.6-2-0.9-3.3-0.9-4%20c0-1.6,0.8-2.5,2.4-2.5h9.8c1.9,0,3.2,0.3,3.9,1c0.8,0.6,1.4,2,2,3.9l16.8,66.2l15.6-66.2c0.5-2,1.1-3.3,1.9-3.9c0.8-0.6,2.2-1,4-1%20h8c1.9,0,3.2,0.3,4,1c0.8,0.6,1.5,2,1.9,3.9l15.8,67l17.3-67c0.6-2,1.3-3.3,2-3.9c0.8-0.6,2.1-1,3.9-1h9.3c1.6,0,2.5,0.8,2.5,2.5%20c0,0.5-0.1,1-0.2,1.6c-0.1,0.6-0.3,1.4-0.7,2.5l-24.1,77.3c-0.6,2-1.3,3.3-2.1,3.9c-0.8,0.6-2.1,1-3.8,1h-8.6c-1.9,0-3.2-0.3-4-1%20c-0.8-0.7-1.5-2-1.9-4L156,23l-15.4,64.4c-0.5,2-1.1,3.3-1.9,4c-0.8,0.7-2.2,1-4,1H126.1z%20M254.6,95.1c-5.2,0-10.4-0.6-15.4-1.8%20c-5-1.2-8.9-2.5-11.5-4c-1.6-0.9-2.7-1.9-3.1-2.8c-0.4-0.9-0.6-1.9-0.6-2.8v-5.1c0-2.1,0.8-3.1,2.3-3.1c0.6,0,1.2,0.1,1.8,0.3%20c0.6,0.2,1.5,0.6,2.5,1c3.4,1.5,7.1,2.7,11,3.5c4,0.8,7.9,1.2,11.9,1.2c6.3,0,11.2-1.1,14.6-3.3c3.4-2.2,5.2-5.4,5.2-9.5%20c0-2.8-0.9-5.1-2.7-7c-1.8-1.9-5.2-3.6-10.1-5.2L246,52c-7.3-2.3-12.7-5.7-16-10.2c-3.3-4.4-5-9.3-5-14.5c0-4.2,0.9-7.9,2.7-11.1%20c1.8-3.2,4.2-6,7.2-8.2c3-2.3,6.4-4,10.4-5.2c4-1.2,8.2-1.7,12.6-1.7c2.2,0,4.5,0.1,6.7,0.4c2.3,0.3,4.4,0.7,6.5,1.1%20c2,0.5,3.9,1,5.7,1.6c1.8,0.6,3.2,1.2,4.2,1.8c1.4,0.8,2.4,1.6,3,2.5c0.6,0.8,0.9,1.9,0.9,3.3v4.7c0,2.1-0.8,3.2-2.3,3.2%20c-0.8,0-2.1-0.4-3.8-1.2c-5.7-2.6-12.1-3.9-19.2-3.9c-5.7,0-10.2,0.9-13.3,2.8c-3.1,1.9-4.7,4.8-4.7,8.9c0,2.8,1,5.2,3,7.1%20c2,1.9,5.7,3.8,11,5.5l14.2,4.5c7.2,2.3,12.4,5.5,15.5,9.6c3.1,4.1,4.6,8.8,4.6,14c0,4.3-0.9,8.2-2.6,11.6%20c-1.8,3.4-4.2,6.4-7.3,8.8c-3.1,2.5-6.8,4.3-11.1,5.6C264.4,94.4,259.7,95.1,254.6,95.1z'/%3e%3cg%3e%3cpath%20class='st1'%20d='M273.5,143.7c-32.9,24.3-80.7,37.2-121.8,37.2c-57.6,0-109.5-21.3-148.7-56.7c-3.1-2.8-0.3-6.6,3.4-4.4%20c42.4,24.6,94.7,39.5,148.8,39.5c36.5,0,76.6-7.6,113.5-23.2C274.2,133.6,278.9,139.7,273.5,143.7z'/%3e%3cpath%20class='st1'%20d='M287.2,128.1c-4.2-5.4-27.8-2.6-38.5-1.3c-3.2,0.4-3.7-2.4-0.8-4.5c18.8-13.2,49.7-9.4,53.3-5%20c3.6,4.5-1,35.4-18.6,50.2c-2.7,2.3-5.3,1.1-4.1-1.9C282.5,155.7,291.4,133.4,287.2,128.1z'/%3e%3c/g%3e%3c/g%3e%3c/svg%3e)

Auto-parsed & structured
AI recognises known formats and structures every field automatically — no manual pipelines needed.
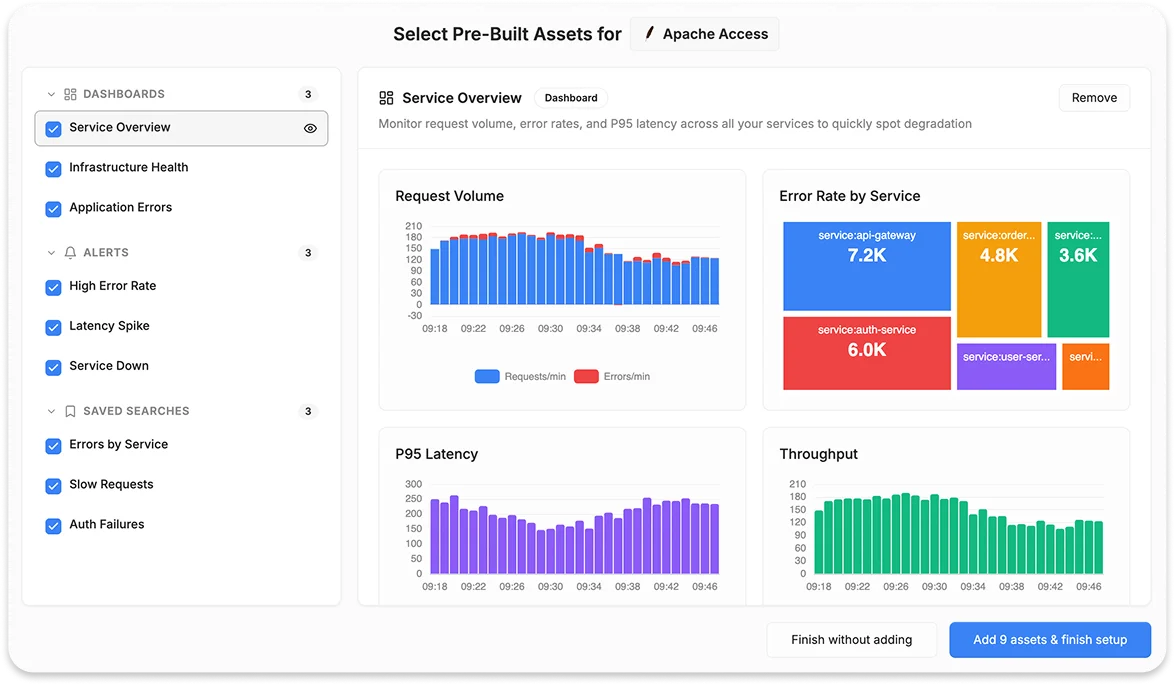
Prebuilt Dashboards, monitors and search filters
Pre-built templates match your data shape so you can visualise immediately.
Get answers instantly
Query terabytes of data in sub-seconds using SQL. Correlate logs-metrics-traces across anytime frame. Identify patterns and anomalies and let AI find the answers.
Get a walkthrough from our team or jump straight in with a free trial.