
Trust, Discovery, Context, Consistency: What AWS DevOps Agent Looks For in a Telemetry Layer
Stephen Crowley
Sales Engineer
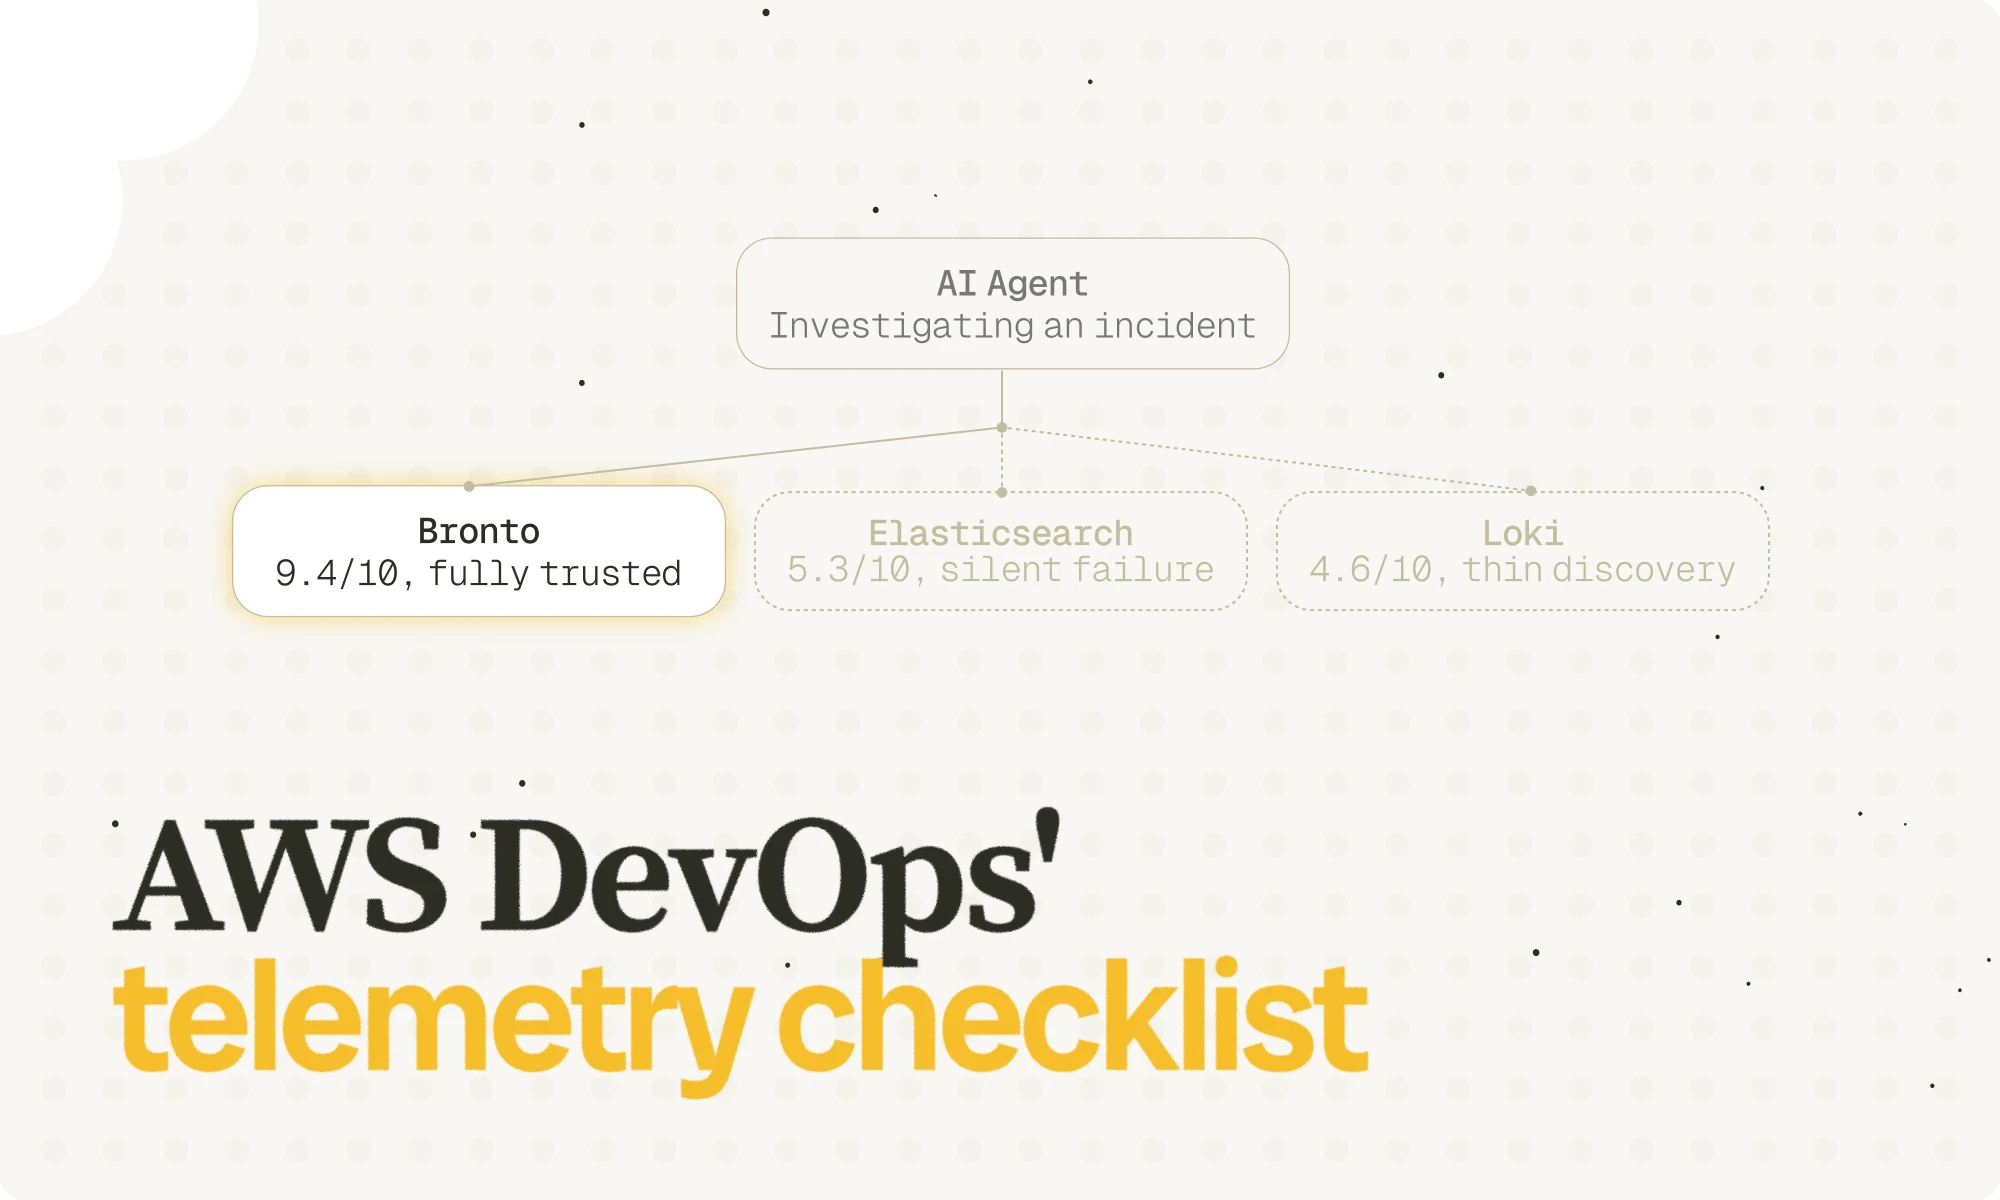
AWS DevOps Agent was built for modern software environments: engineering teams running heterogeneous infrastructure, juggling multiple observability tools, and without enough bandwidth to manually investigate every service incident. Its GA announcement highlighted reductions in mean time to resolution from two hours to thirty minutes, but that kind of improvement only happens when the underlying telemetry data is clean, structured, and fast to query.
This is where Bronto comes in. Not as a point integration built specifically for AWS DevOps Agent, but as a telemetry layer designed from the ground up around the principles that make any AI-driven investigation successful: trust in every result, discovery before every query, full context in every response, and consistent behaviour across every dataset.
We put this to the test directly. In a side-by-side evaluation, the same system, the OpenTelemetry demo application, sent data simultaneously to Bronto, Elasticsearch/Lucene (via OpenSearch), and Grafana Loki, all exposed via their respective MCP integrations. AWS DevOps Agent ran the same incident investigation against all three and then we asked it to judge.
We gave it a deliberately neutral prompt, designed to let the agent reach its own conclusions based on what it had just experienced:
Compare Bronto, Elasticsearch/OpenSearch, and Grafana Loki for use by AI agents (like AWS DevOps Agent) performing incident investigation.
Focus the comparison on what matters for AI agents, NOT human usability.
Include Recommendations for AWS DevOps Agent. Do NOT focus on: Query syntax complexity (AI handles nested JSON fine), Human readability of responses, Nesting depth.
Output as Markdown in a code block so I can copy/paste it.
The prompt explicitly told the agent to ignore the things Bronto is often praised for by humans, simple query syntax, flat response structure, readable output. We wanted to know what mattered to the agent itself, working from its own experience querying all three systems during a live investigation.
Its verdict was unambiguous. For incident investigation, Bronto is the clear winner. The evaluation identified four factors that actually determine whether an AI agent can investigate reliably.
Silent failure risk. Does the system fail quietly with wrong results?
Data discovery. Can the agent explore before querying?
Response completeness. Does one query return enough context?
Deterministic behavior. Does the same query always produce the same behavior?
System | AI Agent Suitability | Primary Issue |
|---|---|---|
Bronto | High (9.4/10) | None significant |
Elasticsearch/Lucene | Medium (5.3/10) | Silent failures from case/mapping issues |
Grafana Loki | Low (4.6/10) | Limited discovery, minimal context |
Here's what each of those factors means in practice.
1. Silent failure risk
The most critical factor for AI agents is not whether they can express a query, it's whether they can trust the result. When a query returns empty results, the agent must decide: is there genuinely no matching data, or did the query fail silently for some other reason? Unlike a human analyst who might notice something feels off and try a different approach, an AI agent treats an empty result as ground truth and continues its investigation on that basis.
Elasticsearch/Lucene, the search engine powering OpenSearch, Amazon OpenSearch Service, Elastic Cloud, and self-hosted ELK stacks, uses case-sensitive keyword field matching by default. A filter written as { "term": { "service.name": "Checkout" } } returns zero results if the indexed value is checkout and it does it silently, with no error. The same silent failure applies to wrong field types (.keyword vs analyzed), fields that exist in the data but weren't mapped at index setup time, and any variation in field naming between indices. The agent concludes "no data" when the reality is "query did not match."
Loki has fewer mapping complexities, but labels are case-sensitive and log content grep is case-sensitive by default. An agent querying {service_name="Checkout"} when the label value is checkout gets zero results with no signal that the label exists with a different casing.
Bronto returns a clear error for unknown field names. Its ILIKE operator handles any casing — $service.name = 'Checkout' matches checkout, CHECKOUT, and any other variant. When Bronto returns empty results, the agent can treat that as a trustworthy signal that no matching data exists.
Failure Type | Bronto | Elasticsearch/Lucene | Loki |
|---|---|---|---|
Wrong case in query value | Still works (ILIKE) | Silent empty result | Silent empty result |
Wrong case in field name | Clear error | Silent empty result | Silent empty result |
Field doesn't exist | Clear error | Silent empty result | Silent empty result |
Wrong field type ( | N/A (consistent) | Silent wrong results | N/A |
Typo in field name | Clear error | Silent empty result | Silent empty result |
The consequence for an autonomous investigation is direct: in our evaluation, Elasticsearch/Lucene returned zero events for every error and warning query across cart, payment, and ad services, even though the events existed in the index. An agent relying on those results would have proceeded under the conclusion that no active errors existed, while multiple services were actively failing. Bronto returned all of them.
System | When Query Returns Empty | Agent Concludes | Actually Correct? |
|---|---|---|---|
Bronto | No matching data exists | "No errors found" | Likely correct |
Elasticsearch/Lucene | Unknown reason | "No errors found" | May be wrong |
Loki | Unknown reason | "No errors found" | May be wrong |
2. Data discovery
Can the agent explore what data exists and verify a query will work before it runs it? This determines whether the agent enters an investigation with confidence or proceeds on assumptions that may silently be wrong.
Bronto treats discovery as a first-class workflow, and critically, it works across all data in Bronto, not just OpenTelemetry. Bronto ingests OTEL traces and logs, but also accepts data from syslog, custom JSON pipelines, CloudWatch exports, and many other sources. Whatever the origin, the discovery tools work the same way. The agent calls get_datasets() to get a named catalogue of every dataset available. It calls get_keys(log_id="checkout") to list all searchable fields in that dataset. It calls get_key_values(log_id="checkout", key="$severity_text") to enumerate the actual values present — ["INFO", "ERROR", "WARN"]. By the time the agent issues its first search query, it knows the field exists, knows what values are in it, and can form that query with confidence. This matters especially in mixed environments where some services send OTEL data and others send proprietary log formats. The agent doesn't need to know the provenance to explore the landscape.
Elasticsearch/Lucene's discovery path is complex and unreliable. GET _cat/indices returns a raw index list. GET logs-checkout-*/_mapping returns hundreds of lines of nested JSON that describe field types but not values. To discover what values actually exist in a field, the agent must run a separate aggregation query, and must already know whether the field is .keyword or analyzed to construct it correctly. There is no guided path from "I don't know what's here" to "I can now query with confidence."
Loki's discovery is limited to labels. list_loki_label_names() typically returns three or four labels: pod, service_name, stream. There is no way to discover the fields inside log content — whether a line contains a structured trace_id or user_id is unknowable without running a grep against it.
Capability | Bronto | Elasticsearch/Lucene | Loki |
|---|---|---|---|
List available datasets |
|
| Via labels only |
List searchable fields |
|
| Labels only (3–5 fields) |
List field values |
| Terms aggregation query | Label values only |
Verify field exists before query | Easy, explicit | Must parse mapping | Cannot for log content |
Works across non-OTEL data sources | Yes | Varies by index config | Not applicable |
Zero-knowledge start | Yes | No | No |
3. Response completeness
Does a single query return enough context for the agent to understand what happened, identify impact, and decide what to investigate next? Or does it need to issue multiple follow-up queries just to assemble basic context?
Bronto returns row-based dense JSON where every event is a self-describing object. A single error event reliably includes service name, service version, pod name, node name, namespace, trace ID, and user ID. All indexed and readable with a direct key lookup:
In our live test, Bronto found 15 real error events in 3 queries, with root cause visible immediately: "high memory usage" causing exporter timeouts. Trace IDs were present on every event, allowing the agent to pivot to trace correlation without an additional query.
Elasticsearch/Lucene's response completeness depends entirely on what was mapped when the index was created. Service version, node name, trace ID, and user ID may or may not be present and the answer differs across distributions and deployments. The response also wraps every hit in metadata (_index, _id, _score, _shards) that the agent must parse past before reaching the actual log data.
Loki returned zero application errors in the same test, only synthetic canary logs. Where it does return results, all structured context is embedded inside the raw log line string. The agent receives a byte string and must parse it to extract any field value, with no guarantee the fields are present or consistently formatted.
Context Needed | Bronto | Elasticsearch/Lucene | Loki |
|---|---|---|---|
Error message |
|
| Log line |
Service name |
| If mapped | If label exists |
Service version |
| If mapped | Rarely available |
Pod / node name | Indexed | If mapped | Rarely available |
Trace ID |
| If mapped | Must parse log line |
User ID |
| If mapped | Must parse log line |
Timestamp | Human-readable | ISO format | Nanoseconds |
Investigation Task | Bronto | Elasticsearch/Lucene | Loki |
|---|---|---|---|
Find error + full context | 1 query | 1–3 queries | 3–5+ queries |
Correlate with trace | 0 additional (trace_id included) | 0–1 additional | 2+ additional |
Identify user impact | 0 additional (user_id included) | 0–1 additional | 2+ additional |
Find related logs by trace | 1 query | 1 query | 5+ queries (per service) |
4. Deterministic behavior
Does the agent's investigative workflow work consistently across different services and datasets, or must it learn a different approach for each index it encounters? For an AI agent running 10–20 sequential queries during a P1 investigation, non-determinism compounds: each new dataset risks a silent failure if the agent assumes a schema that turns out not to apply.
It's worth being precise about what Bronto actually guarantees. Not every log in Bronto has a $severity_text field, because not every log is from OpenTelemetry. Bronto ingests syslog, custom JSON, CloudWatch exports, and many other formats alongside OTEL data. A NGINX access log won't have $severity_text. A custom application log might use level instead. The schema of any individual dataset depends on what was sent to it.
What is consistent is the workflow the agent uses to deal with that variation. Discovery is the deterministic part: get_datasets() always returns the catalogue, get_keys(log_id) always returns the actual fields present in that dataset, and get_key_values(log_id, key) always returns the actual values. The agent does not need to assume a schema. It can ask, get a definitive answer, and form a query that will succeed. That same three-call pattern works identically for an OTEL dataset, a syslog dataset, or a custom JSON ingest:
The fields differ but the workflow does not, so the agent never has to guess.
Elasticsearch/Lucene cannot make this guarantee. There is no enforced standard for field naming. One index might store service name as service.name.keyword, another as serviceName (analyzed), another as svc. The discovery path itself is non-deterministic: _mapping returns nested JSON of varying depth, and field values can only be enumerated through aggregation queries that themselves depend on knowing the field type up front. Two indices with the same conceptual data can require materially different agent logic.
Loki's situation is similar. Label naming varies by how each collection agent was configured, one stream may use service_name, another app, another job. And the discovery surface is so thin (labels only) that the agent has no reliable way to learn what's inside the log lines themselves.
Aspect | Bronto | Elasticsearch/Lucene | Loki |
|---|---|---|---|
Discovery workflow | Same 3 calls for any dataset |
| Labels-only |
Field types | Consistent within a dataset | Varies by mapping | N/A |
Query behavior | Predictable | Depends on analyzers | Depends on labels |
Cross-dataset patterns | Discover then query — works for any source | Per-index logic likely needed | Per-stream logic likely needed |
The deterministic property the agent relies on is not "every dataset has the same fields". That would never be true in a real environment. It's "the way I find out what fields exist is always the same." Bronto provides that. Elasticsearch/Lucene and Loki do not.
What each platform was built for
Each of these platforms reflects the use case it was designed for, and none of them, except Bronto, were designed with AI agents in mind.
Elasticsearch/Lucene was built around a human at a dashboard. The Query DSL is JSON because it was meant to be assembled by Kibana on behalf of an analyst clicking through visualisations. Relevance scoring, analyzed fields, and multi-field mappings all serve a workflow where a person narrows by time and service, then reads results visually. That workflow still works well. Hand the same API to an agent, though, and the assumptions invert: silent case-sensitivity, mapping-dependent matching, and relevance ranking that buries rare events become the failure modes covered above.
Grafana Loki was built around a single bet on cost. Index only labels, store everything else as opaque log lines, charge less than indexed alternatives. That made sense for high-volume infra logs that engineers occasionally grepped. The same minimalism that keeps Loki cheap keeps it opaque to an agent that needs to discover fields, correlate by trace ID, or filter on high-cardinality attributes, there's no index for it to reason against. The cost argument has weakened independently: Loki Cloud lists $0.50/GB ingested versus Bronto's $0.10/GB, so at managed-service scale Bronto is 5× cheaper and materially better for AI investigation.
Bronto was built for AI agent investigation from the ground up. Discovery as a first-class workflow, case-insensitive matching by default, dense self-describing JSON responses, deterministic discovery patterns across heterogeneous data sources. These design decisions are direct responses to the failure modes AI agents hit when forced to consume telemetry layers designed for previous eras.
For autonomous AI-driven incident investigation:
Factor | Weight | Bronto | Elasticsearch/Lucene | Loki |
|---|---|---|---|---|
Silent failure risk | 30% | 9/10 | 4/10 | 5/10 |
Data discovery | 25% | 10/10 | 5/10 | 4/10 |
Response completeness | 20% | 10/10 | 7/10 | 3/10 |
Deterministic behavior | 15% | 9/10 | 5/10 | 5/10 |
Query simplicity | 10% | 9/10 | 6/10 | 7/10 |
Weighted total | 9.4/10 | 5.3/10 | 4.6/10 |
Connecting Bronto to AWS DevOps Agent is straightforward: deploy Bronto's hosted MCP server, route your telemetry to it, and authorise the agent. Both are built on the same open standards, so it works the first time, with no custom skills or pre-configuration.
See it in action
We recorded AWS DevOps Agent running a live incident investigation against Bronto — no pre-configuration, no custom skills, just the hosted MCP server connected and pointed at the OpenTelemetry demo.
The investigation completed in under a minute. Once the investigation started, the agent generated its investigation plan within eight seconds using Bronto's MCP server. Within sixty seconds, it had queried Bronto, identified that the ad service was experiencing a high error rate, followed the statement IDs to the specific log lines causing failures, and surfaced the symptom: ads were failing to load. After further analysis — scanning the full codebase and correlating what Bronto's logs revealed — the agent returned its root cause: the adFailure feature flag was controlled entirely by an external flagd service. From alert to root cause, with the data layer doing exactly what it was designed to do.
That's what happens when the telemetry layer is built for the agent, not adapted for it after the fact.
Enjoyed this post?
Share it with your team or network.
Try Bronto free for 14 days
Centralize your agent and infrastructure telemetry in one platform with sub-second search and 12-month hot retention.
- 14-day free trial
- No credit card
- Set up in minutes