CDN log analytics: a guide to full-fidelity Fastly and Cloudflare logging
The metrics that matter for CDN operations all depend on raw, per-request log rows. Here's why pre-aggregated dashboards fall short and what full-fidelity analytics unlock.
What you'll learn in this guide
- Why meaningful CDN metrics — byte hit ratio, P95/P99 TTFB, edge vs. origin errors, ASN composition — all depend on raw, per-request log rows, and where pre-aggregated dashboards fall short
- How the main backend options compare on the dimensions that matter for CDN-scale workloads: raw fidelity, retention, query latency, cardinality support, and cost
- What 12 months of hot, unsampled retention actually unlocks operationally, from cache policy validation to security forensics
The data's gutted before you even open the dashboard
You already know the metrics that matter for CDN operations: byte hit ratio tracked separately from request hit ratio, TTFB and TTLB at P95 and P99, edge errors isolated from origin errors, cache miss rates broken down by URL path rather than rolled up globally, ASN composition as a bot signal.
Every senior SRE knows they should be tracking these metrics but because of economics, rather than engineering judgement, many aren't. Computing these metrics correctly requires raw, per-request log rows with full field fidelity. The moment you aggregate, you lose the context that makes root-cause analysis possible.
So teams make the only rational choice their cost model allows: sample at 10%, shorten retention to 14 days, pre-aggregate to summaries and drop the raw rows. The pipeline is "optimised" but the data is gutted. When something breaks at 3am, you're debugging from crumbs.
Default CDN dashboards are built for a health check, not a postmortem
CDN vendor analytics UIs are designed to answer one question: is the system broadly healthy right now? For that use case, aggregation is fine. A global cache hit ratio, a flat request rate graph, an error percentage — these are reasonable quick-health signals.
They fall apart the moment you need to answer a real question.
Meaningful CDN analytics requires slicing by URL path, ASN, PoP, cache status, user agent, and error code simultaneously — high-cardinality dimensions that traditional monitoring platforms either cap, pre-aggregate, or discard entirely.
The same applies to latency. Average TTFB smooths over regional outliers and hides the difference between connection establishment latency (a network/TLS problem) and origin fetch latency (a backend problem). You need P95 and P99, segmented by cache status and PoP. That requires raw rows.
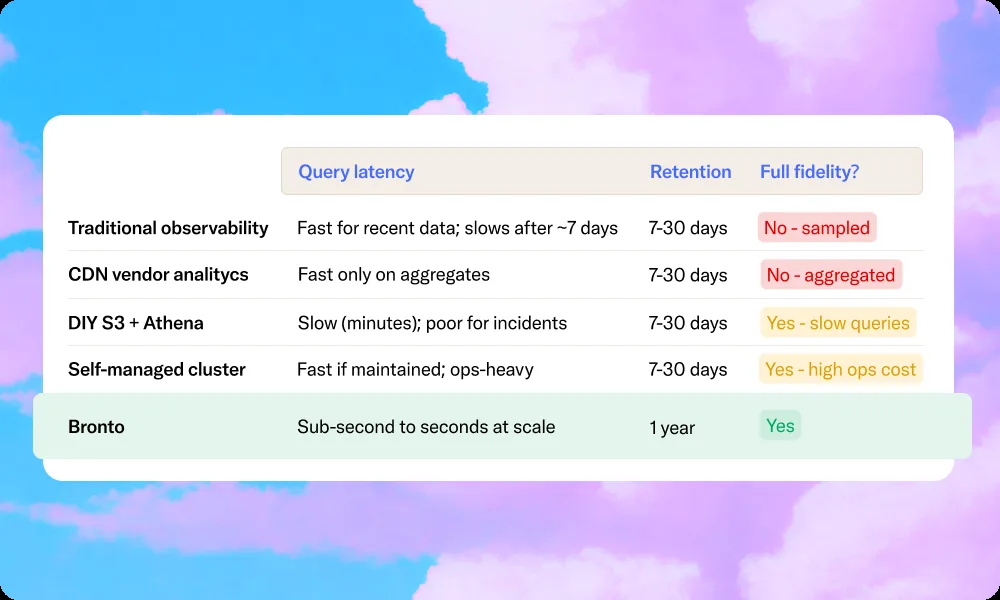
CDN log backend options
| Dimension | CDN Native | Traditional | DIY Storage | Bronto |
|---|---|---|---|---|
| Raw log fidelity | Pre-aggregated; no per-request rows | Full but often sampled | Full; unlimited storage | Full; no sampling, ever |
| Retention | 7–30 days | 7–30 days practical | Unlimited | 12 months hot |
| Query latency | Fast on aggregates | Slow on long lookbacks | Minutes | Sub-second |
| High-cardinality support | Limited | Degrades at scale | Partitioning required | Petabyte-scale support |
| Multi-CDN correlation | Per-provider only | Complex setup | Custom ETL | Native filtering |
| Operational overhead | None | Low | Medium | Low |
| Cost at CDN volume | Included | High | Variable | 50–90% less |
How Bronto solves this
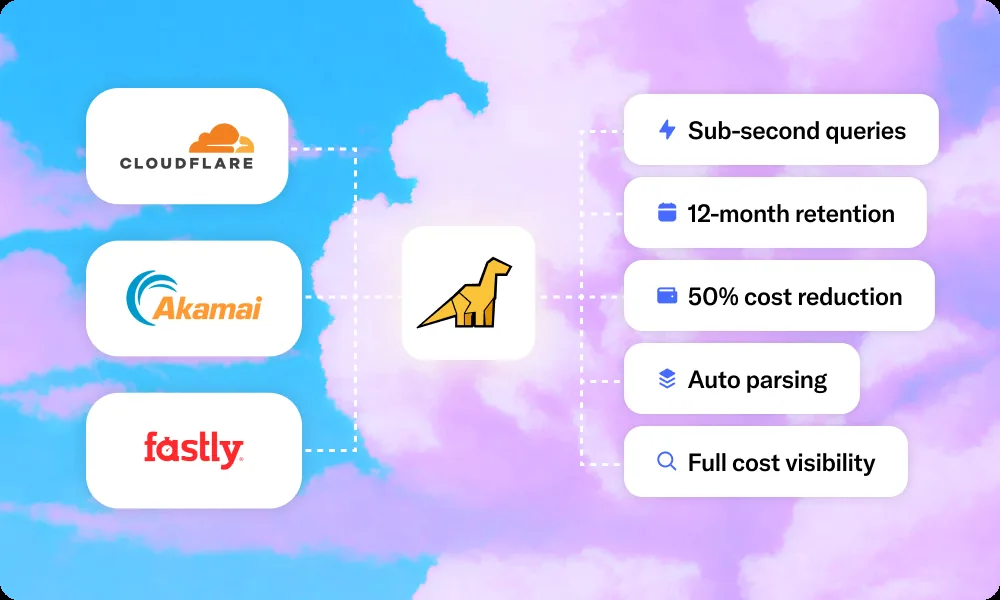
The core problem is economic, not architectural. Ingestion-only pricing, Bloom filter indexing on object storage, and compute/storage separation change the constraint: 12 months of unsampled CDN logs at sub-second query latency is our default tier, not a premium add-on.
Bronto's Bloom filter indexing lets the query engine skip data blocks that contain no matching rows, without the storage and maintenance cost of full inverted indexes. For CDN log queries scoped by time range and filtered on cache_status, edge_location, response_status, or URL prefix, this is highly effective. For multi-CDN estates, Bronto's namespace and metadata tagging model means Fastly and Cloudflare logs land in a single query layer with consistent field mapping.
Getting Fastly and Cloudflare logs into Bronto. Both providers have mature, documented log delivery mechanisms. The integration is on the receiving side — Bronto requires minimal configuration, and if you're already forwarding CDN logs through Fluent Bit, Vector, or an OTel Collector, Bronto is just another destination.
What 12 months hot retention actually unlocks
With 7–14 day retention windows — the practical ceiling on most legacy platforms at CDN volume — you can debug active incidents. With 12 months of unsampled data, the operational surface expands significantly:
- Cache policy validation over time: Did the TTL change you shipped in Q2 actually improve byte hit ratio across all PoPs, or just the clusters you were watching?
- Seasonal capacity planning from real edge data: Actual PoP-level request distribution and bandwidth curves from the equivalent period last year — not extrapolated estimates.
- Security forensics without a deadline: When a threat intel feed surfaces an IP involved in a campaign that started six weeks ago, the raw request history is still there.
- Per-customer SLA reporting: For platforms routing API traffic through CDN with a unique key per tenant, correlating edge latency and error rates by customer over months becomes a standard query.
- Multi-CDN performance comparison on production traffic: With Fastly and Cloudflare normalised in a single query layer, cross-provider analysis is a filter condition, not a join.
ContentStack: from 30-minute timeouts to real-time CDN analysis
ContentStack runs a content delivery and experience platform, serving APIs behind a global CDN for third-party websites, mobile apps, and e-commerce systems. Every request hits their API with a unique key.
Before Bronto: a 2-week retention window, queries that timed out after 30 minutes, and dashboards that often failed. Entire analysis categories simply weren't viable.
After migrating their CDN log pipeline to Bronto:
- With Bronto querying 1TB of log data in ~25ms, 100 TB queries can be processed in as quick as 2.5 seconds
- Large queries (1–5TB) filtering for rare events like specific HTTP error codes return in under 900ms
- Multi-terabyte queries with heavy aggregation complete in around 4 seconds
- Their logging bill was cut in half while adding more CDN workloads to Bronto
- Built reliable customer-facing log exports that required more historical depth than their previous pipeline could hold
"It's a night and day difference to our previous logging provider. Bronto typically returns results in seconds, while our old vendor took over 30 minutes and frequently failed to render visualisations."
Jaymin Patel, Team Lead, ContentStack
Specific CDN metrics you should be tracking
Each of the following requires raw per-request log data to compute correctly and breaks when derived from pre-aggregated sources.
Byte hit ratio vs. request hit ratio — track both, separately
Request hit ratio measures performance. Byte hit ratio measures cost efficiency. A site serving mostly small assets with one large uncached binary can have a 99% request hit ratio and a 40% byte hit ratio. You need response_body_size and origin_fetch_bytes on every raw request row to compute it correctly.
TTFB vs. TTLB, at percentiles, segmented by cache status
Average latency is noise. You need P95 and P99, computed separately for cache hits and misses, and ideally by PoP. Fast TTFB with slow TTLB is a throughput problem after the edge. Slow TTFB on a miss is origin latency.
Edge errors vs. origin errors
A 5xx spike could be the edge failing independently or the CDN faithfully forwarding an origin that's struggling. Aggregated "error rate" metrics conflate them and leave you debugging the wrong layer.
ASN composition as a bot signal
Real users don't browse from AWS or GCP address space. Tracking the percentage of requests by ASN type — residential ISP vs. datacenter vs. cloud hosting — against your baseline is one of the clearest early signals of automated traffic shifts.
High-cardinality cache miss analysis by URL path
When your cache hit ratio drops, you need to know which specific URL patterns are missing. Cardinality-capped monitoring platforms either truncate the URL dimension or aggregate it away. You need the full path distribution to identify whether it's a new content type, a query string variability problem, or a cache invalidation job running too aggressively.
CDN analytics is only as good as the data under it
If your answers include "we don't have that far back," "we sampled that period down," or "those queries time out": the constraint is upstream of the dashboard. No query layer fixes incomplete data.
Start a Free Trial of Bronto
Try Bronto for free for 14 days and see how it handles your logs at any volume, with no query fees and sub-second search.
Start a Free Trial of Bronto →More articles
Centralizing CDN logs: a guide to high-volume log management
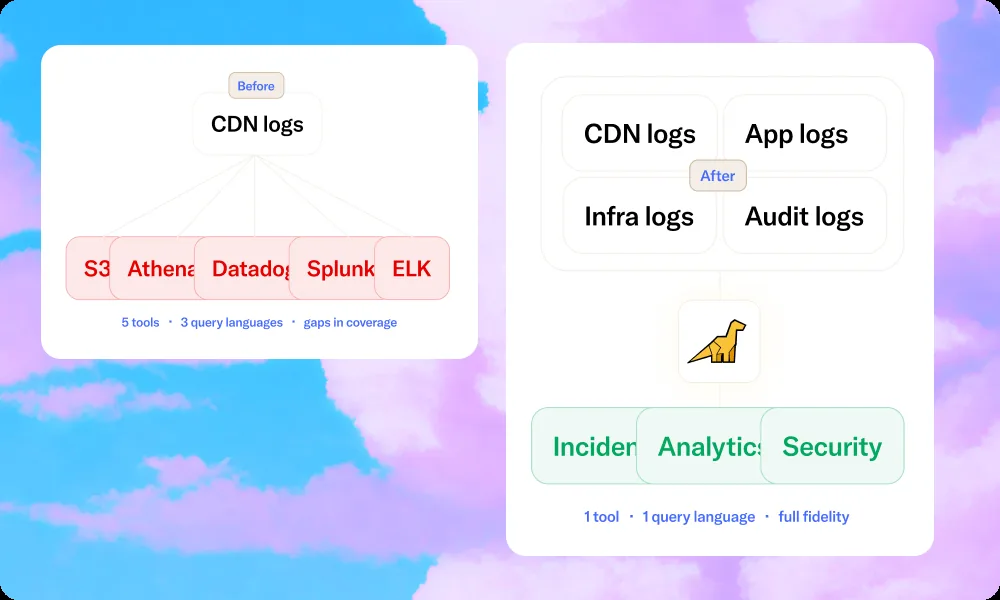
The CDN observability consolidation guide: replace 5–8 tools with one logging layer