The CDN observability consolidation guide: replace 5–8 tools with one logging layer
Most CDN observability stacks accumulated as a series of individually rational decisions, each forced by the cost model of the last platform. Here's how to consolidate them.
What you'll learn in this guide
- Why CDN observability sprawls into 5–8 tools, and why it's a consequence of legacy pricing, not an engineering choice
- What the incident scavenger hunt actually costs you when your data is fragmented across S3, a hot log tool, and a dashboard that won't render
- How to compare your consolidation options on retention, query latency, operational overhead, and total cost at CDN volume
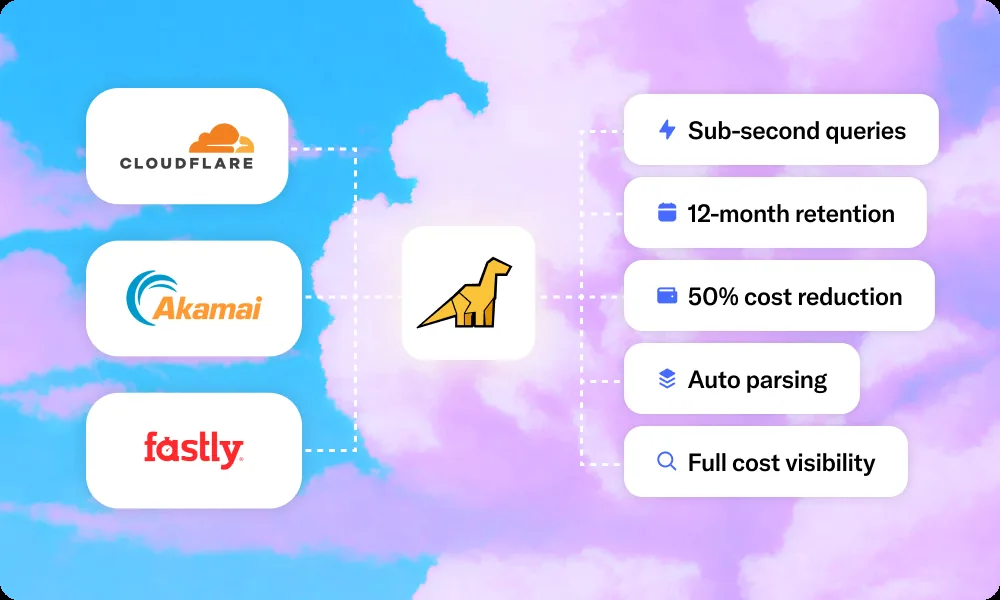
- What changes operationally when your CDN logs live in a single queryable layer with 12 months of instant-access history
You didn't choose the hodgepodge. The economics built it for you.
Most platform engineers and SREs didn't set out to manage five different logging tools. The sprawl accumulated as a series of individually rational decisions, each one forced by the cost model of the last platform.
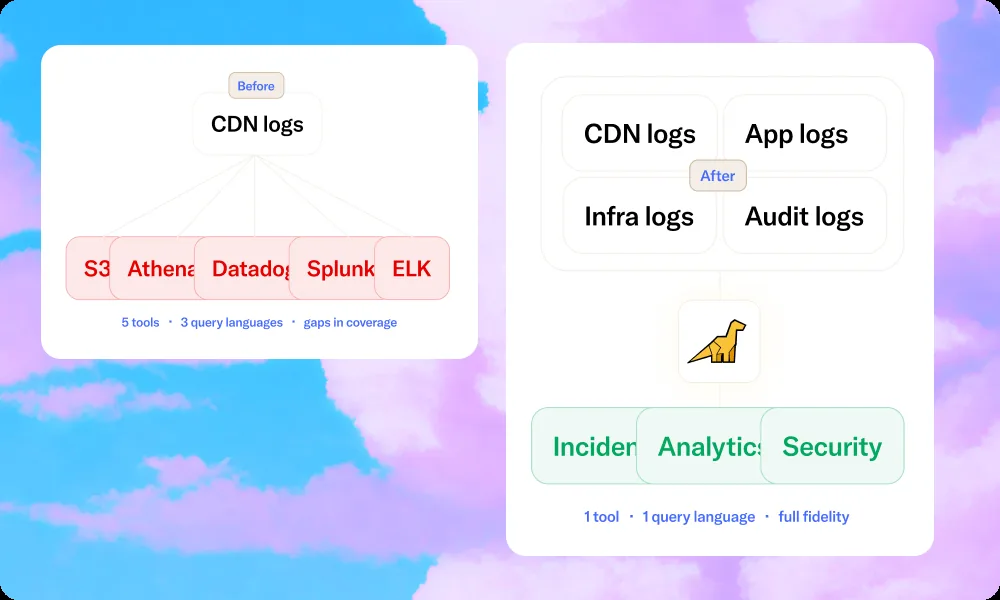
The pattern is consistent enough to be predictable: CDN logs flow into S3 because long-term storage there is cheap. You add Athena for ad hoc queries because you need something that can query that S3 data. You keep a slice of hot logs in Datadog or a similar platform for real-time dashboards — but you cap the volume tightly because the per-GB pricing makes full-fidelity CDN ingestion financially untenable. You end up with a security or compliance requirement that doesn't fit any of the above, so a legacy Splunk instance or ELK cluster gets bolted on.
By the time you're done, you have six tools, five different retention policies, three query languages, and an observability stack that works adequately in steady state but fails when you need it most.
This is the flywheel of compromises. High costs force reduced coverage. Reduced coverage creates gaps. Gaps get papered over with additional tools. Additional tools add complexity and operational overhead. The complexity makes the whole system more expensive to run. Which means the next coverage decision gets made under the same cost pressure.
The real cost of fragmented data: the incident scavenger hunt
The real cost of tool sprawl isn't the licensing. It's the MTTR tax — the time you lose during an active incident because your data is distributed across systems that don't talk to each other, each with different retention windows and query latencies.
The incident scavenger hunt: what a P0 looks like with fragmented data
It's 2am. Cache miss spike on your primary CDN. Origin is struggling. Here's what the next 30 minutes look like:
- Check the dashboard — it lacks the field-level detail to identify the affected URL paths or PoPs. Shows "elevated errors." Not actionable.
- Run a query in your hot log tool — it times out after 15 minutes because you're querying three weeks of data and your retention window is two weeks. Partial results.
- Try Athena against S3 — partition scans take several minutes per query. You iterate three times to narrow the time range. You're now 40 minutes in.
- Realise the root cause field — the specific Cache-Control header class driving misses — was dropped three months ago to cut ingestion costs.
This is the standard incident workflow for teams running a classic CDN observability stack. The problem isn't the tools individually — it's that raw, full-fidelity, fully-retained logs in a single queryable layer, which would let you actually answer the question, are prohibitively expensive.
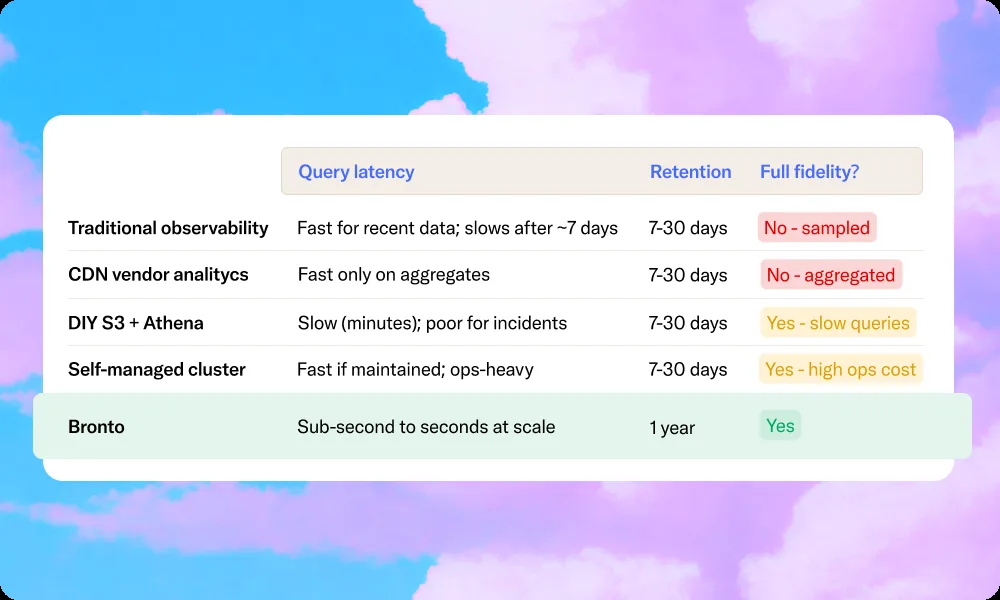
Consolidation options: what each approach actually delivers
| Setup | Retention ceiling | Incident query latency | Operational overhead | Full fidelity? |
|---|---|---|---|---|
| Classic hodgepodge (S3 + Athena + Datadog + ELK + native dashboards) | 7–14 days hot; archive theoretically unlimited but effectively inaccessible | Minutes to hours; tool-switching adds to MTTR | High — each tool has its own agent, config, cost model | No — cost forces sampling and field-dropping |
| Single premium platform (Datadog, Splunk class) | 30 days typical; 90+ days only with significant cost increase | Fast in hot window; sampled data limits root-cause depth | Low ops overhead; high and unpredictable per-GB cost at CDN volume | No — sampling is the economic response to per-GB pricing |
| Self-managed cluster (ClickHouse, Elastic) | Tied to cluster capacity; you own cost and scaling decisions | Fast when tuned; degrades without ongoing index maintenance | Very high — cluster ops, sharding, upgrades, capacity planning | Yes — but fidelity depends on engineering investment |
| Bronto | 12 months hot by default; no rehydration | Sub-second on terabytes; seconds on petabytes | Low — schema-agnostic ingestion; no parsers or index maintenance | Yes — extremely low TCO removes the economic incentive to sample |
A note on the single premium platform path: consolidating into Datadog, Splunk, or a comparable platform solves the operational complexity. The problem is that dollars-per-GB pricing at CDN volume still forces the same economic compromises. You end up with one tool instead of five, but you're still sampling, still shortening retention, still making coverage tradeoffs to stay within budget.
How Bronto eliminates the hodgepodge
Low-cost ingest makes log tiering obsolete
Bronto charges on ingestion only. When you're not paying per GB stored AND per GB queried, there's no reason to split your data across tiers. 12 months of hot retention is the default. No rehydration jobs. No partition scans. The archive tier becomes unnecessary.
Schema-agnostic ingestion
In a fragmented stack, a schema change typically breaks at least one pipeline — Logstash filters, Glue crawlers, field remaps in your hot tool. Bronto ingests logs exactly as they arrive. If you're already running Fluent Bit, Vector, or OTel, Bronto is just another destination.
Sub-second search across all the data
Bloom filter indexing skips data blocks that probably contain no matching rows. Serverless execution scales horizontally on demand — a query over 10TB performs at the same latency as a query over 10GB.
The practical result: during a P0, you run a single query against 12 months of full-fidelity CDN logs and get results in under a second.
From five tools to one: Teamwork.com consolidates
Teamwork.com, a global SaaS project management platform, was running a textbook hodgepodge: Graylog for live logs, S3 for long-term storage, HAProxy logs dumped into S3 with Athena queries, and a mix of Athena, Superset, and QuickSight for analytics. The engineering team was spending significant time maintaining logging infrastructure. The stack was complex enough that operational mistakes regularly caused gaps in coverage.
After consolidating into Bronto:
- Retention extended from 1–2 days to up to 12 months hot retention across all log types
- Dashboards tracking error spikes, traffic anomalies, and application version drift, previously impossible with the fragmented retention they had
- Engineers focused on building product, not maintaining logging infrastructure
- The Graylog instance, S3 logging archive, Athena configuration, Superset dashboards, and QuickSight setup — all decommissioned
"A significant reduction in time to root cause identification, investigating issues from months ago, having logs actually available during incidents, aren't just improvements, they're game-changers. Our SysOps team now get to work on platform innovation instead of keeping Graylog alive."
Aodh O'Mahony, Engineering Manager, Teamwork.com
What changes when your logs are consolidated
The impact of moving from a fragmented stack to a single logging layer goes beyond query latency. It changes what questions engineers ask and how often they ask them.
When an SRE knows a query will return in two seconds rather than twenty minutes, they ask more questions. Investigations get deeper. Hypotheses get tested rather than assumed. Year-over-year analyses become standard rather than aspirational. The whole team's relationship with the data changes.
Start a Free Trial of Bronto
Try Bronto for free for 14 days and see how it handles your logs at any volume, with no query fees and sub-second search.
Start a Free Trial of Bronto →