Logging on AWS: when CloudWatch stops being enough
CloudWatch is the natural starting point for AWS-native logging. But logging infrastructure has a way of quietly becoming a constraint — in cost, in performance, and in coverage.
What you'll learn in this guide
- How CloudWatch's cost model compounds as you scale: ingestion, storage, and query fees growing independently, and why this matters
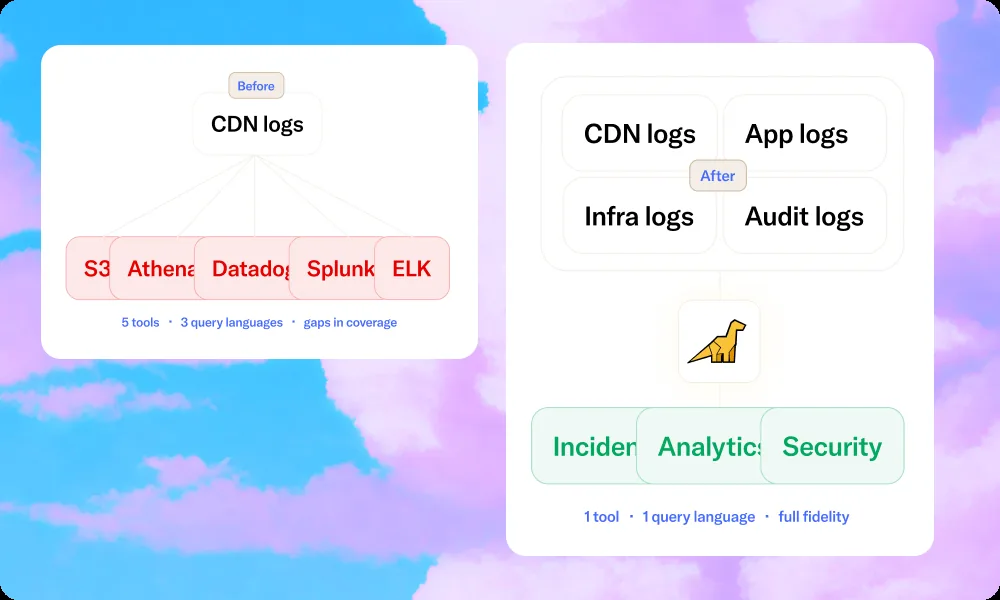
- Why the standard workaround of adding S3 and a query layer creates a two-tier system that fails during the incidents that matter most
- How to diagnose whether CloudWatch is already constraining your team: five operational signals that indicate you've hit the ceiling
- How a purpose-built logging platform eliminates cost unpredictability, cross-service blind spots, and data retrieval friction that native AWS tooling can't solve
CloudWatch is the natural starting point for AWS-native logging. It requires no infrastructure decisions, integrates with Lambda, ECS, EKS, and API Gateway out of the box, and produces usable dashboards without much configuration. For a team running a handful of services at modest volume, it's a reasonable choice.
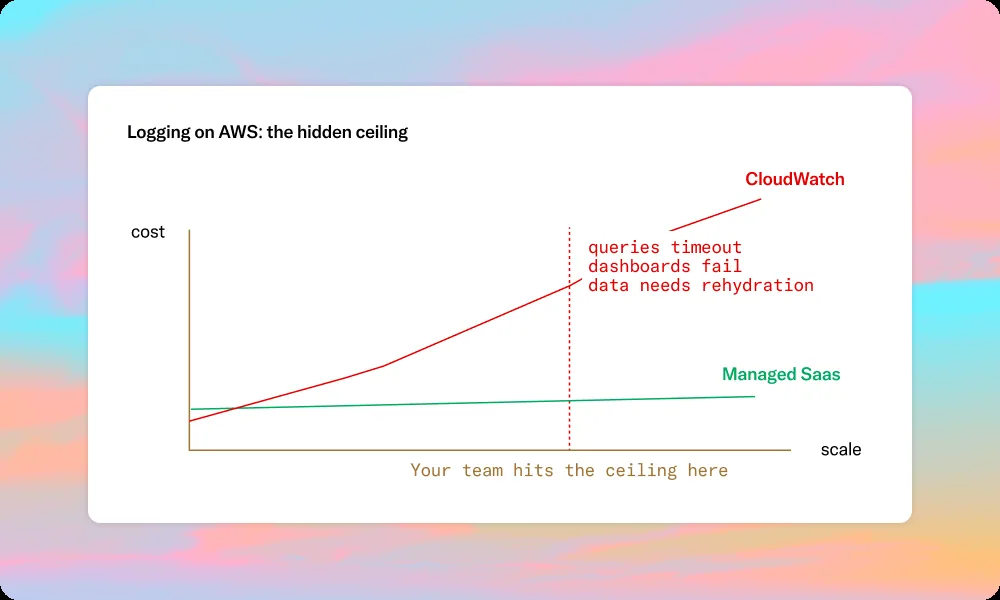
But logging infrastructure has a way of quietly becoming a constraint as your AWS footprint grows. Teams notice it first in cost: a CloudWatch bill that keeps climbing without obvious explanation. Then in performance: Logs Insights queries that don't complete or dashboards that fail to render during incidents. Then in coverage: the realisation that the data you need for a post-mortem either wasn't retained or would cost too much to query in bulk.
This guide covers where CloudWatch starts to create friction, how the native toolchain stacks up across real operational requirements, and what migration looks like when you decide to move.
The cost model compounds in ways that aren't obvious upfront
CloudWatch pricing has three distinct components, each of which can grow independently:
- Ingestion: $0.50/GB for log data ingested into CloudWatch Logs (Lambda logs have tiered pricing starting at the same rate but dropping with volume).
- Storage: charged per GB per month for data retained beyond the free tier (first 5 GB free per account).
- Query execution: Logs Insights charges $0.005 per GB of data scanned per query.
The query cost is where teams are most often surprised. A routine investigation query — for example filtering 30 days of API Gateway logs across three log groups to find a pattern — can easily scan hundreds of gigabytes. In a high-traffic environment, multiply that by the number of engineers running queries during an incident and you'll see why Logs Insights charges can balloon on monthly bills.
Each charge is defensible in isolation. Together they create a cost structure where every operational activity (log shipping, retention, incident investigation) has its own independent cost driver, and none are capped.
Querying across services is harder than it looks
CloudWatch Logs Insights is functional for single-service debugging. It becomes a genuine workflow problem when you need to correlate events across services.
Each query targets one or more log groups, but scoping is additive rather than unified. If your incident spans an ECS service, an API Gateway, and a Lambda function, you're effectively running separate queries and reconciling timestamps manually. There's no global full-text search across your entire AWS environment.
At higher volumes, query performance degrades predictably. As log groups accumulate data, Insights queries over longer time windows become slower. At high volume, queries that worked in Q1 start timing out in Q3. Dashboard failures during incidents are a reliable indicator you've hit a tool ceiling.
Retention is configurable but not the same as hot searchability
CloudWatch technically supports log retention up to 10 years. But query costs scale with the volume scanned. Running a query across 12 months of a busy log group isn't just slow: it's expensive.
Most teams respond by setting shorter retention periods and exporting older data to S3, which then requires a separate query interface (and its own per-query cost) to access. In practice, this creates a two-tier system: recent data in CloudWatch (queryable but costly), older data in S3 (cheap to store, slow and expensive to search). The boundary typically sits somewhere between 30 and 90 days.
The result: year-over-year comparisons, annual trend analysis, and long-tail incident forensics become operationally impractical. Security and compliance teams feel this most acutely.
Multi-account and multi-region setups require significant plumbing
CloudWatch is region-native by design. Each region maintains its own log groups, metrics, and dashboards. For organisations running multi-region workloads, or teams that have grown through acquisition and operate multiple AWS accounts, this creates a consolidation problem.
The standard solution is to forward logs to a central store and query from there. This is architecturally sound but it shifts operational burden to the platform team: someone owns the forwarding configuration, the IAM permissions, the bucket policies, and the query workgroup.
Five signals that you've hit the CloudWatch ceiling
| Signal | What to look for |
|---|---|
| Your Logs Insights spend is growing faster than your engineering headcount | If query costs are climbing independently of team size, you're paying more to investigate the same problems. Any month above $500 in query costs alone warrants a closer look. |
| You have 50+ log groups | Above this threshold, cross-service correlation during incidents becomes practically impractical in the native UI. |
| Your retention settings are inconsistent or missing | If different services have different retention periods (or none set at all), you have uncapped storage growth and likely gaps in coverage. |
| Dashboards fail or degrade during incidents | Dashboard failure at high load is a reliable indicator that you've hit a tool ceiling. |
| Your team reaches for S3 + Athena for anything older than 30 days | The moment you've normalised a two-tier retrieval workflow, you've accepted a permanent operational tax on every investigation. |
Comparing AWS-native logging approaches
| Capability | CloudWatch | S3 + Athena | OpenSearch | Bronto |
|---|---|---|---|---|
| Search latency | Seconds–minutes | Minutes+ | Seconds–minutes | Sub-second |
| Default retention | Indefinite (pay per GB/month) | Unlimited storage, slow retrieval | Unlimited | 12 months hot |
| Cross-service correlation | Per log group | Manual joins | Partial | Unified |
| Rehydration required? | No (but costly) | Yes | Yes (cold tier) | Never |
| Cost model | Per GB + per query | Per GB + Athena | Cluster cost | Ingestion only |
| Operational overhead | Low | High | High | Zero (SaaS) |
| AI-assisted incident investigation | Available via Amazon Q (additional cost) | No | No | BrontoScope: <10 seconds, included |
| PII masking | Yes (data protection policies) | No | Limited | Yes (auto-detect + RBAC) |
| Real-time ingestion | Seconds delay | Minutes delay | Seconds | Seconds (up to 30s under normal conditions) |
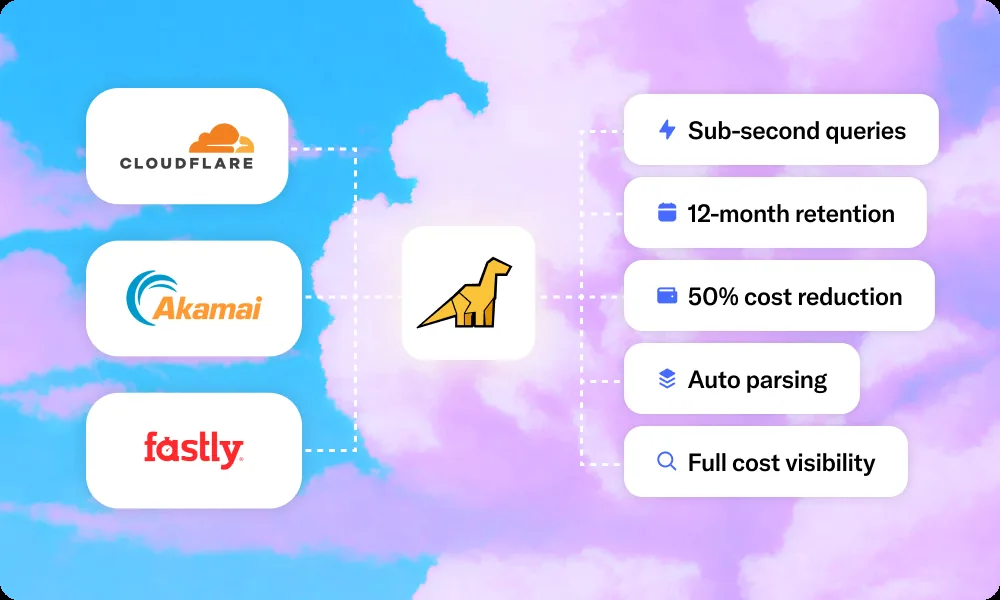
How Bronto solves this
Bronto was built specifically to close the gaps that compound in AWS-native logging setups: cost unpredictability, query performance at volume, and the forced split between hot and cold data.
Predictable cost, no query charges
Bronto charges for ingestion only — no separate storage or query fees, regardless of frequency or data volume. For teams where CloudWatch costs grow faster than usage, this changes the budget conversation entirely.
No two-tier retrieval
All data stays indexed and searchable for 12 months by default. No S3 archival step, no separate query interface, no rehydration wait. Nasuni went from 90-day retention and 15-minute searches to 12 months at sub-second, cutting MTTR by 95%.
Unified search across your log estate
All data lands in a single store, so cross-service correlation — the multi-log-group problem that breaks Logs Insights during incidents — is handled in one query. Structured and unstructured formats parsed automatically.
AI-assisted investigation
BrontoScope runs autonomous incident investigation: it executes queries, synthesises results, and produces a scoped report in under 10 seconds. AI Investigation Reports extend this to your monitoring workflow.
Clean migration path
Bronto supports OpenTelemetry, Fluent Bit, Fluentd, Vector, Datadog Agent, and Logstash, plus a CloudWatch subscription-filter forwarder deployable via Terraform or CloudFormation. Run it in parallel for 2–4 weeks to validate.
Start a Free Trial of Bronto
Try Bronto for free for 14 days and see how it handles your AWS logs at any volume, with no query fees and sub-second search.
Start a Free Trial of Bronto →