The Top 12 Log Management & Observability Tools Best Positioned for the AI Era
A comprehensive guide to the leading observability platforms evaluated for AI readiness — covering MCP support, retention, query performance, pricing, and how each vendor is approaching the agentic era.
What you'll learn in this guide
- How the top 12 observability platforms are positioning for the AI and agentic era
- What to look for in MCP support, data retention, and query performance
- The real trade-offs between legacy incumbents (Datadog, Splunk, Dynatrace) and newer entrants
- How pricing models compound as log volume grows — and what to watch out for
- Why data retention length matters for AI SRE and business intelligence workflows
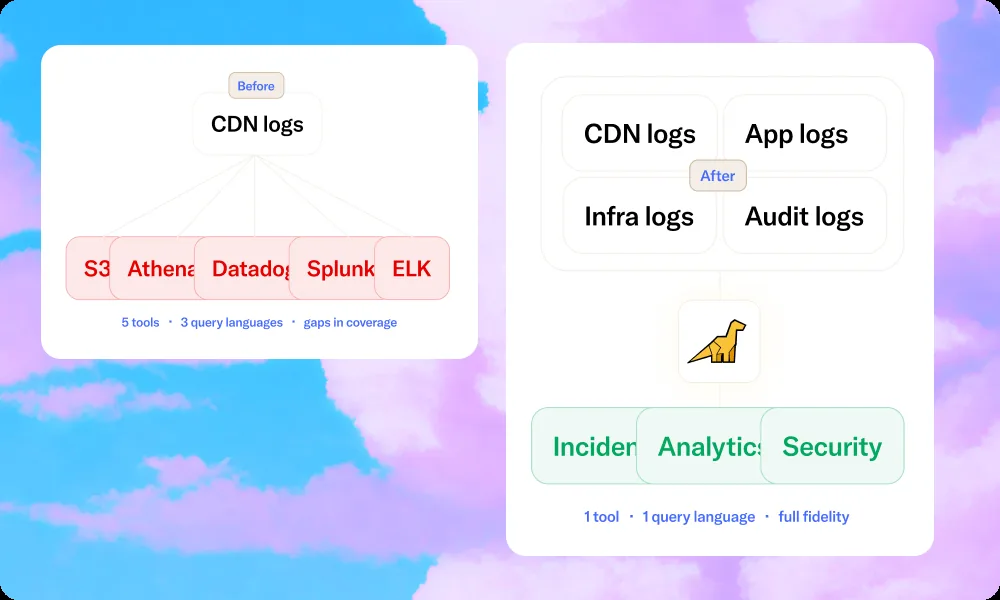
The observability market has matured over the past decade. Companies that were once new entrants are now enterprise incumbents and key feature sets have become standard requirements across tools. Expensive pricing models have forced teams into cost-conscious workarounds and provided the opportunity for new vendors to jump into the market. Organizations are also now avoiding vendor lock-in by standardizing on OpenTelemetry, the open source telemetry framework used across industries.
At the intersection of these trends, SRE teams can now choose from a wider collection of tools that can tackle the same core challenges and move between them more freely.
Now, let's factor in the rise of LLMs and AI-based development. This paradigm shift is changing what teams build, how they work, and what telemetry data they are prioritizing.
Should you choose legacy tools with rich feature-sets and deep ecosystems, or select from upcoming AI-native tools that have been architected for this new environment?
In this guide, we've outlined the top 12 observability tools that we believe are best positioned for the AI era. For each tool, we explore what it does especially well, how it is approaching AI and agent observability, and trade-offs that teams will have to accept.
1. Bronto – Best Value for AI-Native Engineering Teams
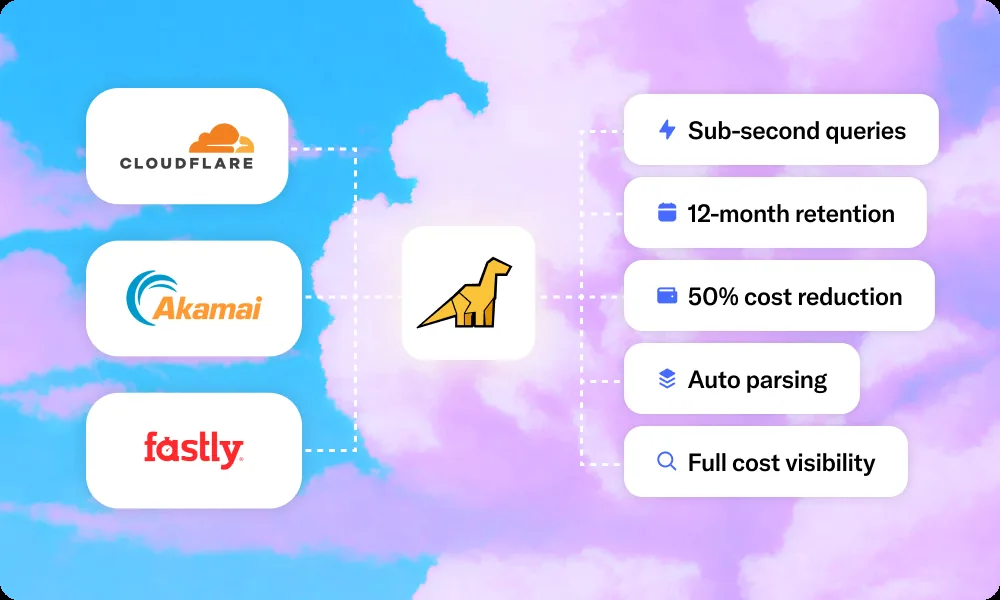
Bronto is an AI-native telemetry datastore designed to address fundamental observability compromises that have been pushed on customers. Built by a team of observability experts, the Bronto platform is designed to ingest high volumes of telemetry data, retain signals for 12-months by default, and run queries across Terabytes (TBs) in less than a second.
With full fidelity data and sub-second search, both engineers and AI agents can use Bronto's datastore to conduct context-rich troubleshooting and analysis. Designed for petabyte scale and MCP-based workflows, Bronto offers teams strong technical foundations to build on.
Bronto's pricing is based on generous ingestion and search tiers, resulting in an industry-low entry point that is up to 100X more cost efficient than traditional tools. For example, the Starter plan is only $25 per month for 1 TB of ingestion, 20 TBs of search, and 12-month retention included.
AI Observability Strategy: Bronto's AI strategy starts at the database layer. Since Bronto has industry-low ingestion costs, teams can store full-fidelity telemetry data for a default of 12 months without archiving and rehydration. With no sampling and no latency from tiered storage, engineers and AI agents can consistently execute fast queries on complete data.
AI SREs, like AWS DevOps Agent, have ranked Bronto first among competitors for how it exposes context-rich logs during investigations. The Bronto MCP server makes it easy to connect agents and LLMs to telemetry data to troubleshoot errors and analyze performance.
Bronto also has AI-based troubleshooting tools built into the platform. Teams can set up Investigation Reports to run when certain monitors are triggered, so a summary report is created with curated information from predefined queries. BrontoScope enables on-demand analysis of errors so on-call engineers can dive into the details faster. All of these capabilities combine to streamline incident response and surface the most meaningful context.
Best fit for: Engineering teams building AI-native applications, using coding agents in their development workflow, or generating especially high logging volume. If consolidating tools and reducing monthly costs is a top priority, Bronto has a track record delivering 50-80% cost reductions for teams while extending their telemetry data fidelity and retention.
Drawbacks: Bronto does not yet carry the breadth of auxiliary features that more established platforms have built up over years (e.g. deep infrastructure monitoring, real user monitoring, synthetics, and security workflows). Instead, Bronto is focused on exposing data and capabilities to work seamlessly with AI agents and vendors. For example, Bronto has created a Lovable project called BrontoVibe, which enables teams to customize their own observability front-end, supported fully by the Bronto API.
2. Datadog – Comprehensive Enterprise Platform
Datadog is one of the most popular Observability platforms for enterprises and large dev organizations. Founded in 2010, Datadog has one of the most comprehensive observability ecosystems in the market with deep integrations and dozens for modular product offerings.
This platform depth is expensive but useful for teams with large SRE teams, varied use cases, and complex tech stacks. Datadog's pricing spans dozens of separate modules, each billed independently. As your environment grows, those dimensions compound in ways that are genuinely difficult to forecast. For teams with dedicated SRE and finance resources to manage it, Datadog's depth justifies the investment. For teams without that infrastructure, it can become a bill to manage rather than a tool to rely on.
AI Observability Strategy: Datadog has the most mature AI observability offering among traditional monitoring incumbents, giving teams more depth than most alternatives today.
Teams monitoring AI agents get full decision-path visibility across inputs, tool invocations, inter-agent calls, and outputs. For teams already on Datadog APM, that data correlates directly with service activity and customer impact in a single view.
Engineering and finance teams get the Agent Console, a spend governance layer that tracks who is using coding agents and maps token usage to engineering output. The catch is pricing: teams pairing Datadog's per-host and per-log model with these AI features face selective coverage and unpredictable billing as usage scales.
Best fit for: Large enterprises that need a single vendor to cover the full observability stack and have the procurement infrastructure and budget to manage a complex, module-based pricing relationship. Teams with existing Datadog APM investments who want to extend into AI agent monitoring without changing platforms.
Drawbacks: Multi-dimensional billing makes costs hard to predict as log volume grows. Log retention defaults to 15 days, with rehydration fees for anything older. AI anomaly detection (Watchdog) requires upgrading to Pro Plus or Enterprise. For teams whose primary focus is logs and traces, the per-module overhead adds cost and configuration complexity that purpose-built platforms avoid entirely.
See how Datadog compares to Bronto: bronto.io/compare/datadog
3. Splunk – Security and Compliance Focus
Splunk built its reputation in security and compliance, and that foundation remains its strongest differentiator. It has deep SIEM capabilities, a mature ecosystem of apps and integrations, and strong support for regulated industries where audit trails and data residency controls are critical.
Splunk delivers a combination of integrated features that are especially compelling for organizations where the security and SRE teams share the same logging pipelines. This breadth comes with a high cost, complexity, and usage-based pricing that can make billing hard to predict across an organization. Splunk's proprietary query languages add to a steep learning curve and encourage vendor lock-in.
AI Observability Strategy: Splunk is extending its existing platform with AI-focused add-ons rather than rebuilding for the agentic era. Teams using Observability Cloud get a new AI Agent Monitoring feature covering performance, quality, token usage, cost, and risk across their AI agents and applications.
Teams managing AI infrastructure can connect to popular vector databases and LLM services through a set of prebuilt integrations, and run evaluations using the open source AGNTCY Metric Compute Engine. Existing Splunk customers may be able to address near-term AI observability needs with these additions, but the bolted-on approach means teams inherit Splunk's underlying pricing model, which could make comprehensive AI observability expensive to scale.
Best fit for: Security-focused organizations in regulated industries that need a unified platform covering SIEM, compliance logging, and operational observability. Teams that have already made Splunk investments may start to adopt their new AI agent monitoring features as long as they can tolerate increasing costs and degraded query performance for high volume logs.
Drawbacks: Hot storage defaults to 90 days, with older logs requiring expensive archive tiers and rehydration before querying. Ingest-based licensing with add-on modules makes costs hard to predict and harder to reduce. For SRE teams whose primary requirement is fast search and analysis of telemetry data, there are plenty of other options in the market that will predictably cost less per month and deliver more reliable query performance.
See how Splunk compares to Bronto: bronto.io/compare/splunk
4. New Relic – Full-Stack APM
New Relic, founded in 2008, covers the full APM stack including application performance, infrastructure, logs, browser monitoring, and synthetics, with distributed tracing throughout.
In recent years, New Relic has become more accessible for teams with usage-based pricing, a free forever tier, and a clean user interface. Like other legacy monitoring tools, New Relic has default logging retention of 30 days, high ingestion costs, and queries that take much longer across TBs of data. New Relic uses a proprietary database which can make it more difficult to extract data and run queries on high volumes without timeouts.
AI Observability Strategy: New Relic's Agentic Platform (launched February 2026, currently in preview) enables teams monitoring AI applications on LangGraph, AutoGen, or Strands to gain automatic full-stack trace visibility across multi-agent workflows all with their existing APM agent.
SRE and ops teams can also use New Relic to deploy no-code prebuilt agents that investigate incidents, correlate signals, and trigger remediation directly within their existing PagerDuty, ServiceNow, and Atlassian workflows.
They recently also announced New Relic Knowledge, an intelligence layer that surfaces real-time system context to sharpen automated actions and speed up investigations.
Best fit for: SRE and platform engineering teams running distributed systems that need unified APM, infrastructure, logs, and traces without per-host or per-module pricing. With consumption-based and seat-based pricing, New Relic fits well for organizations with centralized observability managed by engineers who can closely track ingestion usage.
Drawbacks: While New Relic billing is more predictable than Datadog, it is still a multi-dimensional model with usage spikes that can lead to sticker shock. Users have reported that query performance starts to degrade on large datasets, which is especially constrained due to New Relic's proprietary storage model. Data retention is also short-term with logs stored for 30 days by default and traces stored for only 7 days. This limited retention, paired with sampled logs, really limits the potential of troubleshooting and performance analysis by engineers and AI agents.
See how New Relic compares to Bronto: bronto.io/compare/new-relic
5. Grafana Loki – Self-Hosted Option
Grafana Loki is the logging layer of the LGTM stack (Loki, Grafana, Tempo, Mimir), designed to minimize storage costs by indexing only metadata rather than full log content. Loki is a logical extension for teams already running Grafana for metrics and dashboards.
Self-hosting Loki requires Ops work to manage object storage, optimize query performance, and configure retention policies. Teams running high-cardinality environments will also encounter slower and more expensive full-text search compared to index-first tools like Elasticsearch or Splunk, since Loki's indexing model requires scanning log streams rather than querying a pre-built index.
AI Observability Strategy: Grafana's AI observability capabilities are newer than most incumbents on this list, with the majority announced at GrafanaCON in April 2026.
Teams monitoring LLM-powered applications now get visibility into agent behavior, inputs, outputs, execution flows, and output quality evaluation, with alerting for policy violations and anomalous usage patterns. A prebuilt Anthropic integration shows Claude usage and costs with dashboard templates.
Engineering teams can connect their metrics, logs, and traces to coding agents and LLMs by using GCX, a new CLI tool, or the Grafana MCP server. Grafana also released o11y-bench, an open source benchmark for evaluating AI agents running observability workflows.
Best fit for: Engineering teams already running Grafana for metrics and dashboards who want to add log management without replacing their existing setup. Teams with dedicated platform engineering resources who are comfortable operating their own infrastructure and prioritize open standards and open source licensing over managed SaaS convenience.
Drawbacks: Loki indexes only 15 labels per series and does not index log line content, which creates hard limits in high-cardinality environments. Query latency increases with stream count and data volume, making it slower than full-text search platforms for large-scale log investigations. Grafana Cloud retention defaults to 30 days with extensions sold in 30-day increments. Teams that outgrow Loki's cardinality limits or need full-text search will face significant re-architecture work to migrate to a different platform.
See how Grafana Loki compares to Bronto: bronto.io/compare/grafana-loki
6. Sumo Logic – AWS-Native with Security Focus
Sumo Logic is a cloud-native log management platform with a strong focus on security operations alongside observability. Its library of prebuilt content includes dashboards, alert rules, and parsers for AWS services, compliance frameworks like PCI DSS and SOC 2, and common security workflows. With a credit-based pricing model, teams have the flexibility to allocate their usage across logs, metrics, traces, and storage depending on their priorities.
AI Observability Strategy: Sumo Logic's AI capabilities are built around its Dojo AI platform, a multi-agent framework that spans both security and observability workflows. In practice, the majority of Dojo AI development has focused on security operations, with observability playing a secondary role.
Teams using Sumo Logic for observability can use a Query Agent that converts natural language into searches and a Knowledge Agent that answers questions about the platform using official documentation. An MCP server connects Dojo AI to external AI tools and third-party copilots.
Best fit for: Security and compliance-focused teams running primarily on AWS that want unified SIEM and observability in one platform, with prebuilt content for common compliance frameworks and AWS service integrations available out of the box.
Drawbacks: G2 reviewers often mention platform performance as a limitation, particularly queries on large datasets and long time ranges. Log parsing for custom or non-standard schemas still requires manual Grok and regex configuration. The credit-based pricing model spreads billing across logs, metrics, traces, and storage at different rates, which makes costs difficult to forecast accurately month over month.
See how Sumo Logic compares to Bronto: bronto.io/compare/sumo-logic
7. Elastic (ELK Stack) – Self-Hosted
The Elasticsearch, Kibana, Logstash (ELK) Stack is one of the most capable and flexible logging options available. Full-text indexing across every log field means you can query anything without planning your schema in advance. The Elastic ecosystem comes with thousands of integrations, a mature Kibana visualization layer, and a large community of engineers who know how to operate it.
ELK gives teams maximum control over their observability infrastructure, at the cost of ongoing engineering overhead for cluster configuration, index lifecycle management, and pipeline maintenance that never fully goes away.
AI Observability Strategy: Elastic's AI observability strategy is primarily about adding LLM telemetry functionality on top of its search-powered data platform.
For example, there are prebuilt dashboards for Azure AI Foundry, OpenAI, Amazon Bedrock, and Google Vertex AI that cover invocation counts, error rates, latency, and token usage. Teams can trace the full execution path of LangChain requests, failed LLM calls, and agentic workflows to isolate bottlenecks and errors.
Elastic creates service mapping based on Knowledge Indicators from telemetry data (e.g. entities, dependencies, live state, and context). That mapping is available in Kibana for SRE teams, via an MCP server and CLI.
If you're self-hosting the ELK stack, you should model the total cost of ownership as Elasticsearch clusters can be resource-intensive to operate at scale.
Best fit for: Teams with dedicated platform engineering resources who want maximum flexibility in how they store, index, and query log data across complex, multi-source logging environments, and prefer open standards over managed SaaS platforms.
Drawbacks: Elastic recommends 5 to 7 days of hot data retention for optimal performance, and extending that window means investing heavily in cluster tuning and hardware. Kibana dashboards are hand-built, adding setup time compared to platforms with AI-suggested or auto-generated dashboards. Tracing requires APM as a separate configuration step. The total cost of ownership, once engineering time is factored in, is often higher than it appears at the outset.
See how Elastic compares to Bronto: bronto.io/compare/elastic
8. Logz.io – Managed ELK
Logz.io wraps the Elasticsearch stack in a managed SaaS layer, giving teams the familiarity of Kibana and Lucene queries without having to configure and maintain their own clusters.
For teams already running ELK who want to offload infrastructure management without rebuilding dashboards or relearning query syntax, it is a direct migration path. OrionIQ, its agentic observability platform, is included across all plans at no additional charge.
The core limitation is retention and cost. At $0.92 per GB with only 7 days of default hot retention, Logz.io is one of the more expensive options on this list relative to the retention window it provides out of the box.
AI Observability Strategy: Logz.io's AI strategy centers on OrionIQ, an agentic observability platform launched in April 2026 that uses AI agents to investigate incidents, identify root causes, and take action across systems automatically.
Teams can set up AI agents that trigger the moment an alert fires; analyzing telemetry, surfacing root cause summaries, and sending findings to Slack or Microsoft Teams before an engineer has to manually dig in. The platform exposes machine-readable schemas alongside every dashboard panel so agents can create charts, interpret anomalies, and modify dashboards autonomously.
The Logz.io MCP server can be used to expose logs, metrics, dashboards, and alerts in real time to any coding agent or LLM.
Best fit for: Teams migrating away from self-managed ELK who want to preserve their existing Kibana dashboards, Lucene query skills, and log pipelines without taking on the operational overhead of running their own clusters.
Drawbacks: Default hot retention is 7 days for logs and 10 days for traces with no extension option, which limits the historical context available for root cause analysis. Ingestion pricing at $0.92 per GB is among the highest in the category. Query performance degrades on large or long time-range datasets, which is a meaningful limitation when speed matters most.
See how Logz.io compares to Bronto: bronto.io/compare/logz-io
9. AWS CloudWatch – AWS-Native
CloudWatch is a popular observability layer for teams running on AWS because it's enabled by default and collects basic metrics automatically. For teams that want to invest primarily in the AWS ecosystem, CloudWatch offers engineers the convenience of being able to configure both their infrastructure and monitoring agents within the same platform.
This all-in-one convenience also comes with tradeoffs for teams as they scale logging volumes and extend to tech stacks beyond the AWS ecosystem. Unlike cloud-agnostic observability tools, relying solely on CloudWatch can leave teams with visibility gaps.
Ingestion costs are also relatively higher compared to other logging tools, at $0.50 per GB ingested and $0.03 per GB per month for storage. This pricing model compounds quickly and pushes teams towards adopting short-term retention defaults.
AI Observability Strategy: CloudWatch's AI observability capabilities are tightly coupled to the AWS ecosystem.
For example, teams building AI applications on AWS can view latency, token usage, error, and performance monitoring across model invocations and agent operations, with default support for Bedrock AgentCore, Strands, LangChain, and LangGraph.
CloudWatch Investigations are available to teams as AI-powered root cause workflows based on how AWS engineering teams handle incidents internally. Engineers can also use the CloudWatch MCP server and Application Signals MCP server to incorporate their metrics, alarms, logs, and traces into agentic workflows.
If you are running workloads outside of AWS, CloudWatch won't be able to provide comprehensive visibility.
Best fit for: Engineering teams whose infrastructure is primarily or entirely on AWS, especially those building AI applications on Amazon Bedrock. Organizations that want to get started with observability quickly without adding a new vendor relationship.
Drawbacks: Ingestion costs at $0.50 per GB and separate storage billing make costs difficult to predict as log volume grows. Tracing requires a separate configuration step through X-Ray or ADOT. For teams ingesting logs from multiple clouds, on-premise infrastructure, or non-AWS services, CloudWatch's AWS-centric architecture creates blind spots that require additional tooling to address.
See how AWS CloudWatch compares to Bronto: bronto.io/compare/aws-cloudwatch
10. Dash0 – OpenTelemetry-Native
Dash0 is one of the newest entrants on this list, founded in 2023 by the team behind Instana. Their platform is built entirely on open standards: OpenTelemetry for data collection, PromQL for metrics queries, and Perses for dashboards. This setup makes the platform ideal for teams that have already instrumented OTel collectors across their systems.
For teams that still have non-OTel logs, setting up monitoring with Dash0 would first require routing those logs through an OTel collector as a translation layer.
AI Observability Strategy: Dash0's AI strategy centers on Agent0, which it just launched in June, 2026. With this new feature, teams get an agent that continuously scans their environment, correlates signals across logs, traces, metrics, and deployments, and generates fixes as pull requests routed directly into their existing review workflow rather than surfacing recommendations for engineers to act on manually.
LLM and agent observability is handled natively through OpenTelemetry's GenAI conventions, meaning every LLM call, prompt trace, and agent session flows through the same pipeline as the rest of the stack. The Dash0 MCP server exposes logs, traces, and metrics to any connected LLM or coding agent.
Best fit for: Teams standardizing on OpenTelemetry who want a managed platform built entirely on open standards, and are comfortable with a platform that is still maturing in exchange for long-term instrumentation portability and vendor neutrality.
Drawbacks: Dash0 has default retention for spans, logs, and web events of 30 days, which limits historical root cause analysis compared to platforms with longer included retention. The platform feature set, while growing quickly, is not yet as broad as more established enterprise platforms. SaaS-only deployment means teams with strict data residency requirements will need to evaluate alternatives.
11. Coralogix – Security and Compliance Focus
Coralogix, founded in 2014, is a full-stack observability solution for mid-market and enterprise teams prioritizing cost and compliance requirements.
Most observability platforms ingest logs, index them into a search database, and then run queries and alerts against that index. Coralogix is unique in that it runs analysis on the data stream itself before deciding what to store, which enables a more cost-efficient tiered storage system. To run queries across storage tiers, engineers have to learn the DataPrime query language that Coralogix developed for their platform.
AI Observability Strategy: Coralogix's AI strategy centers on Olly, a multi-agent platform built into the product that investigates incidents across logs, metrics, traces, and alerts. Engineers can prompt Olly in natural language and can connect to a GitHub repository for code-aware root cause analysis.
Coralogix also offers an AI Center for tracking multi-step trace trees across non-deterministic agent execution paths, including inter-agent handoffs and tool call sequences. This approach helps catch silent failures where an agent remains unaware of an error.
Teams can also use Coralogix's MCP server and CLI to connect external AI agents and coding tools directly to their telemetry data for automated investigation workflows.
Best fit for: Security and compliance teams that need long-term log retention at lower cost than index-first platforms, with unified SIEM and observability in one platform. Mid-market and enterprise teams migrating away from Datadog or Splunk who want to reduce costs without sacrificing retention or query performance.
Drawbacks: Coralogix's tiered pipeline model (Frequent Search, Monitoring, Compliance) adds configuration complexity that requires upfront decisions about how each log stream will be used. Misrouting data means either overpaying for inexpensive data or losing query speed on data you need fast access to. Data is stored in your own S3 bucket, which gives you ownership but means cloud storage egress costs apply for high-query workloads. SaaS-only with no self-managed option.
12. Dynatrace – Enterprise Incumbent
Dynatrace, founded in 2005, is a full-stack observability platform built for large organizations with complex, software environments. The OneAgent instrumentation layer allows teams to deploy one agent per host to collect telemetry data and monitor users in real-time. Dynatrace automatically correlates logs, metrics, traces, and topology data to simplify root cause analysis. There are 910 partner plugins in the Dynatrace Hub to support enterprises with diverse integration requirements.
AI Observability Strategy: Dynatrace's AI creates and leverages a real-time map of how your systems depend on each other, which improves the effectiveness of automated root cause analysis. Dynatrace extended this capability this year with Domain Specific Agents that can act on those insights autonomously across SRE, development, and security workflows.
In Dynatrace, teams can trace the full execution path of any agentic workflow, from the initial request through every tool invocation, inter-agent handoff, and LLM call, and correlate that directly with infrastructure health and user impact. This also applies to vector database performance, token usage, latency, and error rates.
The Dynatrace MCP server exposes observability data to external tools, and dt-evals gives teams an open source CLI for evaluating LLM and agent output quality.
Best fit for: Large enterprises managing complex, containerized, multi-cloud environments where anomaly detection, remediation, and investigation automation need to operate at scale. Dynatrace has platform-level compliance certifications (FedRAMP, HIPAA, PCI DSS) and dedicated enterprise support that is especially valuable for companies in regulated industries like banking, healthcare, and pharma.
Drawbacks: Dynatrace is one of the most expensive tools on the market. Its Davis Platform Subscription (DPS) model bills by memory-GiB-hour, host-hour, pod-hour, and session, and costs compound quickly for large environments. The median enterprise annual contract is approximately $182,000.
Hot log storage defaults to 14 days before older logs move to cold storage where query-time billing applies. For teams whose core need is fast log and trace access at a predictable price, the depth of Dynatrace's feature set comes with cost and complexity overhead that is hard to justify without the full enterprise use case.
How to Evaluate Observability Tools for AI Readiness
Across these vendors, there are some clear similarities in AI approaches. Each tool has an MCP server that enables agentic workflows. Most tools have AI-based root cause analysis and troubleshooting workflows built into their platforms.
For every new feature announcement, it can still be difficult to know what is genuinely useful and what is designed for marketing buzz or a corporate partnership.
What do teams really need to build a strong observability practice for the AI era?
Teams building AI-based applications or working with coding agents need an observability platform with thoughtful MCP support, high-context telemetry data, and consistent search performance.
As logging volumes increase, cost predictability will also be a critical factor. If application usage changes rapidly, unexpected charges could leave you regretting signing up for a particular pricing model.
If business intelligence and AI SRE workflows are a priority, is it worth choosing an option that offers long-term data retention to create a richer dataset to work from? For example, Bronto's default 12-month log retention is a stand out compared to the 7 to 30-day defaults across most other tools on this list.
Most of the vendors in this list have free trials available. If you want to evaluate the only platform with long-term data retention and sub-second search at only $0.10 per GB, you can start a two week free trial of Bronto today, no credit card required.
Start a Free Trial of Bronto
Try Bronto for free for 14 days — long-term retention and sub-second search at $0.10 per GB, no credit card required.
Start a Free Trial of Bronto →