
What's Normal Around Here? Detecting Anomalies with Bronto
Seamus Cawley
Software Engineer

Today, we're launching the Anomaly Detection (AD) monitor type in Bronto. These Anomaly Detection monitors learn what is normal in your data, adjust for seasonality automatically, and alert you when your data departs from its normal pattern.
The part I'm most excited to announce is that these same features will be immediately available in the Bronto MCP server. This will enable any AI agent to easily ask if there are anomalies in any log or metric data available to it and to also detect and adjust for the seasonality inherent in that data.
Why static thresholds don't always work
A threshold monitor is a simple beast: Is this number above or below the line I picked? That works very well for a subset of signals, things with a fixed limit: CPU, disk usage or that error that will never, ever occur in production.
Static thresholds are hard to define when there's no obvious limit. Things like latency, ingestion rates, error counts, request volume. That data has a rhythm. Traffic climbs during the work day, dips at night and drops at the weekend. A threshold set for weekday traffic misses problems at the weekend. One set for typical weekend traffic alerts every Monday morning.
Attempting to use static thresholds in this case of no obvious limit tends to result in thresholds which either never fire or fire constantly. Either way, it's not doing its job.
For these types of signals we generally want to know when something "odd" happens, that's where Anomaly Detection monitors come in, and why seasonality adjustment matters.
Introducing the Bronto Anomaly Detection monitor
The Anomaly Detection monitor is a new monitor type. Point it at a metric or at a series derived from your logs, and it builds a model of expected behaviour and alerts when the data leaves that expected range. There is no fixed number to choose, and nothing to re-tune as your baseline shifts.
Bronto Anomaly Detection, with seasonality handling, suits the signals that threshold monitors handle badly:
Request and event volume
Error rates and error counts
Latency
Ingestion volume
To set up Bronto Anomaly Detection, there are only a few settings to think about and there's a handy preview of how the monitor would have behaved in the past with the selected settings to help you out.
Trigger when the value is. Choose above normal, below normal, or above or below. Use above normal for error counts and latency, below normal for something like ingestion volume that should never drop, and above or below when either direction matters.
How far from normal. This is your sensitivity dial. The number sets how unusual a value has to be before Bronto alerts, so a higher number means fewer alerts and a lower one means more. Start at 3, then adjust: raise it if you're getting alerts you don't care about, lower it if you're missing things that matter. Bronto uses median/MAD as the core of the underlying anomaly detection algorithm. The thresholds here are MADs from the median.
Evaluate over the last / Work out normal from the last. Together these set the two time spans Bronto compares: the recent window it checks for unusual behaviour, and the longer history it uses to learn what normal looks like. A shorter evaluation window catches problems sooner, while a longer one smooths out brief blips so self-correcting spikes raise fewer alerts. More history gives a steadier picture of normal, while less history adapts faster when your traffic changes.
Adjust for daily and weekly patterns. A toggle that turns on seasonality adjustment. Bronto runs a one-time search over the recent history of the query to automatically find and adjust for any daily and/or weekly seasonality in your data, this uses your search quota.
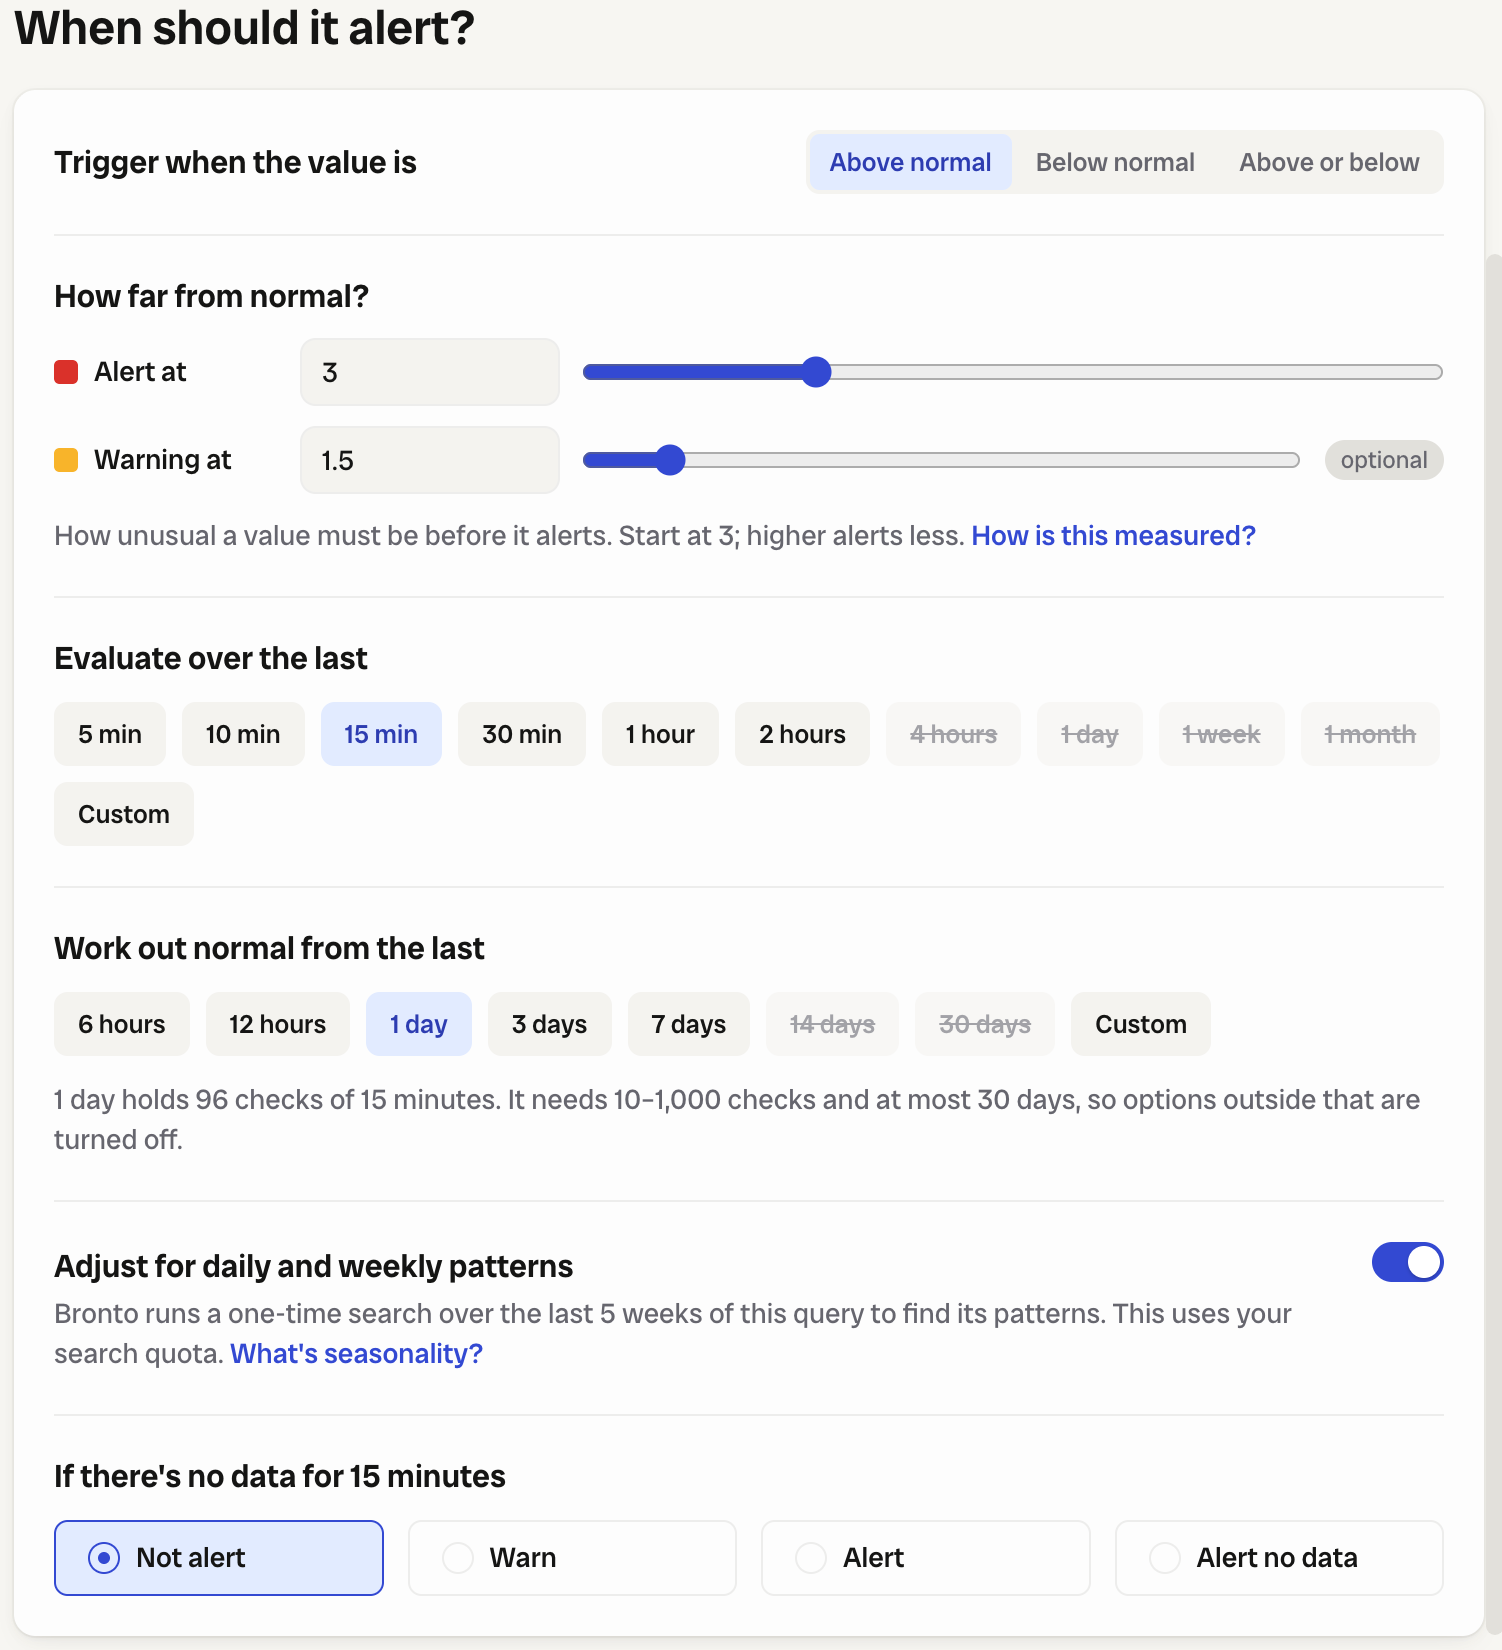
Figure 1: Configuration options for anomaly detection monitors
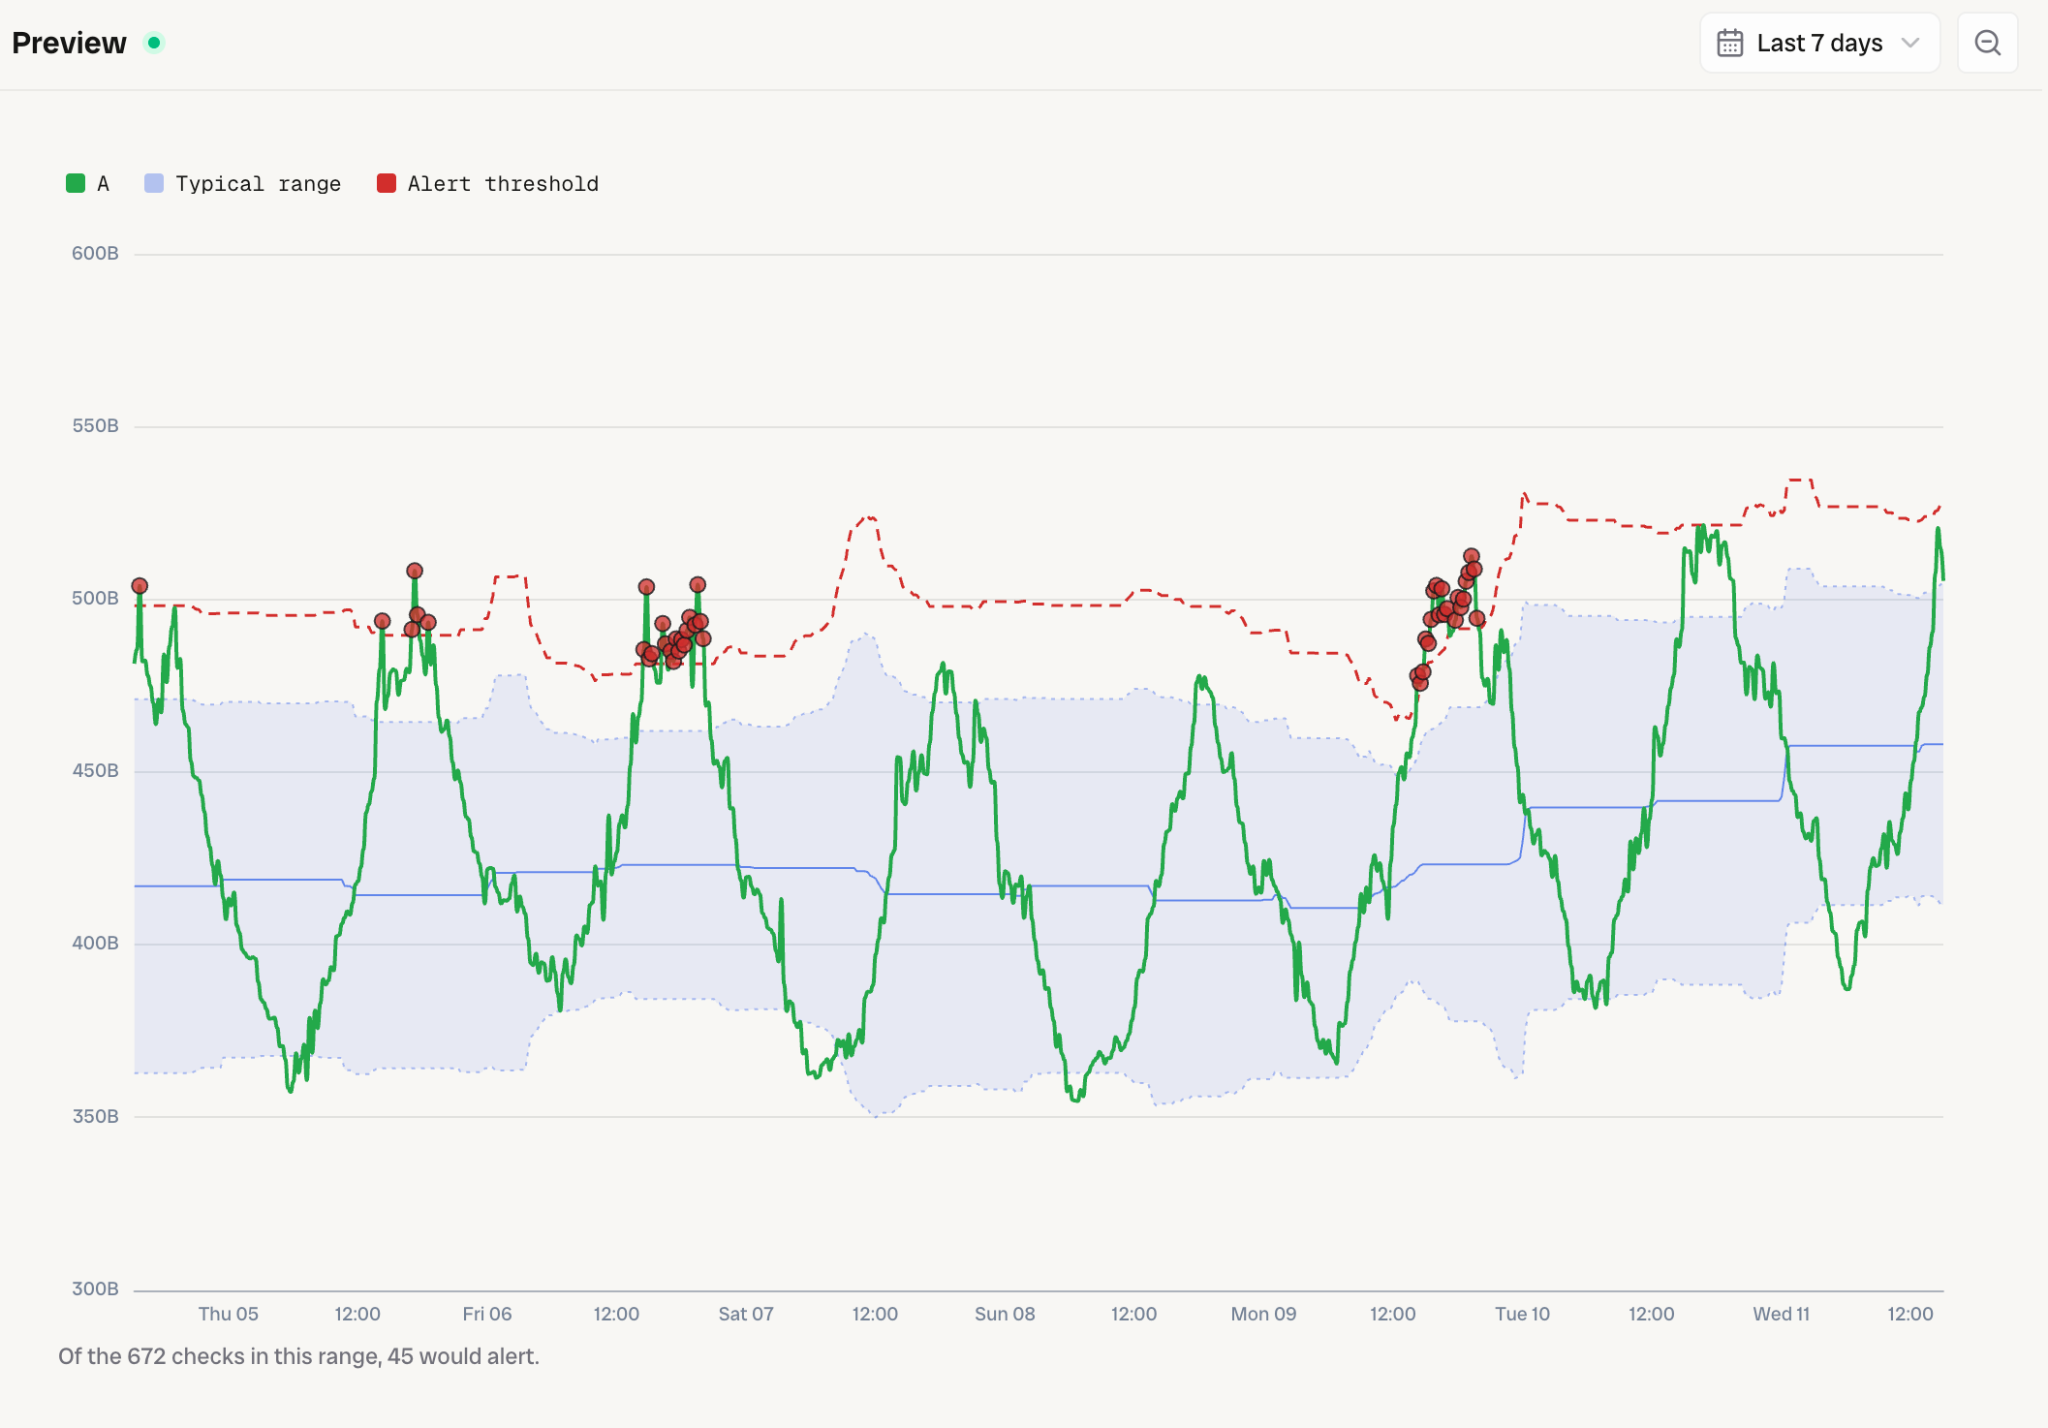
Figure 2: Anomaly detection preview
Seasonality, detected and adjusted for automatically
With seasonality adjustment turned on, the monitor automatically handles seasonality in your data, so it doesn't treat a Monday-morning peak as an anomaly, because it learns that the peak is part of the pattern. Bronto looks for daily and weekly patterns in your data, so you don't have to describe them yourself.
Under the hood we use a decompose-then-detect approach. Bronto first splits each series into trend, seasonal and residual components. Detection then runs on what is left once the predictable parts are removed, so the question to then be answered by Anomaly Detection becomes "is this unusual for this time of day and week?" rather than "is this big?"
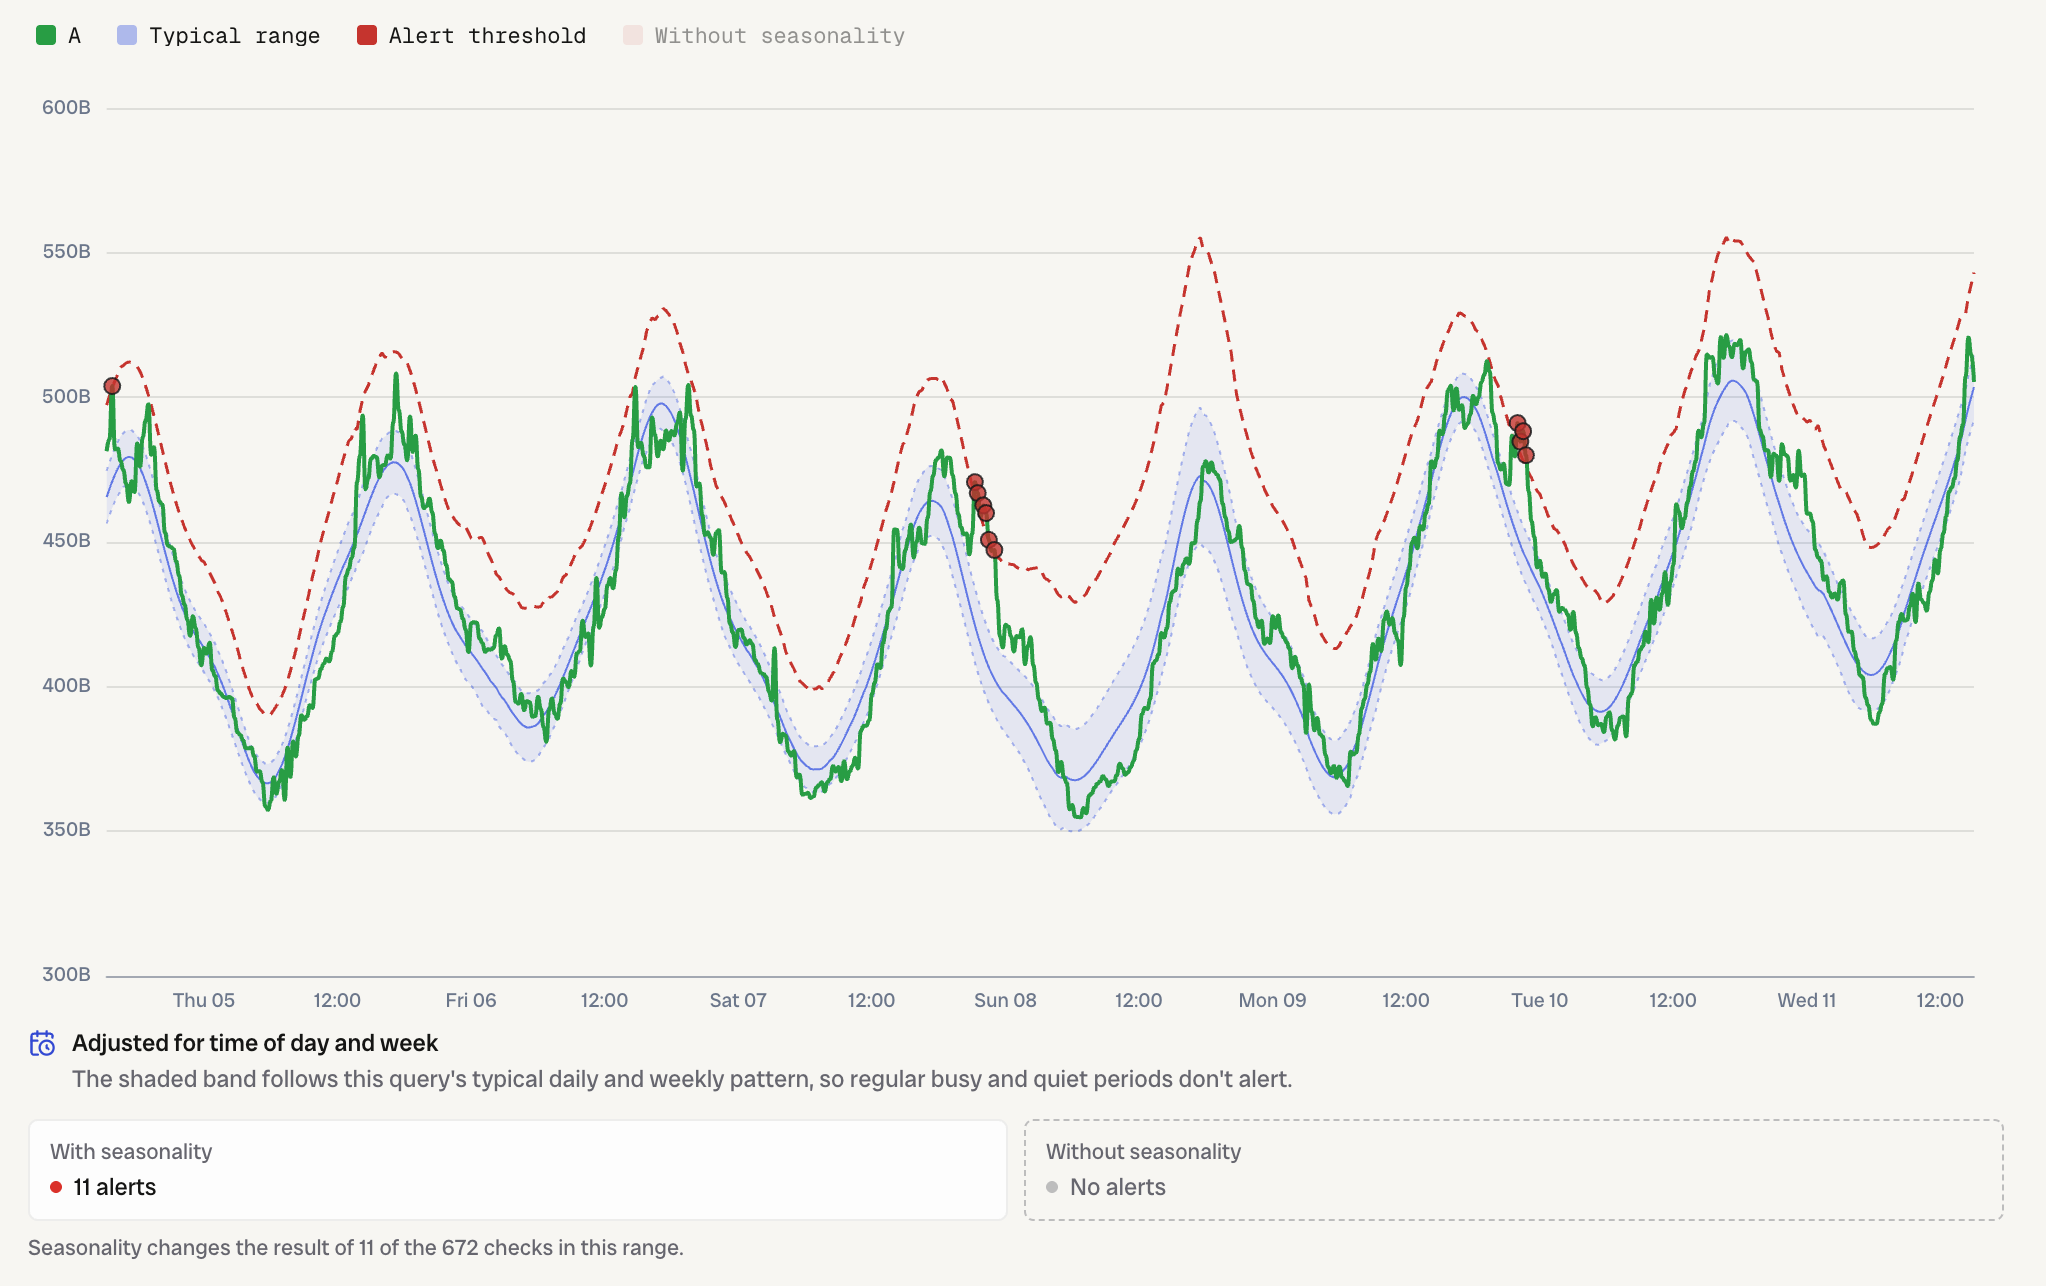
Figure 3: Anomaly detection monitor with seasonality adjustment
Built for agents too: Anomaly Detection in the Bronto MCP server
Monitors let you detect anomalies in signals you already know are important. AI agents, on the other hand, tend to do ad-hoc analysis as part of a broader investigation. So we've made the same detection and seasonality capabilities available to agents through the Bronto MCP server with the detect_anomalies tool.
That means an agent can:
Detect anomalies in any metric or log data on the fly, not only series that already have a monitor
Detect the data's inherent seasonality
Adjust for that seasonality, then reason over the adjusted series
Spotting anomalies in noisy time series isn't typically one of an LLM's strengths. Giving agents the same anomaly detection capabilities as our monitors use means they get a quick, consistent answer based on all the relevant data, not just a sample. The tricky part, finding the seasonality (which often needs weeks of data to get right), is already done for them.
What this looks like in practice
When you're looking into an incident, one of the first things you want to know is whether a metric is actually unusual or just the usual Monday morning bump. An agent can check that for you before it goes digging any further. You can just ask "Is the error count for the public API service unusual right now?" The same check is handy for root cause analysis too. The agent can look for anomalies across related services and logs to help narrow down what changed and when.
It also works well for scheduled checks. An agent can run through a handful of key series each morning and only mention the ones that look odd.
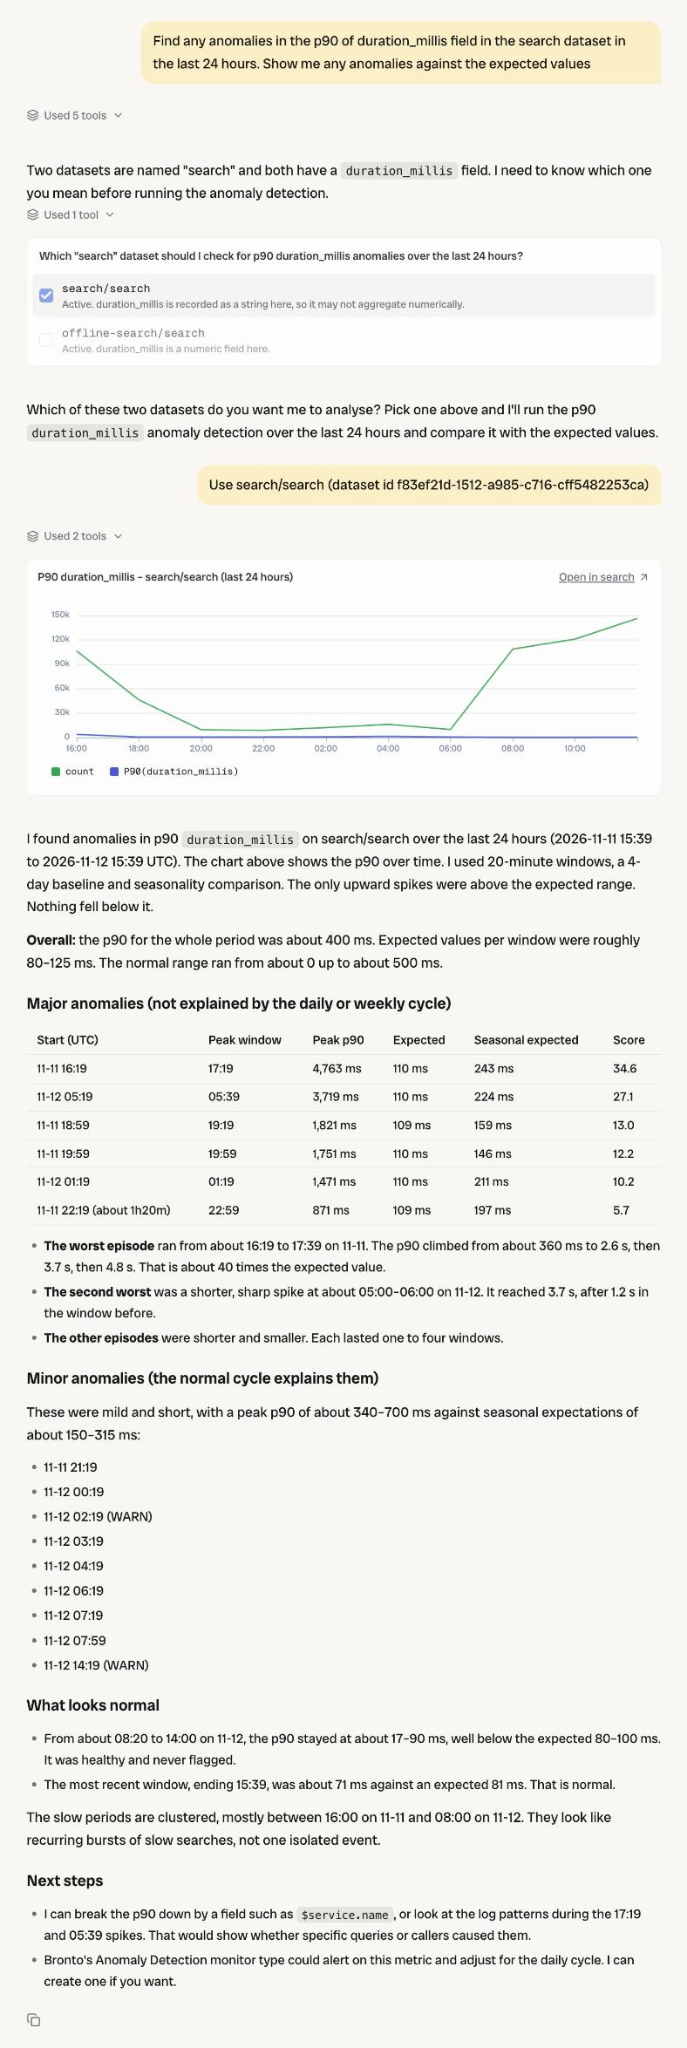
Figure 4: Screenshot from Bronto's upcoming in-app agent
Checking a deploy
Something we use ourselves internally is post-deploy verification. After a release, the agent uses the detect anomalies tool to check whether key metrics and error rates have moved away from what's expected for that time of day and week. It's a quick sanity check that nothing's gone wrong, and it doesn't get caught out by the normal daily and weekly swings.
We've packaged this up as a Claude skill. It runs detect_anomalies over the service's errors, traffic and latency from a couple of hours before the release up to now, with seasonality turned on.
Anomalies explained by seasonality, or ones which started before the deploy are ignored, allowing the agent to focus on any issues caused by the newly deployed version. It also has a quick look at the diff and runs the same check on whatever the change touched, like a modified endpoint.
Try it
Anomaly detection monitors are available now under Monitors → New monitor → Anomaly detection.
To give your agent the same capabilities, connect the Bronto MCP server.
# EU
claude mcp add --transport http bronto https://mcp.eu.bronto.io/mcp

# US
claude mcp add --transport http bronto https://mcp.us.bronto.io/mcp
Then run /mcp in Claude Code and sign in to Bronto. The detect_anomalies tool works with any MCP-capable agent, and the post-deploy skill drops into ~/.claude/skills for Claude Code.
Over to you
Anomaly Detection monitors learn what's normal for your data, including the daily and weekly swings, and alert you when something departs from it. There's no fixed number to pick and nothing to re-tune when your baseline shifts. Agents get the same detection through detect_anomalies in the Bronto MCP server, so they can tell you whether a metric is actually unusual before you go digging, or check that a deploy didn't move anything it shouldn't have.
If you're new to Bronto, you can sign up for a free trial and point a monitor at whatever you currently struggle to set a threshold on. Latency and error counts are a good place to start. Then don't forget to let us know what you build and what anomalies you find!
Enjoyed this post?
Share it with your team or network.

Try Bronto free for 14 days
Centralize your agent and infrastructure telemetry in one platform with sub-second search and 12-month hot retention.
- 14-day free trial
- No credit card
- Set up in minutes