
How I Used AI to Quickly Build a Grafana Data Source Plugin for Bronto
Gary Nicholls
Lead Software Engineer

At Bronto, we obsess over making the user experience as simple and intuitive as possible.
How can we reduce clicks? Add validation? Remove invalid options? And just as importantly, how can we make the experience as minimalistic and useful as possible?
A great user experience is not confined to a single product. It should be seamless.
Integrating Bronto Data with Grafana
For some organisations, Grafana dashboards are the standard and Bronto needs to fit naturally into the tools they already use. They have built hundreds or even thousands of dashboards over years and, no matter how much they like Bronto, they simply cannot replace them. What they need is a way to bring Bronto data into those Grafana dashboards.
These dashboards often span multiple backends, bringing data from different systems together into a single pane of glass.
That's exactly why a customer approached us. They were very happy with Bronto's 12-month retention and lightning-fast search, while also needing Grafana support to bring those capabilities into the dashboards they already rely on.
The Experiment
To support customers in the Grafana dashboard they already use, we researched the available integration options and found that a data source plugin was the right approach. The next question was: how much effort does it take to build a Grafana data source plugin?
Grafana provides a command-line tool to scaffold a basic plugin, along with an excellent Docker Compose setup for developing and testing it. Beyond that foundation, the plugin needed two main components:
A React-based UI that lets users select datasets, apply filters, optionally group by fields and aggregate results. The UI would also need to display log events and dashboards.
A Go backend that authenticates with the Bronto Search API, executes searches and converts the responses into a format that Grafana can consume.
On paper, this seemed like it could easily take several days, maybe even a week, to code and test. I wanted to find out whether an AI assisted approach could reduce that effort substantially.
How AI and OpenAPI Accelerated the Build
Bronto is an API-first platform. Because we maintain an up-to-date OpenAPI specification for our REST APIs - the same APIs that our own products use - I could use an LLM to generate most of the client code, avoiding writing it from scratch.
I fed our OpenAPI spec and Grafana’s Go SDK documentation directly into Claude (Sonnet 5). For the initial implementation I used a prompt along these lines:
I'm building a Grafana datasource plugin for Bronto. Here's our OpenAPI specification [attached] and Grafana's Go SDK documentation [attached].
I need a Go backend that queries Bronto's POST /search endpoint. The endpoint is asynchronous, so poll the returned URL until results are ready.
Map results to Grafana's native DataFrame format:
- Log events as a log frame
- Aggregate totals as a time-series frame
- Grouped results as one frame per group
Also scaffold:
- A React configuration editor with base URL, API key, and default dataset
- A query editor with collection/dataset selection, where clause, aggregation, and group-by controls
Within minutes, the LLM generated the initial backend logic and React components. It wasn’t completely plug and play, the generated code needed refinement in a few areas:
Data Frame Formatting: converting Bronto’s JSON log event responses into Grafana’s strict, vector-based
data.Frameformat required some additional code to handle transformations correctly.State Management: the generated React UI code had some state management issues, which required some additional work to resolve.
Filter Validation: while top keys and values were loaded, the filter bar provided no validation or suggestions. This had to be manually implemented.
For example, I later used the following prompt to build the dataset selector:
This is my Bronto datasource plugin for Grafana. It currently has separate collection and dataset dropdowns.
Replace these with a single searchable multi-select dropdown, allowing users to select datasets across one or more collections. Search should work across both collection and dataset names.
Here is an example of the UX I’m aiming for: [screenshot attached].
Even with those fixes, moving from a blank directory to a working queryable prototype took only a few hours. With a little more hands-on development, testing, and refinement, that prototype became a working Grafana data source plugin.
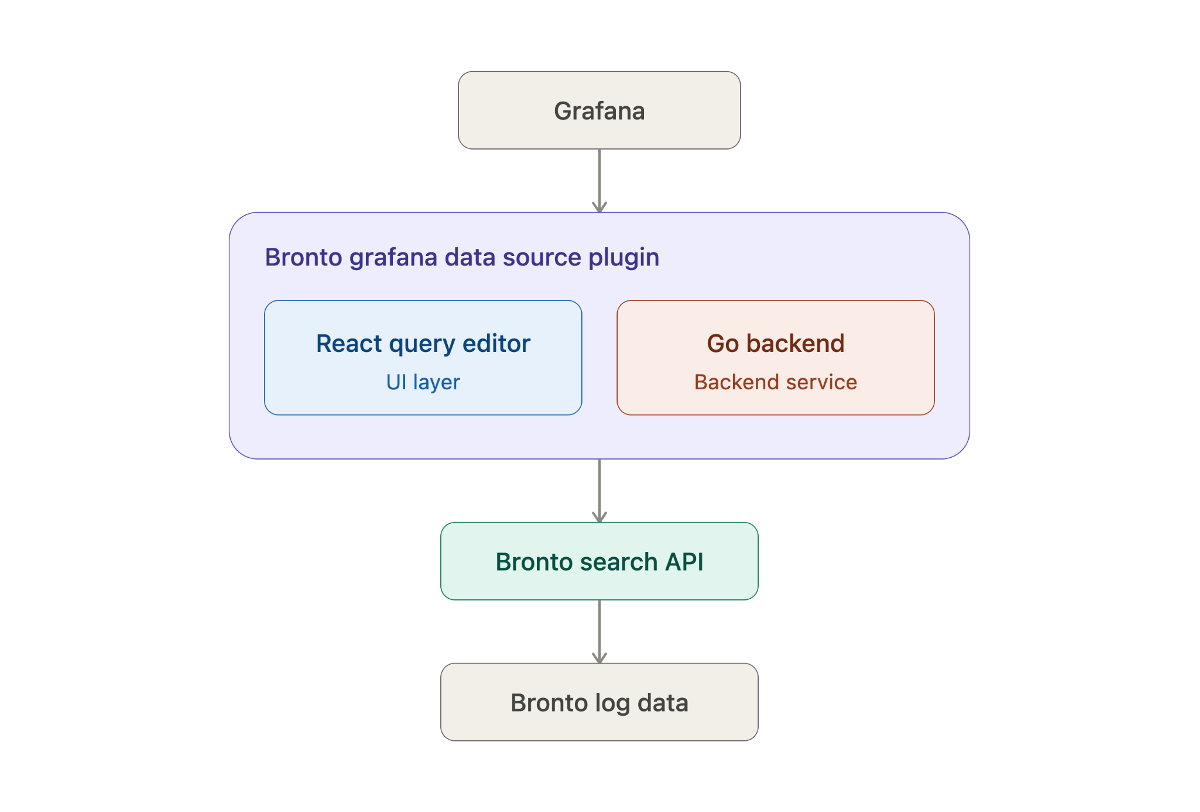
Bronto Grafana data source plugin architecture
What Can Users Do?
The Bronto data source plugin lets you search Bronto log data from inside Grafana, without leaving the dashboards your team already uses as shown in the screenshot below.
Once connected, you can:
Search log events using Bronto's SQL-style filter syntax, rendered in Grafana's Logs panel and Explore, complete with a log volume histogram.
Aggregate data using functions such as
count(*)andavg(response_time_ms)and plot the results as a time series.Group by one or more fields to break an aggregation into a multi-series graph.
Query multiple datasets at once using a searchable picker grouped by collection.
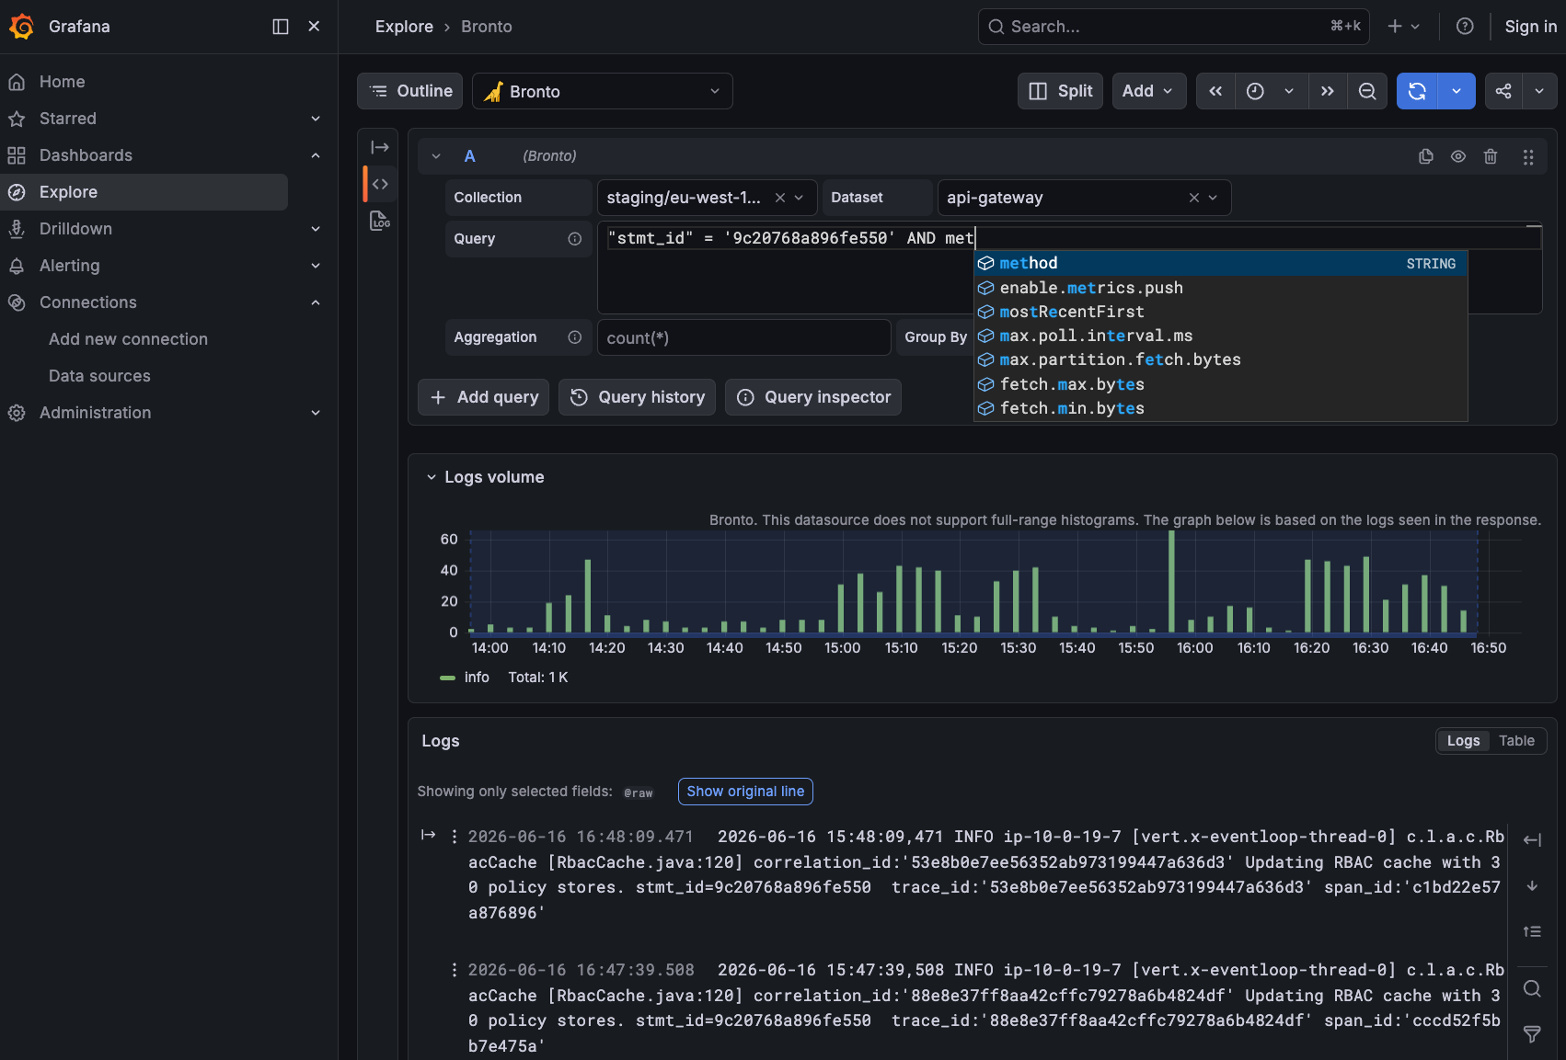
Exploring Bronto Logs in Grafana plugin
The plugin currently covers log data only. Traces and metrics will be queryable in the future.
How to use the Bronto Plugin
Getting started is straightforward:
Install the plugin: grab the latest release from our GitHub repository and drop it into your Grafana
plugins/directory.Allow unsigned loading: update your
grafana.iniconfiguration:
[plugins]
allow_loading_unsigned_plugins = brontoio-bronto-datasource
Connect your key: restart Grafana, navigate to Connections -> Data Sources -> Add Bronto, and paste a Bronto API Key generated from your account settings.
For detailed instructions, see the Grafana integration documentation.
Once that's done, you're ready to start querying Bronto data from Grafana.
What's Next?
The next step for Bronto is to add support for Traces, followed by metrics.
By combining a well designed API, a mature integration framework and AI-assisted development, an integration that previously might have taken days to implement can become a relatively small engineering project.
Want to try it out? Download the plugin on Github
Enjoyed this post?
Share it with your team or network.

Try Bronto free for 14 days
Centralize your agent and infrastructure telemetry in one platform with sub-second search and 12-month hot retention.
- 14-day free trial
- No credit card
- Set up in minutes