
Making Sense of Log Noise at Scale: Introducing Patterns
Seamus Cawley
Every application produces logs. At low volume, reading those logs is fine, you scroll, you spot the problem, you move on. But as your system grows, logs stop being readable. A busy service can emit millions of lines a day, most of them noise. The signal you need is in there somewhere, buried under health checks, routine transactions, and retry storms.
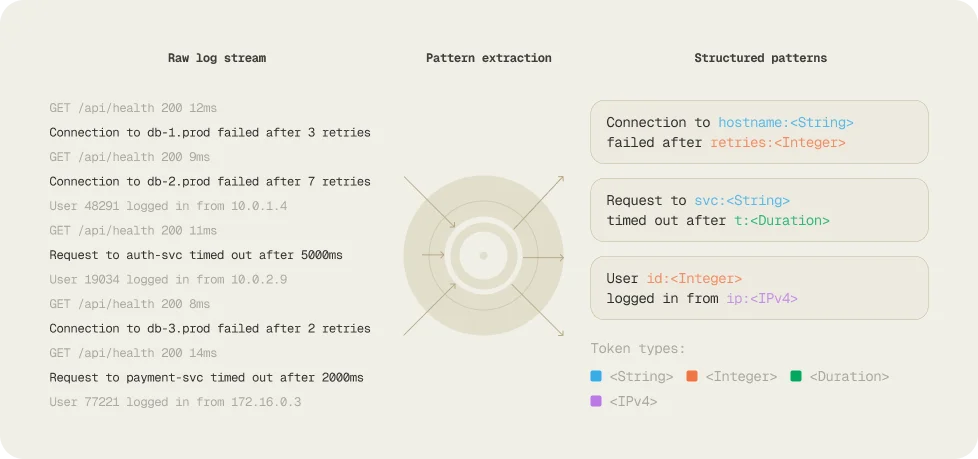
The standard response to this is to perform a search on the logs. But search has a fundamental problem: log messages are strings, and strings are unstructured. Two lines that mean the same thing look different because of the dynamic values embedded in them:
Searching for "failed after" gets you the events you want, plus every other log line that happens to contain those words because you're matching text, not meaning.
Now Bronto search uses Patterns to solve this.
What is a Pattern?
You can think of a Pattern as the static skeleton of a log message. It consists of the parts that never change, with the dynamic values replaced by placeholders as shown in the following pattern:
Bronto Patterns are automatically trained on up to 1 million log events at ingest time, so Bronto automatically extracts Patterns from your logs at ingest time. No configuration, no schema definitions, no instrumentation changes. As logs flow in, structurally similar messages are grouped together and the pattern is identified. Each unique pattern gets an ID, and every log line is tagged with the pattern it belongs to. Pattern IDs are durable, they don't change over time, and have the same retention as your log data.
The result is a new layer of structure on top of your existing logs. Your logs don't change, but now you can reason about them by shape, not just by content.
Searching with Precision
The most immediate benefit of using Bronto patterns is search quality. Say you're investigating a timeout issue. You search for "timeout" and get thousands of results, e.g. from three different services, across four different code paths, some related to your problem and most not. You spend the next ten minutes working out which results are relevant and iteratively excluding the pieces of data which aren't.
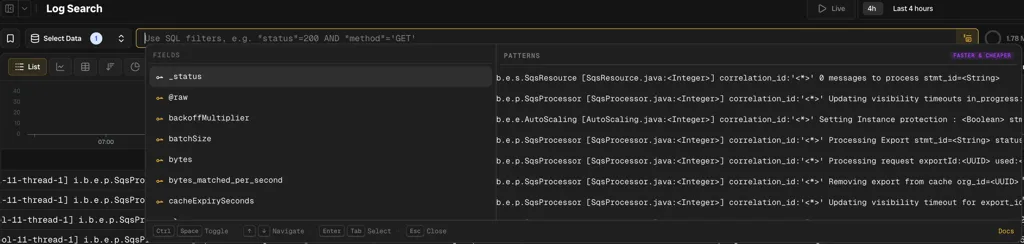
With Patterns, you search differently. Bronto's search interface shows you the matching patterns as you type:
You pick the pattern you care about. Every result from that search belongs to the same code path. No false positives, no manually filtering out unrelated matches.
This is especially valuable when the word you're searching for is common. "error", "failed", "null" appear everywhere. Patterns let you target searching for the specific thing that's broken.
In Bronto this has the added advantage of automatically scoping your query to that pattern. As pattern IDs are written as log attributes this brings some additional powerful features:
- Bronto's indexing improves search speed vs searching for raw strings
- The ability to use patterns in logical expressions
- The ability to query, and group by patterns via the API just like any other field.
Stable Monitors and Alerts
Monitoring systems are only as reliable as their filters. A common failure mode: you set up an alert for logs matching "payment failed". Six months later, a new feature adds logging for payment retries, "payment failed, retrying in 5s", and your alert starts firing on recoverable events. The filter was right at the time; the code changed around it.
Patterns don't have this problem. When you pin a monitor to a specific Pattern ID, it captures exactly the log statements you chose and only those. New log lines that happen to contain similar words don't sneak in. Using Bronto Patterns, your monitors mean what you intended them to mean, even as the codebase evolves.
Understanding What Your System is Actually Saying
When you're new to a service, joining a team, picking up an on-call rotation, debugging something outside your usual domain; the logs are often the first place you look. But a raw log stream is overwhelming. Which messages matter? What's normal? What's unusual?
Browsing Patterns gives you a map.
Instead of scrolling through thousands of individual lines, you see the distinct things this service logs: the 40 patterns that describe its normal operation, the 5 that only appear during errors, the 2 that fire constantly and probably aren't worth watching. You get a mental model of the service's behaviour without reading the code.
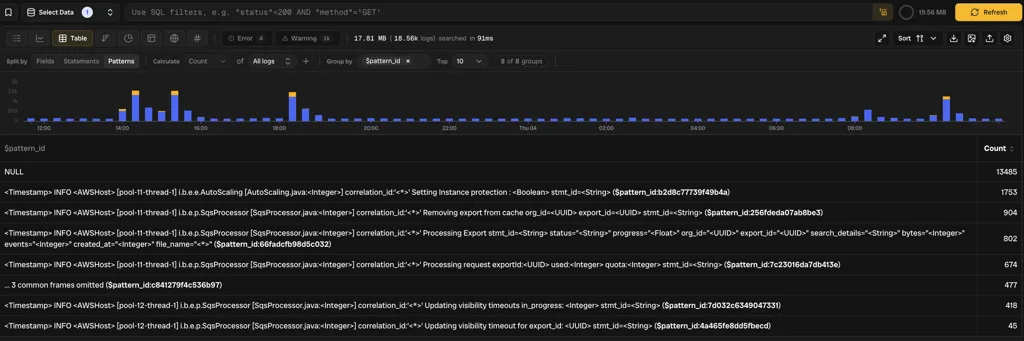
The following screenshot shows a groupby and count of pattern_ids in a particular log, showing their frequency and distribution over a time range.
Tracking Log Volume and Cost
Not all log lines are equal. A handful of patterns often account for the majority of your ingestion volume and therefore your logging costs.
Bronto's pattern view surfaces this directly: you can see which patterns are generating the most log lines, how that has changed over time, and which services are the biggest contributors. This makes it straightforward to have the right conversation: "this debug statement fires 2 million times a day, do we still need it?" rather than hunting through dashboards to figure out where the volume is coming from. How the volume of a particular pattern changes over time may also indicate a change in your system that is worth investigating further.
Patterns as a Foundation for AI
Log analysis is one of the tasks most people want AI to help with; summarising what happened during an incident, surfacing anomalies, answering "is this normal?" But AI tools work better with structure. Raw log streams, where every line is a unique string, are hard to reason about at scale.
Patterns give AI a vocabulary. Instead of processing millions of distinct strings, a model can work with a manageable set of patterns and their frequencies. Anomaly detection becomes "this pattern is firing 10x more than usual." Incident summarisation becomes "these three patterns were elevated during the window." Root cause suggestions become more precise because the AI knows which code path each pattern came from.
Patterns provide a layer of structure that makes intelligent log analysis more intuitive for humans and more token efficient for AI agents.
How are Bronto Patterns better?
Previous sections have shown the power of Bronto creating Patterns automatically at ingest time with a pattern ID as a log attribute and how this improves search times, gives improved search precision and more stable and specific monitors/alerts. Comparing Bronto to the patterns offered by others:
- Query Time vs Ingest Time. The Datadog Pattern feature is mainly a query-time feature which relies on 10000 log samples. The Grafana Pattern is based on clustering logs at ingestion, over a rolling 3 hour window per log stream. Dash0 detects patterns automatically at ingestion, but they state this may require several hours to warm up depending on log volume. Bronto matches log events to known/trained patterns automatically at ingestion. Training is done on 1 million log events automatically for a new log type and typically takes minutes for a busy log, so the pattern for a new log is applied quickly to all events in the new log type and is then available to use in search immediately.
- Distribution of Values. Datadog can show the distribution of values for detected dynamic parts of the Pattern, but this is derived from a set of matching events for the pattern, which are themselves based on a sample of logs. Bronto can show a count and distribution across time of values of all Pattern IDs across all log events as shown by the screenshot of groupby above as part of "Understanding What Your System Is Actually Saying".
- Permanence. Grafana Patterns are ephemeral and are only mined from the previous three hours of your logs, whereas Bronto's Pattern ID is an attribute on individual log events, which is permanent and remains associated with all log events as long as the log itself is retained. This gives all the benefits of Bronto Patterns for historical as well as recent log events.
- Search. Datadog have a separate patterns list visualization that can access a sample of logs from that pattern and append the search filter to scope it down to logs from this pattern only. They also have a Pattern Inspector tab to get more details, using sampling, on the pattern such as its top values. In contrast Bronto's Pattern feature is a first class citizen in search and the Pattern ID can be added as a key value pair to a search filter (and values can be auto-suggested) across all events, allowing matching events to be viewed or to perform statistical analysis.
Getting Started
Patterns are available now in Bronto. They require no changes to your logging configuration. If you're already sending logs to Bronto, your patterns are being extracted automatically and can be seen in the UI. The patterns detected in your log data are available in the API at /patterns. You can also query, and group by patterns via the API just like any other field.

Try Bronto free for 14 days
Centralize your agent and infrastructure telemetry in one platform with sub-second search and 12-month hot retention. No credit card required.