
Observability For Humans and Agents in the AI Age
Severin Neumann
Head of Community, Bronto
Nicolas Wörner
Founding Software Engineer, Ollygarden

Look around and it can feel like everyone is using LLMs for everything. In software, that impression is close to true. Teams are not only building applications with agents, they instrument them with agents, and when the application goes live another set of agents handles the incidents.
You might already live in that reality, with agents across your whole software development lifecycle. You might be at the other end of the spectrum, doing all of this without AI. Not by hand, since you already have a high degree of automation in software, just without a model in the loop. Or you sit somewhere in between and ask the obvious question: what is the next thing worth handing to an agent, and which parts are a hype trap?
We want to answer that in the one area where we can claim to be subject matter experts: observability. Two pieces of it in particular.
Instrumentation. The code you add to your software so it emits telemetry, so that someone can later ask questions about it.
Analysis. The work of using that telemetry to answer those questions: to fix issues, to prevent them, and to make the system better.
Our companies sell products in both halves, and we obviously think they are good. This post is written so you can act on it either way, whether or not you ever become a customer of OllyGarden or Bronto. Everything here works on plain OpenTelemetry.
We believe AI agents can help with both instrumentation and analysis, but they only work well when the telemetry they rely on is intentional, trustworthy, and easy to access.
So: what are the levels at which you can put LLMs to work on your instrumentation and your analysis?
How We Use Agents for Instrumentation at OllyGarden
The short version of what works for us (and probably for you, too):
Use coding-agents during the local development to facilitate the manual instrumentation process
Be careful with the business context: deciding what matters is still (mostly) on you
Use agent skills to improve coding agents
Enrich them with your custom conventions and guidelines
Make instrumentation part of the SDLC
Agentic PR reviews with a focused look at instrumentation, so blind spots and over-instrumentation ideally don’t reach main
Set up a continuous background agent focused on instrumentation across the whole codebase
If you want to take it to the next level: Let it create the fixes autonomously
Auto-Instrumentation
Most codebases that use OpenTelemetry get it through auto-instrumentation: eBPF (OBI), monkey patching (the Python agent), or bytecode manipulation (the Java agent).
This works, and it is a quick way to get baseline telemetry about a running application. But auto-instrumentation comes with an inherent drawback: it captures generic data to get you started, and it cannot capture business context. The result is high volume and low signal: you can see that an HTTP call happened, but not which customer, which plan, or which feature flag it ran under.
Manual Instrumentation
As the name suggests, manual instrumentation is the opposite: it puts engineers in control of deciding which telemetry is useful and worth collecting. Could this information be relevant during a 3 a.m. outage? If yes, instrument it proactively so troubleshooting is easier when it matters. Could an attribute expose sensitive data to the backend? If there is any doubt, redact or sanitize it at the source before it is emitted.
While the theory sounds promising, the reality is that manual instrumentation is not trivial. Done right, it requires consistency across application boundaries, correct context propagation, OpenTelemetry domain knowledge, and, most importantly, engineers with the time and knowledge to maintain it.
Instrumentation with AI Agents
But code is cheap now, and to some extent, so is manual instrumentation. For an AI agent, there is little difference between adding a new feature to a codebase and instrumenting an application with OpenTelemetry. At the end of the day, it is "just code."
So if code, and therefore in some sense manual instrumentation, has become cheap, does that mean instrumentation is solved? Unfortunately, no. At least not yet. A recent study found that LLMs still struggle to decide what to instrument and how to instrument it effectively. They have learned that exceptions and network calls matter. But they are not reliable at deciding which business context matters.
Fortunately, there are a few things you can do to improve an agent's ability to instrument your codebase. An obvious, yet impactful, improvement is to provide agents with dedicated agent skills. One example is the OllyGarden OpenTelemetry agent skills.
These skills provide curated knowledge, guidance, and pointers that steer agents in the right direction, and they make sessions cheaper and faster along the way. The otel-semantic-conventions skill, for example, helps the agent navigate the fairly large semantic convention registry without pulling the whole thing into context, so it finds the released attribute names and span naming rules it needs at a fraction of the tokens.
The language skills such as otel-go point it to the right contrib instrumentation libraries like otelhttp and otelgrpc instead of hand-rolled spans. You can load them directly into your agents, or use them as a baseline and extend them with organization-specific context, conventions, and instrumentation guidelines. This custom knowledge does not exist in the LLM's training data, so the model cannot know it unless it eventually picks it up on its own, or better: you provide it. Based on our experience, supplying this custom domain context is one of the highest-leverage ways to improve the instrumentation capabilities of coding agents.
At OllyGarden, we like to incorporate agents into different phases of the SDLC (Software Development Lifecycle). The most obvious one is, of course, during local development, but there is more.
As mentioned earlier, manual instrumentation is business-relevant code and should be treated accordingly. Just as your agent reviews code changes before merging them into main, it should also take a focused look at the existing, or missing, instrumentation in a PR. If a new feature could leave you flying blind after it is merged, you, or in this case your agent, can catch that before it happens. The same applies to over-instrumentation. There are many good AI code review tools out there, and most of them already catch basic instrumentation issues. We noticed that custom instructions can push them further.
Unfortunately, some things inevitably slip through, because a PR only shows a small part of the picture: the instrumentation surface of a change sometimes spans (pun intended) the whole codebase, and a diff alone is not enough context to judge it.
That is why we believe instrumentation additionally benefits from an agent (or multiple ones) that runs continuously autonomously in the background and watches how your instrumentation evolves alongside the codebase. It surfaces gaps and over-instrumentation before they hurt you. Looking further ahead, the natural next step is closing the loop: the same process raising PRs on its own to optimize the instrumentation. A human should still review and manually approve those PRs since agents love to over-instrument or apply inconsistent conventions.
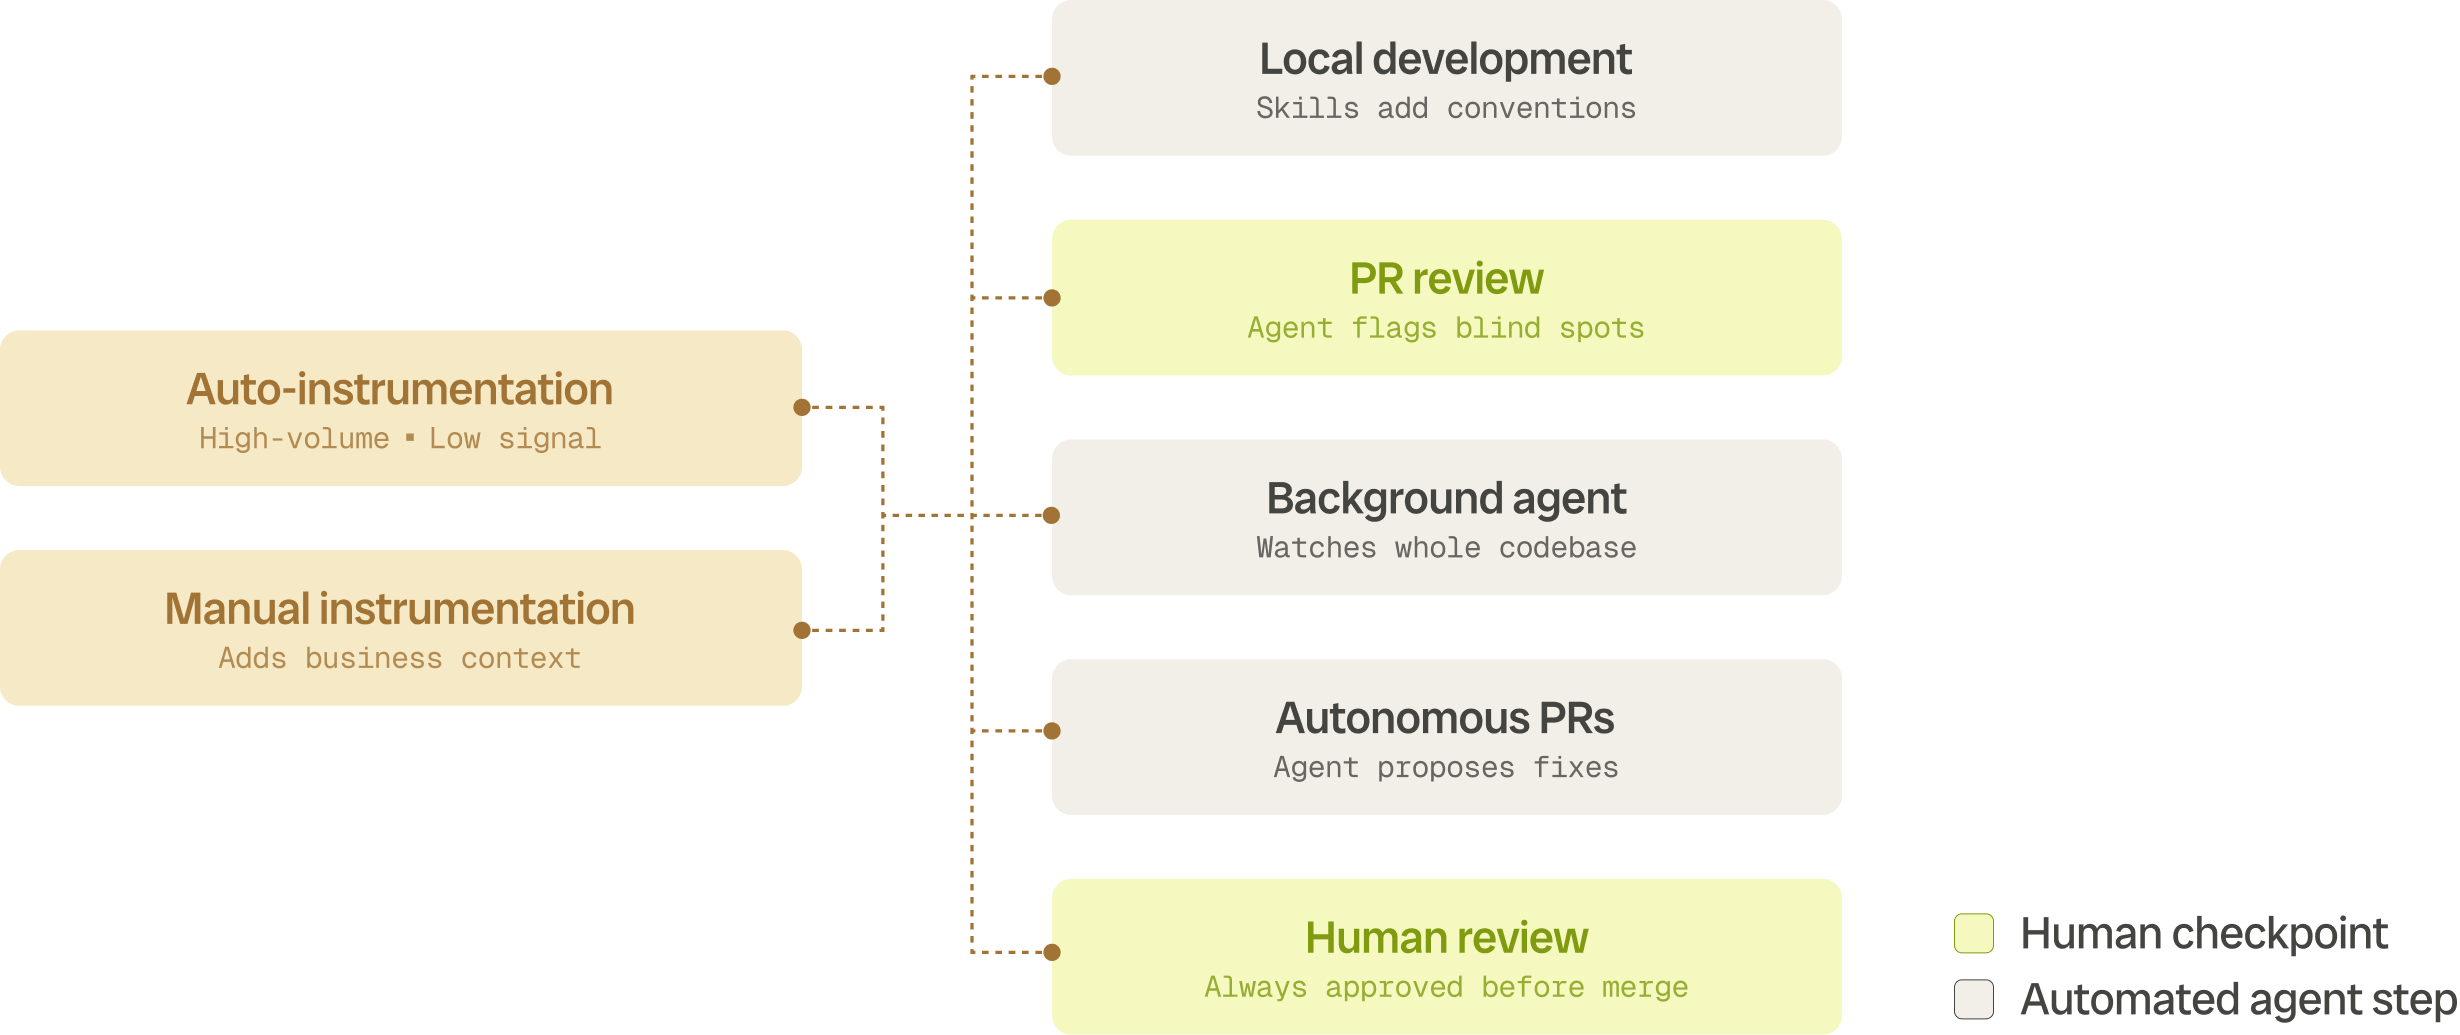
Overall, introducing manual instrumentation to your codebase has already gotten a lot easier thanks to AI-Agents, however, in particular applying purposeful and consistent manual-instrumentation still requires oversight, guidance and time.
How We Use Agents for Analysis at Bronto
The primary use case for observability data has always been incident response. Something behaves in a way you did not want, someone gets notified, and that someone starts digging: suspicious logs, slow traces, a metric bending the wrong way. It is tedious work, and it gets slower as the environment gets bigger. The gap between "the issue appeared" and "we know why" grows with the size of your system.
When LLMs arrived, the obvious first move was to put a chat box in the observability product. You could ask it to explain what you were looking at, to find the evidence you needed, or to produce a set of hypotheses about the root cause. If you have never tried this workflow, start there. If your observability solution has no built-in chat, connect a general-purpose model to it over MCP or a CLI and ask the questions you would have clicked your way to: what caused the spike at 3pm, why is the authentication service slow, and summarize every log from the last thirty minutes.
Do not stop at incidents. The same interface answers questions about bottlenecks and optimization: which service consumes the most time on the critical path of a payment transaction? And if your backend keeps data long enough to make the question meaningful, which services were used less over the last three months? You can also have the model build dashboards for you, or vibe code an entire custom interface on top of your data. All of it by asking questions, and all of it faster than doing it by hand.
Run that way for a while and you notice the repetition. The same questions, the same context, the same instructions and restrictions typed again every session. That is what skills are for: markdown files you write once and hand to the model whenever it does a particular task. Write your own, or start from the examples the community publishes.
At this level analysis starts to feel like programming. You tell the model up front whether this session is incident response, incident prevention, or optimization, and it comes with the right assumptions. It is still reactive, though. A human has to walk over to the machine and ask.
Once you know where the model helps and where it does not, you can drop the reactive part. Enrich your alerts with LLM-powered runbooks: for a defined set of well-understood alerts, add a trigger that hands the alert to an agent with instructions to investigate. Give it skills, a few CLI tools, and the MCP servers it needs, and it comes back with hypotheses and candidate fixes on its own. Your job becomes reviewing the output, accepting what holds up, and tuning the agent for next time. This is what the first generation of "AI SRE" products did, at its core: a domain-specific agent with defined inputs, tools, and outputs. Some observability platforms ship it as a feature. You can also build your own quickly with a workflow builder like n8n or an agent framework such as AWS Strands Agents.
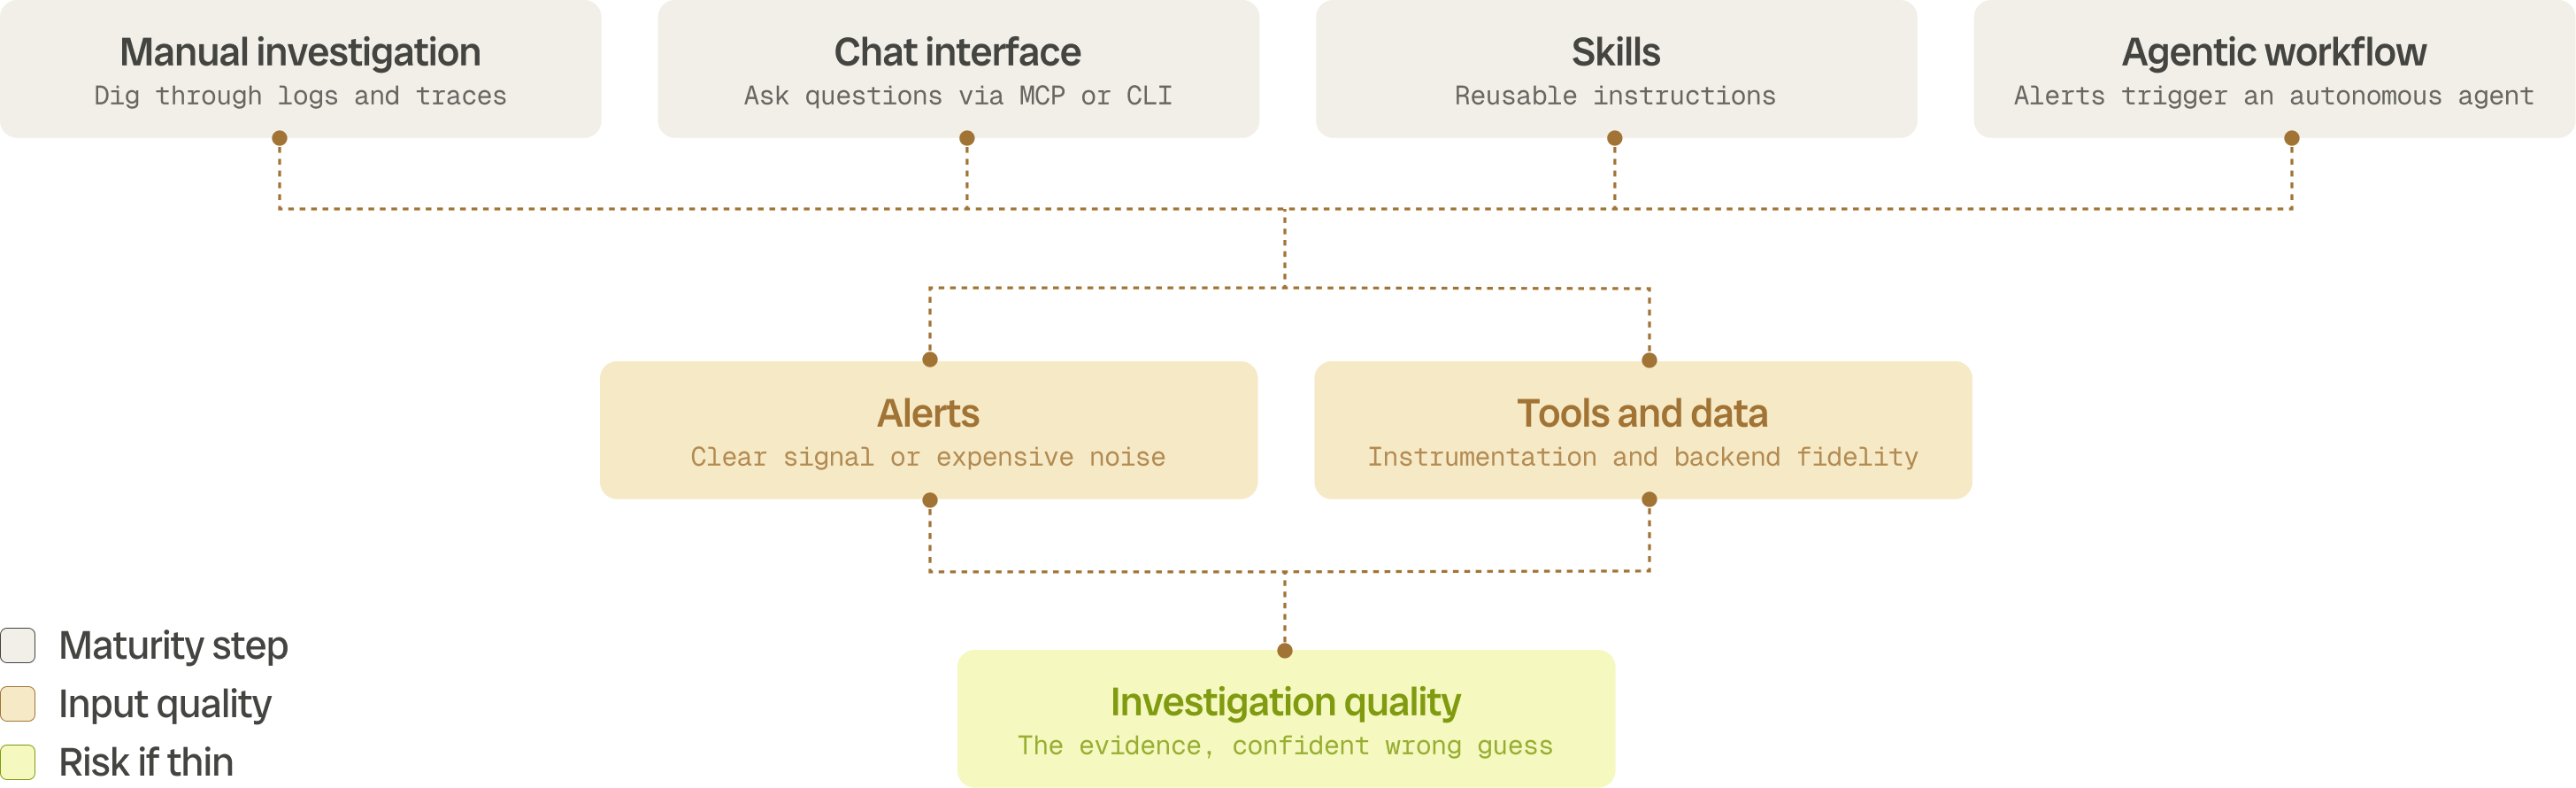
Follow that path and you have gone from manual, to chat, to skills, to an agentic workflow. From here the remaining gains are almost entirely about inputs, tools, and the quality of what you feed the thing. Those choices matter far more than which model or which harness you picked:
Inputs. Alerts were a hard problem when humans were the only consumers, and they do not get easier. They get more expensive. An alert storm that fans out into hundreds of agent investigations will drain a token budget in an afternoon. You can gate it with suppression, or put a triage agent in front, but the real fix is the same as it always was: alert on a clear signal.
Tools and data. Your agent can only find what is in your data, and this is where the two halves of this post meet. Instrumentation decides whether the answer exists. Your backend decides whether the agent can reach it, how fast, and at what fidelity. An agent that has to wait on a rehydration job, or that gets handed a one-percent sample and asked to explain a specific customer's failed request, will do what agents do when the evidence is thin: it will produce a confident, well-written hypothesis that happens to be wrong.
From “Human Only” to “Mostly Agents”
We hope this helps on the way from doing observability by hand to having most of it done by agents. If you are an SRE or in ITOps, this is not the part where your job disappears. It changes shape. Instead of working through the tasks yourself, you orchestrate the agents that do, and your real work becomes improving that workflow by upgrading the building blocks underneath it, one at a time, as you find the weak one.
You can build some of those blocks yourself. You can also get help. OllyGarden's Rose works on the instrumentation side. It reviews your OpenTelemetry, adds what is missing, and fixes what is off, running continuously in the background, so the telemetry your agents read was written on purpose. Bronto works on the other side: full fidelity with no sampling, twelve months of hot retention by default, sub-second search across petabytes, and MCP so your logs, metrics, and traces are a first-class tool call for whatever agent you point at them.
Site reliability engineering has always been about making systems reliable and scalable through better automation. Using agents for it is just what that looks like in 2026.
We shared our perspectives as experts on instrumentation (OllyGarden) and analysis (Bronto), but we are curious what your perspective is? What works for you, what doesn’t? Do you agree or did we miss something important?

Try Bronto free for 14 days
Centralize your agent and infrastructure telemetry in one platform with sub-second search and 12-month hot retention. No credit card required.