

Onboarding that does the work for you
Mati Remi
Head of Design & CX
Most logging tools start you in the same place: an empty org, a blank dashboard, and a setup checklist. You wire up an agent, wait for data, then build your searches, dashboards, and alerts from scratch. It works, but the first hour is spent on plumbing.
We've just rebuilt Bronto's first-time experience around a different idea: onboarding to a new observability platform should take a few minutes - not just to get your data in, but to start getting genuinely real value from it. And you shouldn't have to do much to earn that. While you're getting set up, Bronto is doing the work behind the scenes: detecting your agent, converting your config, parsing your logs, and matching templates to your data. By the time you land in the product proper, your data is already structured, with dashboards, saved searches, and monitors waiting for you.
Here's how it works.
Two ways to start
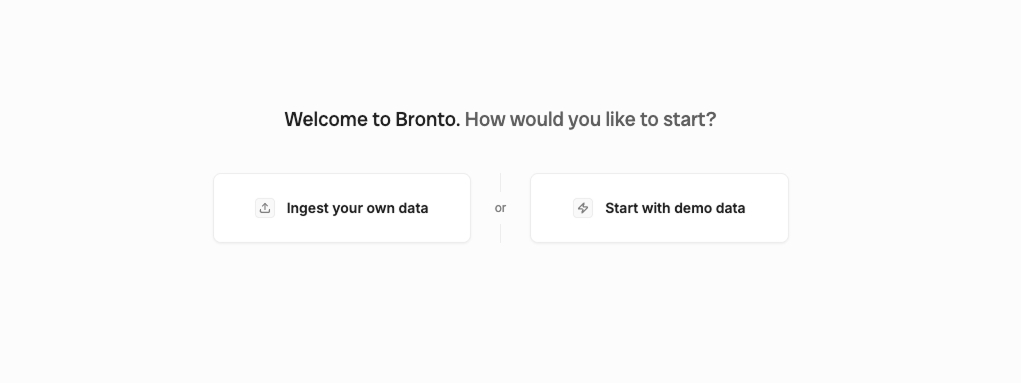
When you sign in to a new org with no data yet, you get a focused setup screen with two choices.
Explore with demo data. One click loads sample logs and demo dashboards, and drops you into the product. You can search, filter, try dashboards and monitors, and test integrations against the sample data before you send anything of your own. Good for looking around first. You can always switch on your own data later.
Send your own data. This takes you to the setup hub, where you pick how you want to get data flowing.
Three ways to send your data
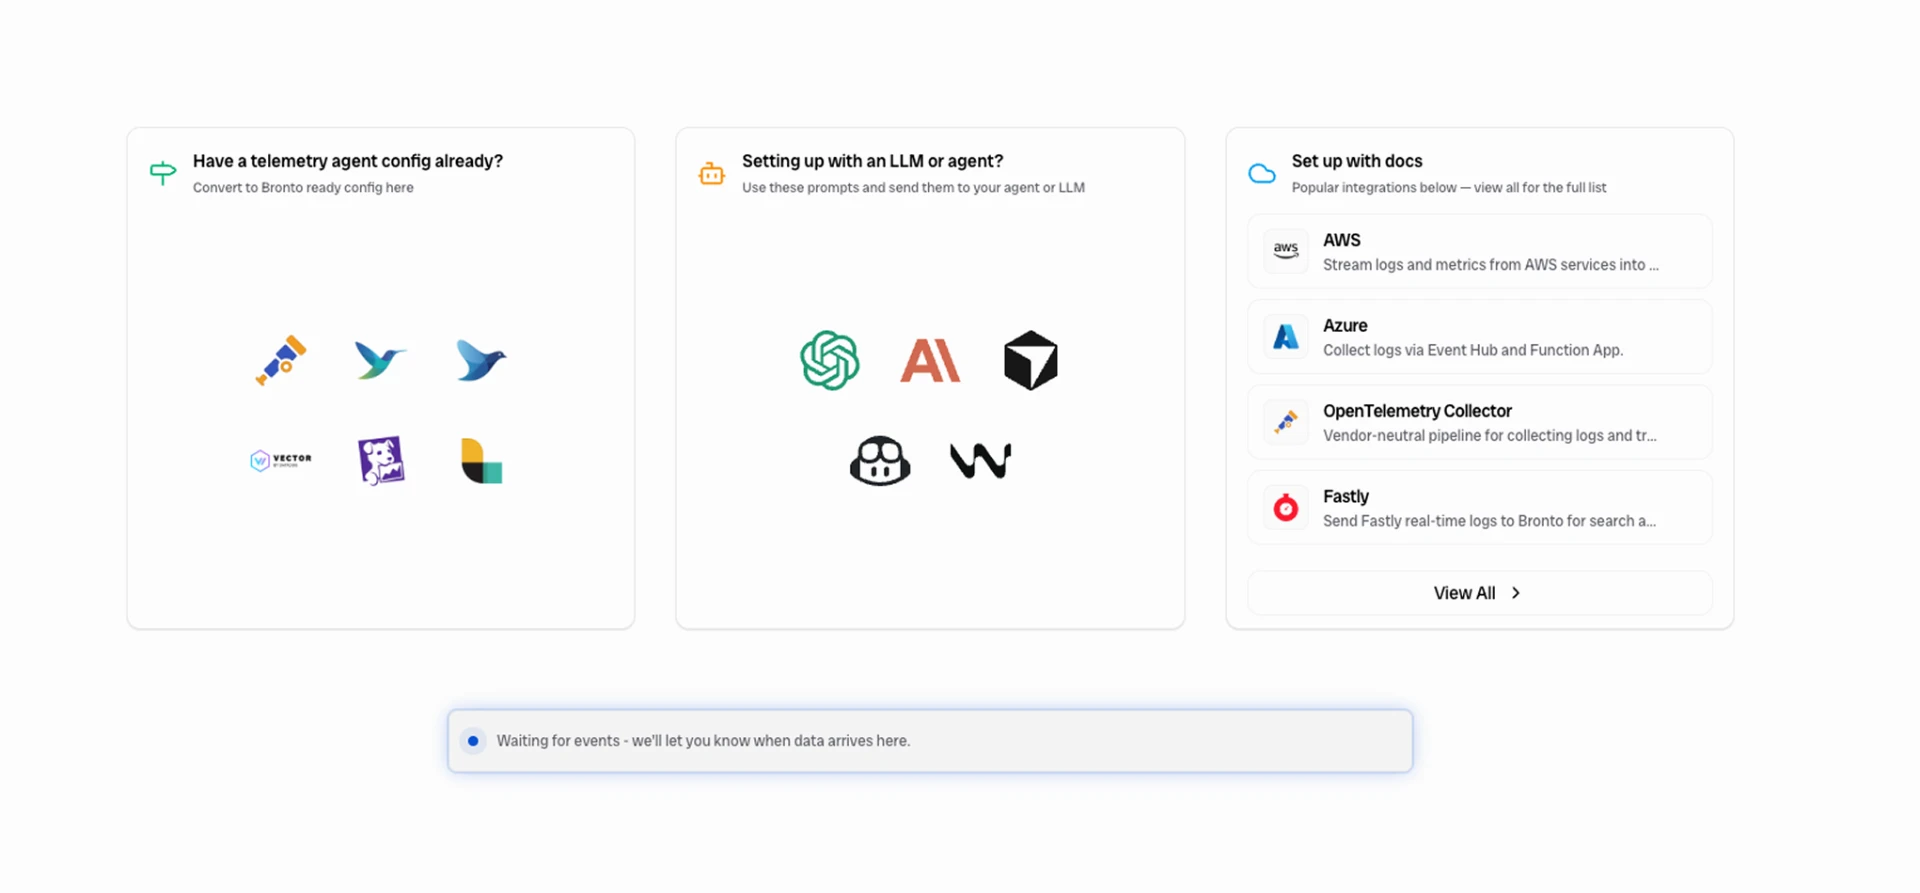
All three end up in the same place. Pick whichever matches how you already work.
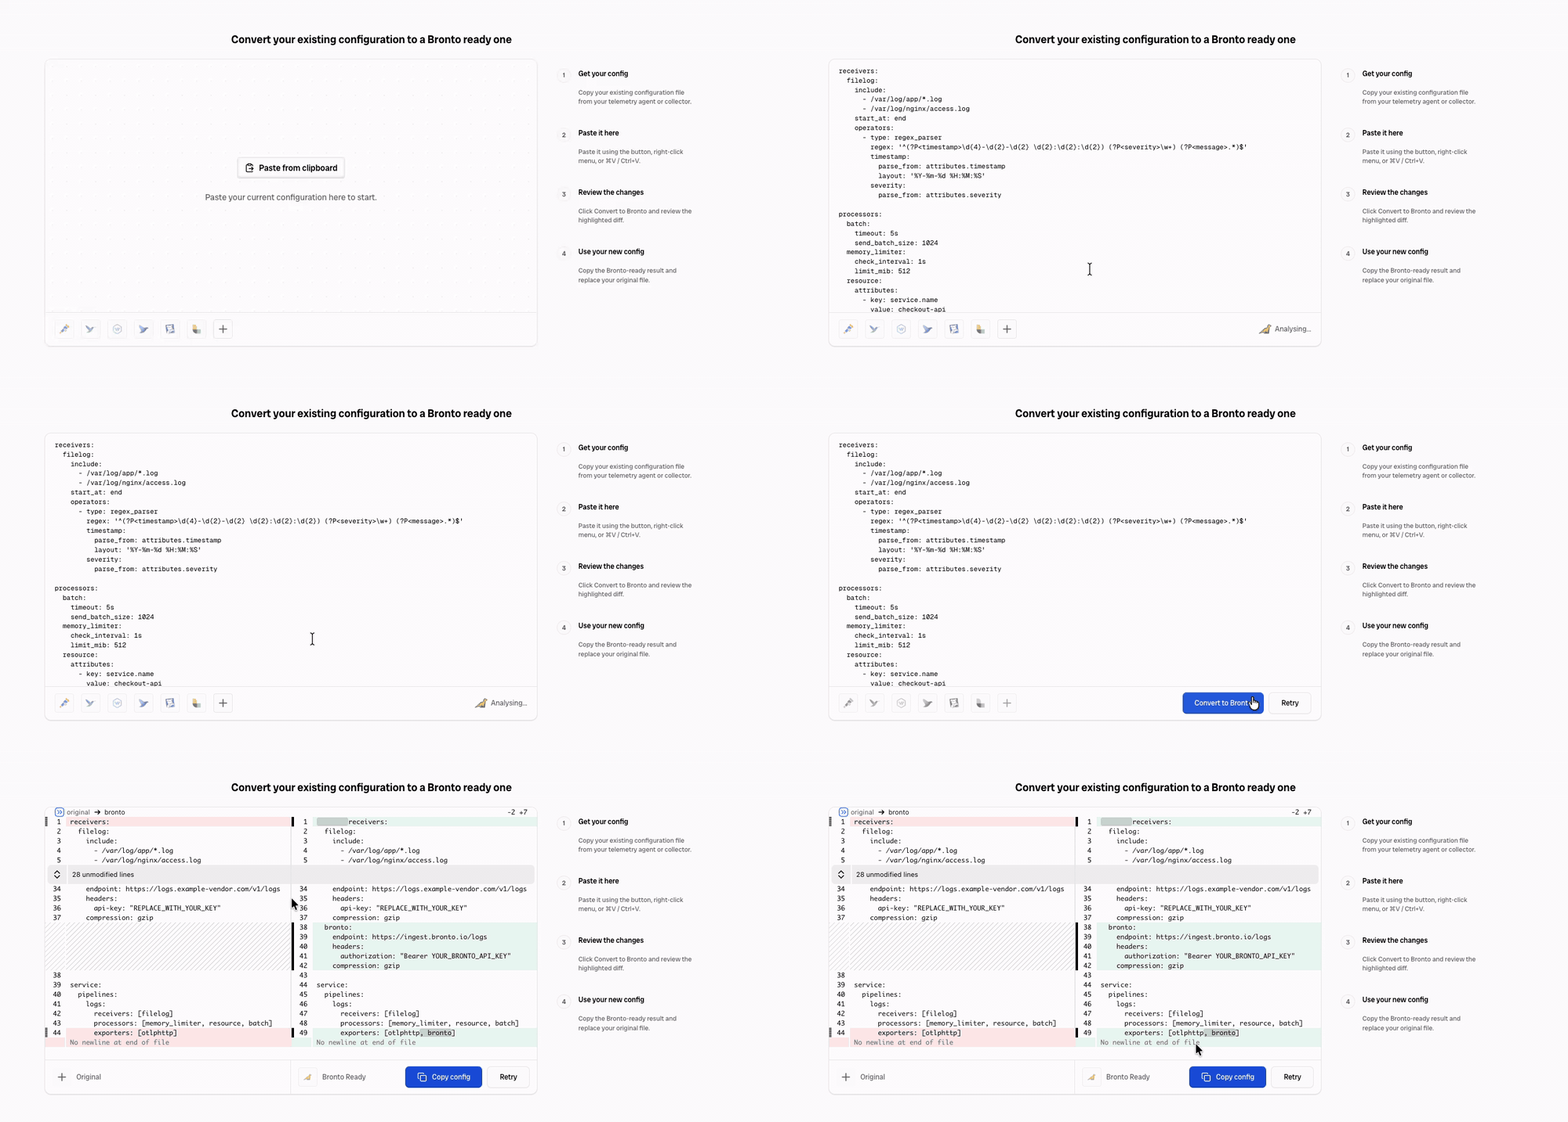
Paste an existing config. If you already run OpenTelemetry, Fluent Bit, Fluentd, Vector, the Datadog Agent, or Logstash, paste your current config in. Bronto detects the agent type, converts it, and shows you a side-by-side diff of the original and the Bronto-ready version. Copy the result, drop it into your setup, restart the agent. No manual rewrite.
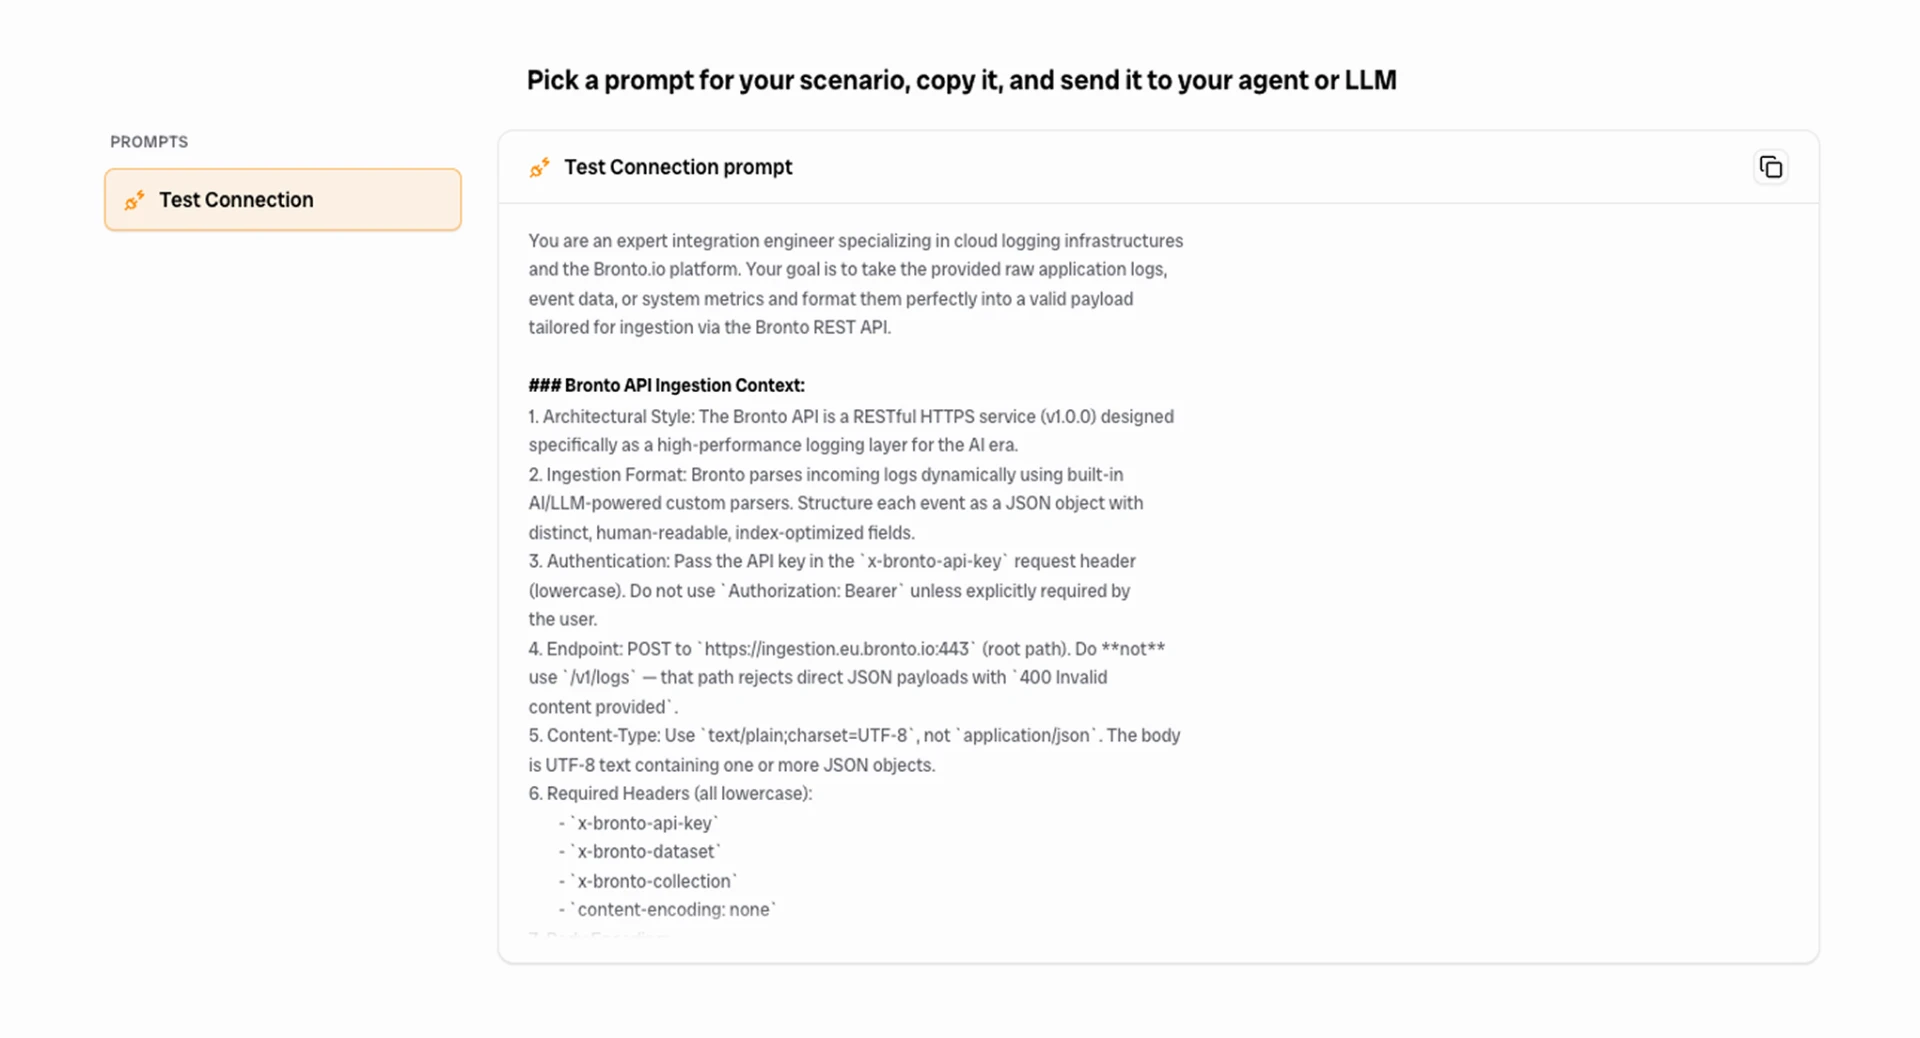
Use your coding agent. If you're setting up with Cursor, Claude Code, Windsurf, GitHub Copilot, or ChatGPT, copy a ready-made prompt and let the agent do the wiring. Today there's a Test Connection prompt that teaches your agent exactly how Bronto ingestion works so it can send and verify a test event. More prompts for full setup are on the way.
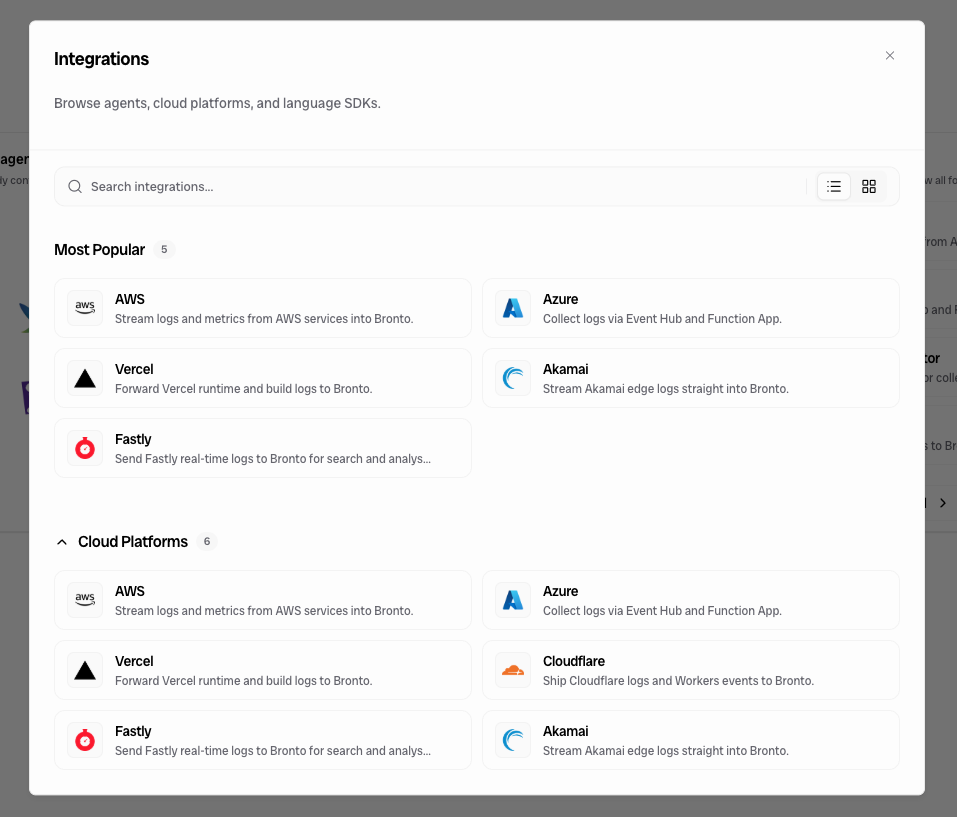
Follow the docs. The in-app catalog links straight to setup guides for cloud platforms, agents, and language SDKs, from AWS and Azure to Python, Go, and Node. Each one opens the right guide, and if your source isn't listed you can request it.
Whichever path you pick, the setup hub gives you an API key, copy-paste snippets to send a test event, and a live view of your logs arriving in real time so you can confirm things are working.
Structured before you enter
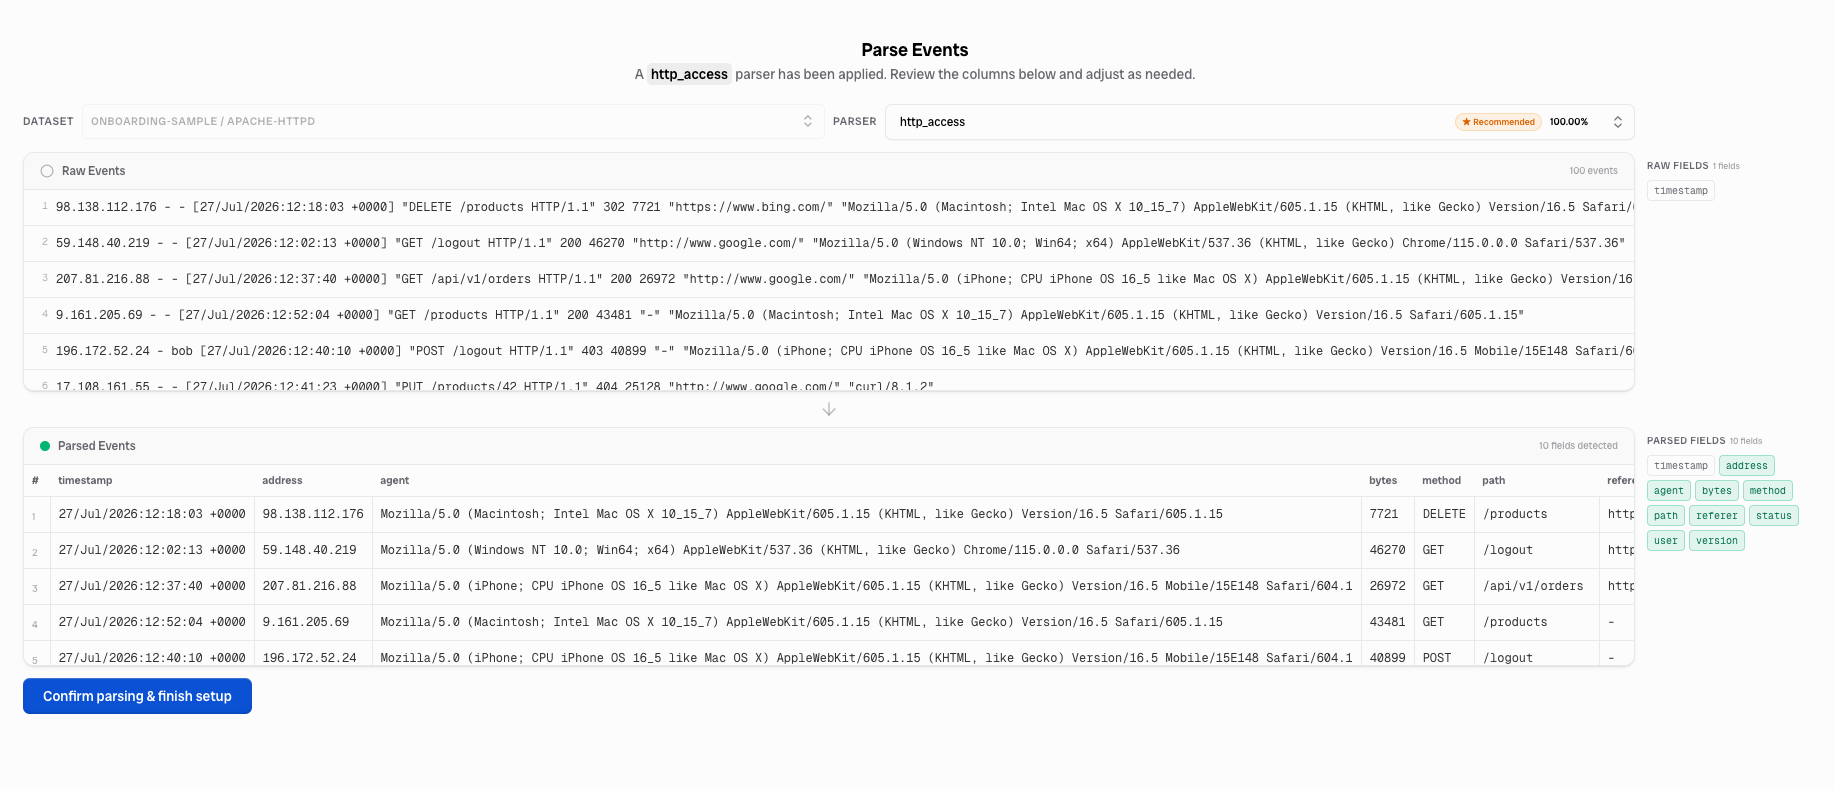
When approximately one hundred events have arrived, Bronto has enough to work with and analyzes your log format.
It detects the right parser and shows you a preview so you can confirm the fields look correct. If auto-detect doesn't land it, you can pick a parser yourself, or have Bronto generate a custom one from your own sample events. Either way, you review the parsed output before anything is committed.
This is the part that matters most. It means you don't walk into a pile of raw, unsearchable log lines. Your data is structured into real fields from the start - and you didn't have to write a single parsing rule to get there.
Templates for known formats
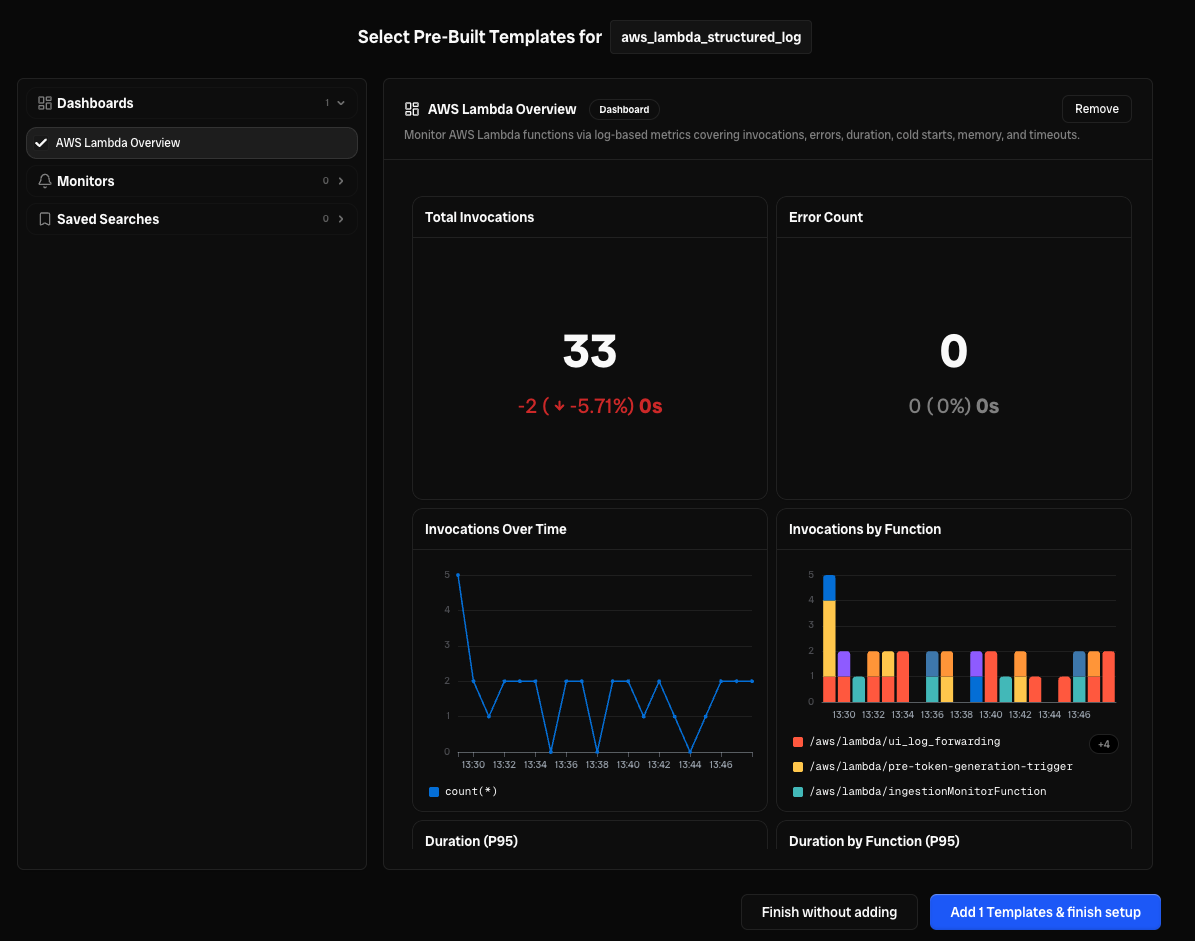
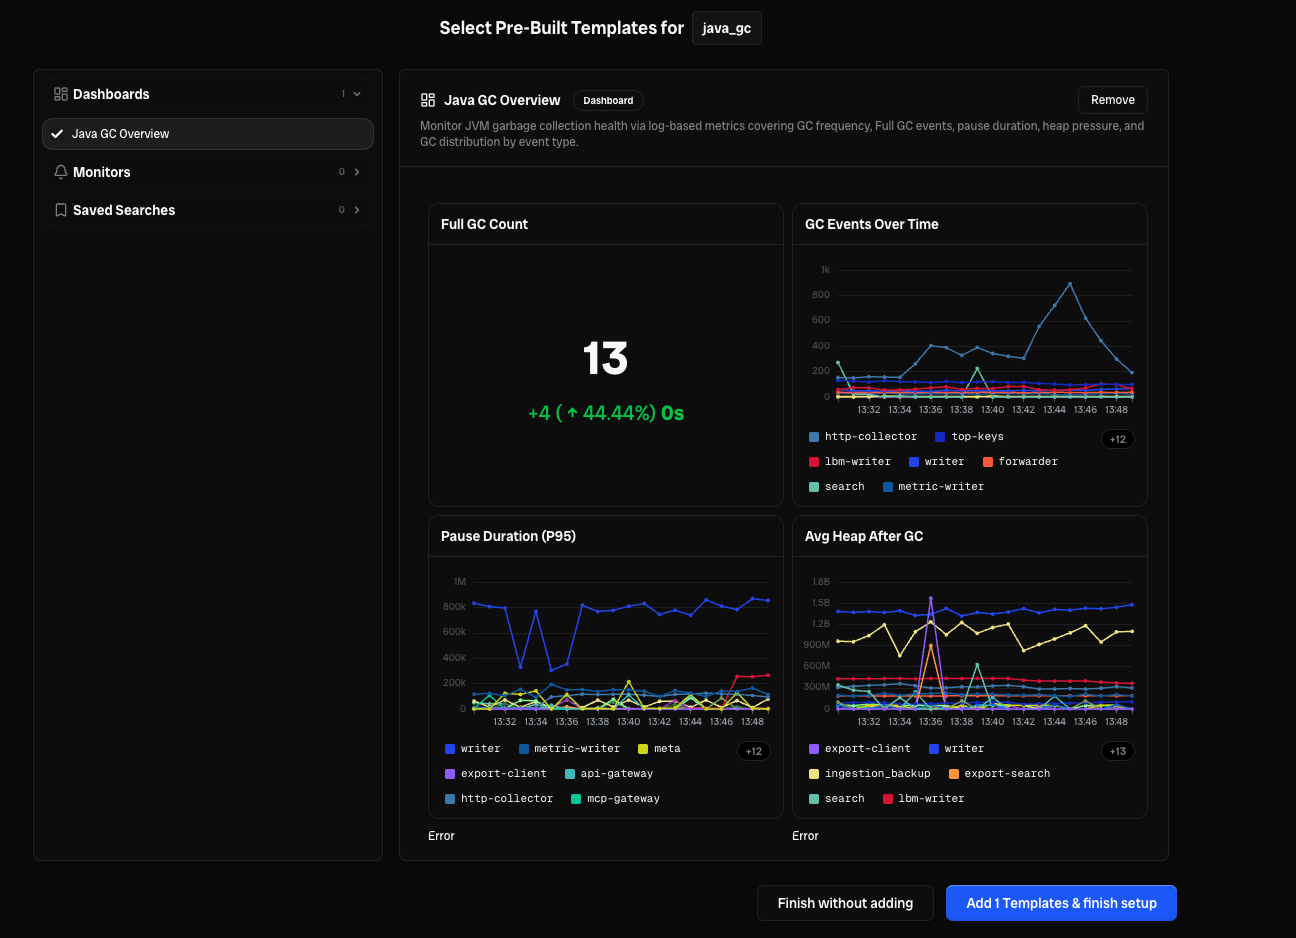
For recognized log types, Bronto goes one step further and offers prebuilt dashboards, monitors, and saved searches matched to your format. Send Apache access logs, for example, and you'll be offered a set built for exactly that.
Preview them, pick the ones you want, and add them in one go. So instead of a blank product, you arrive with dashboards that already reflect your data and monitors already watching it.
And you're in
From there you land in My Data with everything set up: your datasets and logs, dashboards, saved searches, and monitors, plus full navigation and search. If you skipped a step, or want to send more data later, setup is always one click away.
Parsing and templates are optional, so you can exit early and explore whenever you like. But go the whole way through and you enter Bronto already set up - data structured, dashboards live, monitors watching - and you built almost none of it yourself. Minutes from sign-in to real value, with the work done for you along the way.

Try Bronto free for 14 days
Centralize your agent and infrastructure telemetry in one platform with sub-second search and 12-month hot retention. No credit card required.