
One (SQL) Filter to Rule Them All
Mati Remi
Head of Design and CX
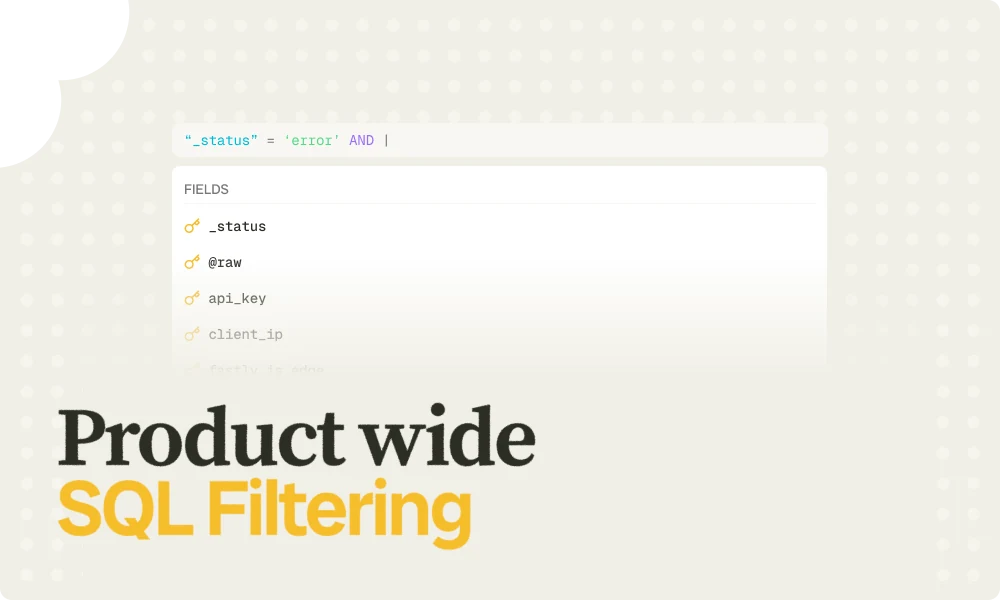
Filtering logs should feel as easy as describing the problem. But for a while, Bronto had two filtering modes to handle such diverse users: a simple point-and-click builder and a SQL editor. The simple builder was approachable but started to hit a ceiling once your queries got more complex. The SQL editor was powerful but felt like an advanced setting you had to opt into. Users often started in simple mode, hit its limits, then had to context-switch mentally and physically to get the query they actually wanted.
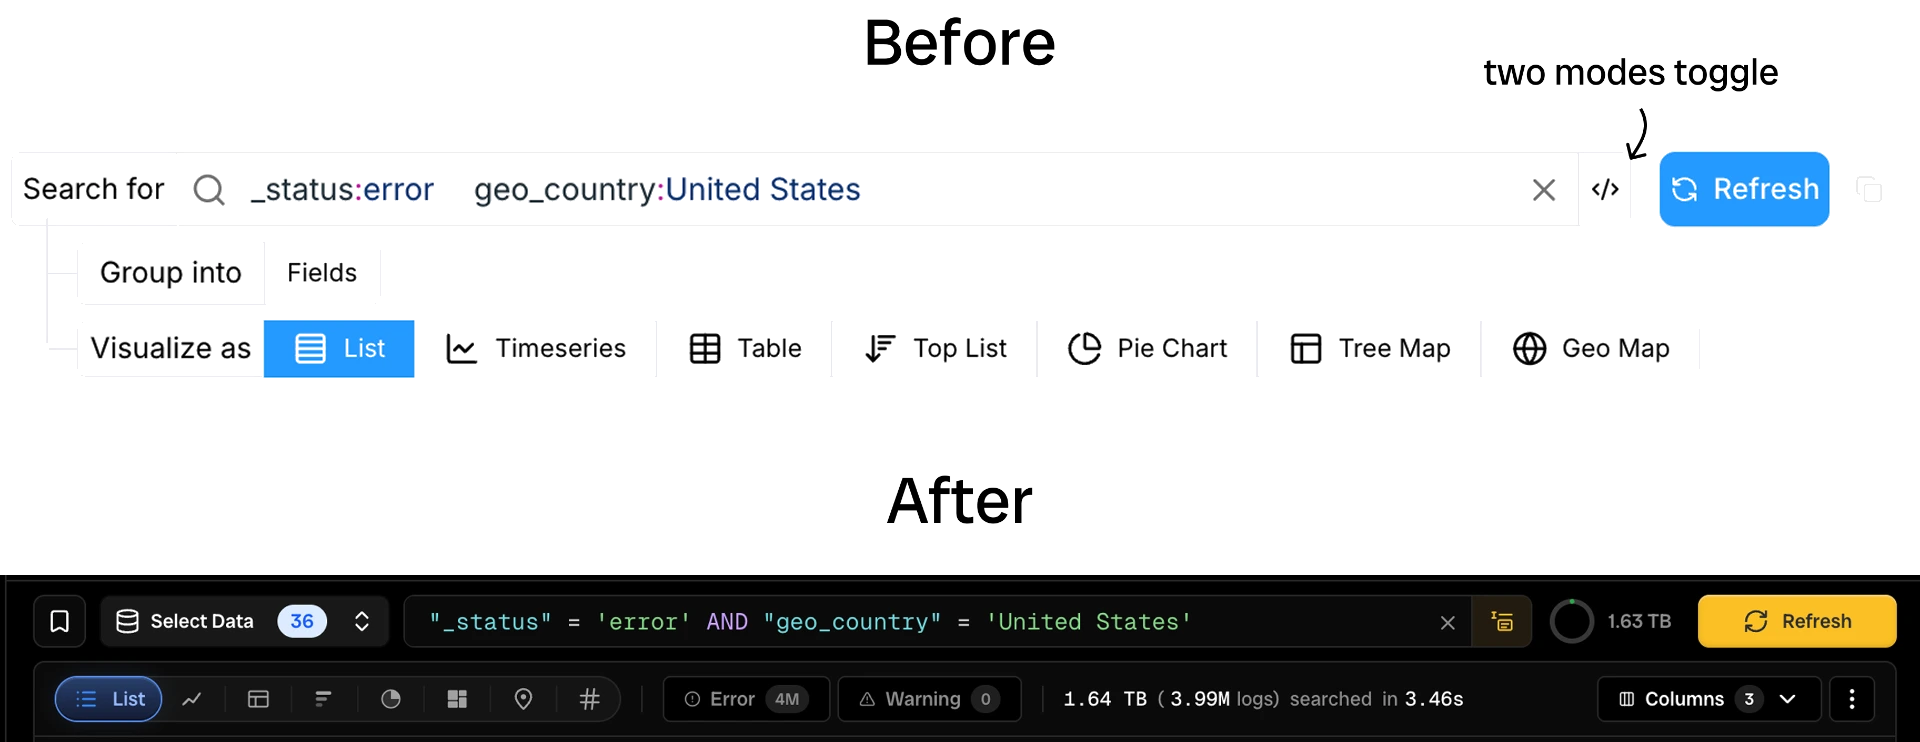
So we made a call: one mode, done well. And that same mode now works consistently across every part of Bronto: Log Search, Traces, Metrics, Dashboards, and Monitors.
SQL, but made easy
The new filter is a single text input that accepts SQL-style expressions, specifically the WHERE clause part (no SELECT, no FROM, no joins). You just write the conditions that describe the log events you care about.
If you've written SQL before, you'll feel at home immediately. Even if you haven't, there are really only three things to learn:
| Rule | Example |
|---|---|
| Field names go in double quotes | "status", "service.name" |
| Text values go in single quotes | 'error', 'checkout' |
Combine conditions with AND, OR, NOT | "status"=500 AND "service"='checkout' |
Numbers don't need quotes and keywords aren't case-sensitive. That's all you need to write a real, useful filter on day one.
Here are a few more examples to show how far you can take it:
The editor helps as you go
The editing experience is built to reduce friction, with a powerful autocomplete feature, especially for users who are new to Bronto or new to SQL filtering.
Autocomplete works in both directions. You can start typing a field name and see matching fields from your data. You can also start from what you know: type a raw value like 621943400, and Bronto will surface every field in your data that contains that value as a ready-to-use filter expression, like "deviceId"=621943400. Start from a status code, an ID, or a keyword, and Bronto tells you where it lives – you don't need to know the schema upfront.
Beyond that, the editor also gives you:
- Operator completions relevant to the field type you've selected
- Quick filter pairs pulled from your live log data, so you can pick rather than type
- Keyboard-first navigation, so you can build a complete filter without touching the mouse
- Inline validation that flags unclosed quotes, mismatched parentheses, or incomplete expressions before you run the search
Your data is always searchable, even custom formats
The autocomplete works so well because Bronto parses your logs before you ever write a filter, providing keys and values from your logs. Structured formats like Apache, Syslog, HAProxy, IIS, and key-value logs are parsed automatically out of the box, making every extracted field immediately available as a suggestion.
For custom or proprietary log formats, Bronto uses an AI-powered parser to infer structure from your raw logs and extract meaningful fields automatically. Whether your logs follow a standard format or something entirely home-grown, the fields show up in autocomplete as if they'd always been there.
As a result, suggestions feel grounded in your operational reality rather than generic. When you start typing "pay" you're not guessing. Bronto will show you fields that actually exist in your data.
The same filter, everywhere
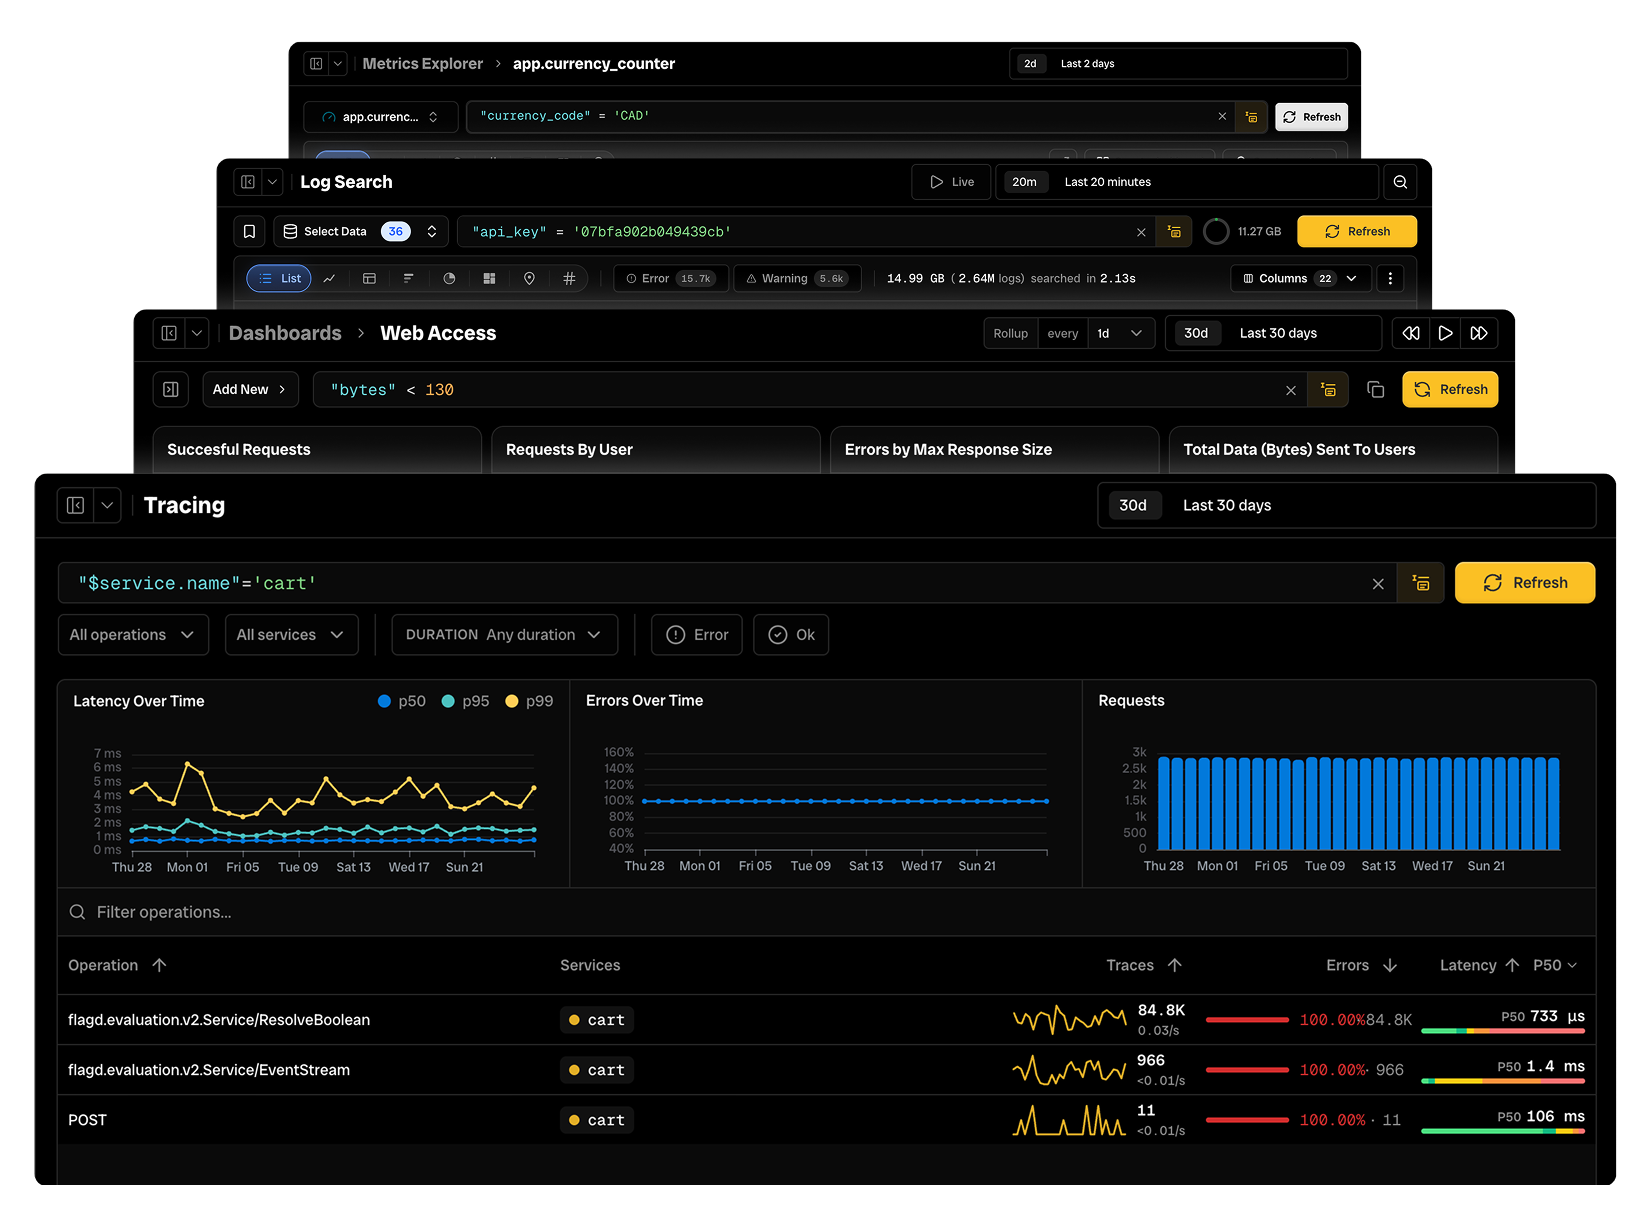
The same SQL filter input, with the same syntax and autocomplete, is available across all of Bronto's core surfaces:
- Log Search — narrow which events appear in your results
- Traces — filter spans and trace data exactly as you would logs
- Metrics — scope metric queries down to the signals that matter
- Dashboards — scope an entire dashboard view in one expression
- Monitors — define exactly which events count toward your alert
- Widget builder — filter the data going into any individual chart
Learn the syntax once and use it everywhere, with the same UI. There's no translation layer between exploring in Log Search, investigating in Traces, and setting up a Monitor. For teams that want to go further, the same SQL syntax works in the Bronto API. The search endpoint accepts a where parameter that takes the same filter expressions you write in the UI, so queries you build while exploring can be automated, embedded in scripts, or used to power external tooling without any translation. See our API reference for more details.
How this compares
In contrast, competitor approaches each have real costs. Grafana splits the problem across three purpose-built languages – LogQL for logs, TraceQL for traces, PromQL for metrics – which means three syntaxes to learn, three mental models to context-switch between, and correlation that happens in Explore view rather than in a single query. Dash0 bets the other way: PromQL as a universal language across all signals, which is powerful for rate/counter math and SLO alerting, but raw log and trace exploration drops back to a separate visual interface, and synthetic metrics carry a 30-day retention cap with query performance that degrades on longer time ranges. We think the right answer for a log-first platform is one language, everywhere, and SQL is the one that's already in every engineer's head.
Getting started
Open Log Search and try a filter. The editor pre-fills with a starter example:
Replace those values with fields from your own data. The autocomplete will guide you. From there, layer in OR, NOT, LIKE for pattern matching, or IS NULL to catch missing fields. If anything looks off, the editor will flag it before you run the search.
Start with one condition; add AND when you need more or use parentheses when logic gets complex. The same filter works whether you're exploring, building a dashboard, or setting up an alert.
We started this blog outlining how hard it is to build a query UI for users of different capabilities – this blog has shown how we have built a new query UI where autocomplete makes it easy for less experienced users, while still offering the richness of the query to more advanced users. The best way to understand it is to use it. Open Log Search, start typing a field or a value, and let the autocomplete show you what's there. We'd love to hear your feedback.

Try Bronto free for 14 days
Centralize your agent and infrastructure telemetry in one platform with sub-second search and 12-month hot retention. No credit card required.