
Sending Claude Platform Traces to Bronto with the Magic of OpenTelemetry
Severin Neumann
Head of Community
Anthropic's new OpenTelemetry export for the Claude Platform is vendor neutral, so Bronto supports it from day one, with the same data as Anthropic's design partners and no integration to build. Here's why that matters, how to set it up, and what we learned tracing it end to end.
On October 14, Anthropic announced OpenTelemetry export for the Claude Platform (in beta), and Bronto customers can use it today. We didn't build an integration. We didn't need to: the export is OpenTelemetry, which is vendor neutral by design! And that's big. For years, the promise of OpenTelemetry has been that you instrument once and send the data anywhere. Here, one of the most important AI platforms shipped its observability on that promise, and on launch day a vendor that wasn't among the invited partners gets exactly the same data as the ones that were. No special deal, no plugin, no waiting for a spot on someone's roadmap. That's vendor neutrality working, in the wild, on day one.
Anthropic also invited a handful of observability vendors as design partners, and they appear as named providers in the Claude Console's destination picker. That's a good call, and kudos to everyone involved: building a feature like this with partners is a lot of work, it catches rough edges before launch, and those vendors earned their spot. What makes the launch great for everyone else sits right next to them: Custom, which sends the same OpenTelemetry spans to any OTLP/HTTP endpoint. A named entry makes setup a little smoother; the data underneath is the same for everyone. And if you change your mind later, you change a destination, not your code.
Custom is all Bronto needs. Our entire launch-day effort was a page in our docs, Claude Platform observability with OpenTelemetry, and the 36-second setup video below:
Half a minute of setup buys you a lot. With agents, what matters happens between request and answer: which tools the model called, with which arguments, which call failed, how many model runs it took, where the time went. The Claude API and SDKs now trace all of it for Messages API requests, tool use and Managed Agents sessions, with timing, token usage and, optionally, prompts and responses. The spans follow the OpenTelemetry GenAI semantic conventions, so they sit next to the rest of your telemetry.
So much for the announcement. If you're anything like me, you'd rather get your hands dirty than read about it, so let's: a plain curl request first, then SDK and API spans joined into one trace, then an on-call copilot whose traces caught a bug its output hid. The code is in the On-call Copilot lab (Apache-2.0, make demo).
Step 1: Point the Claude API at Bronto
Spans come from two places. The first is Anthropic's side: the Claude API pushes spans to a destination you set in the Console, for any client (SDK, curl or the Console playground), with no code changes. They show what only the server sees: each model run, server tools such as web search and code execution, and Managed Agents turns, down to the commands the agent ran in its sandbox.
In the Claude Console, open Settings → OpenTelemetry → Add destination (org admin role required):
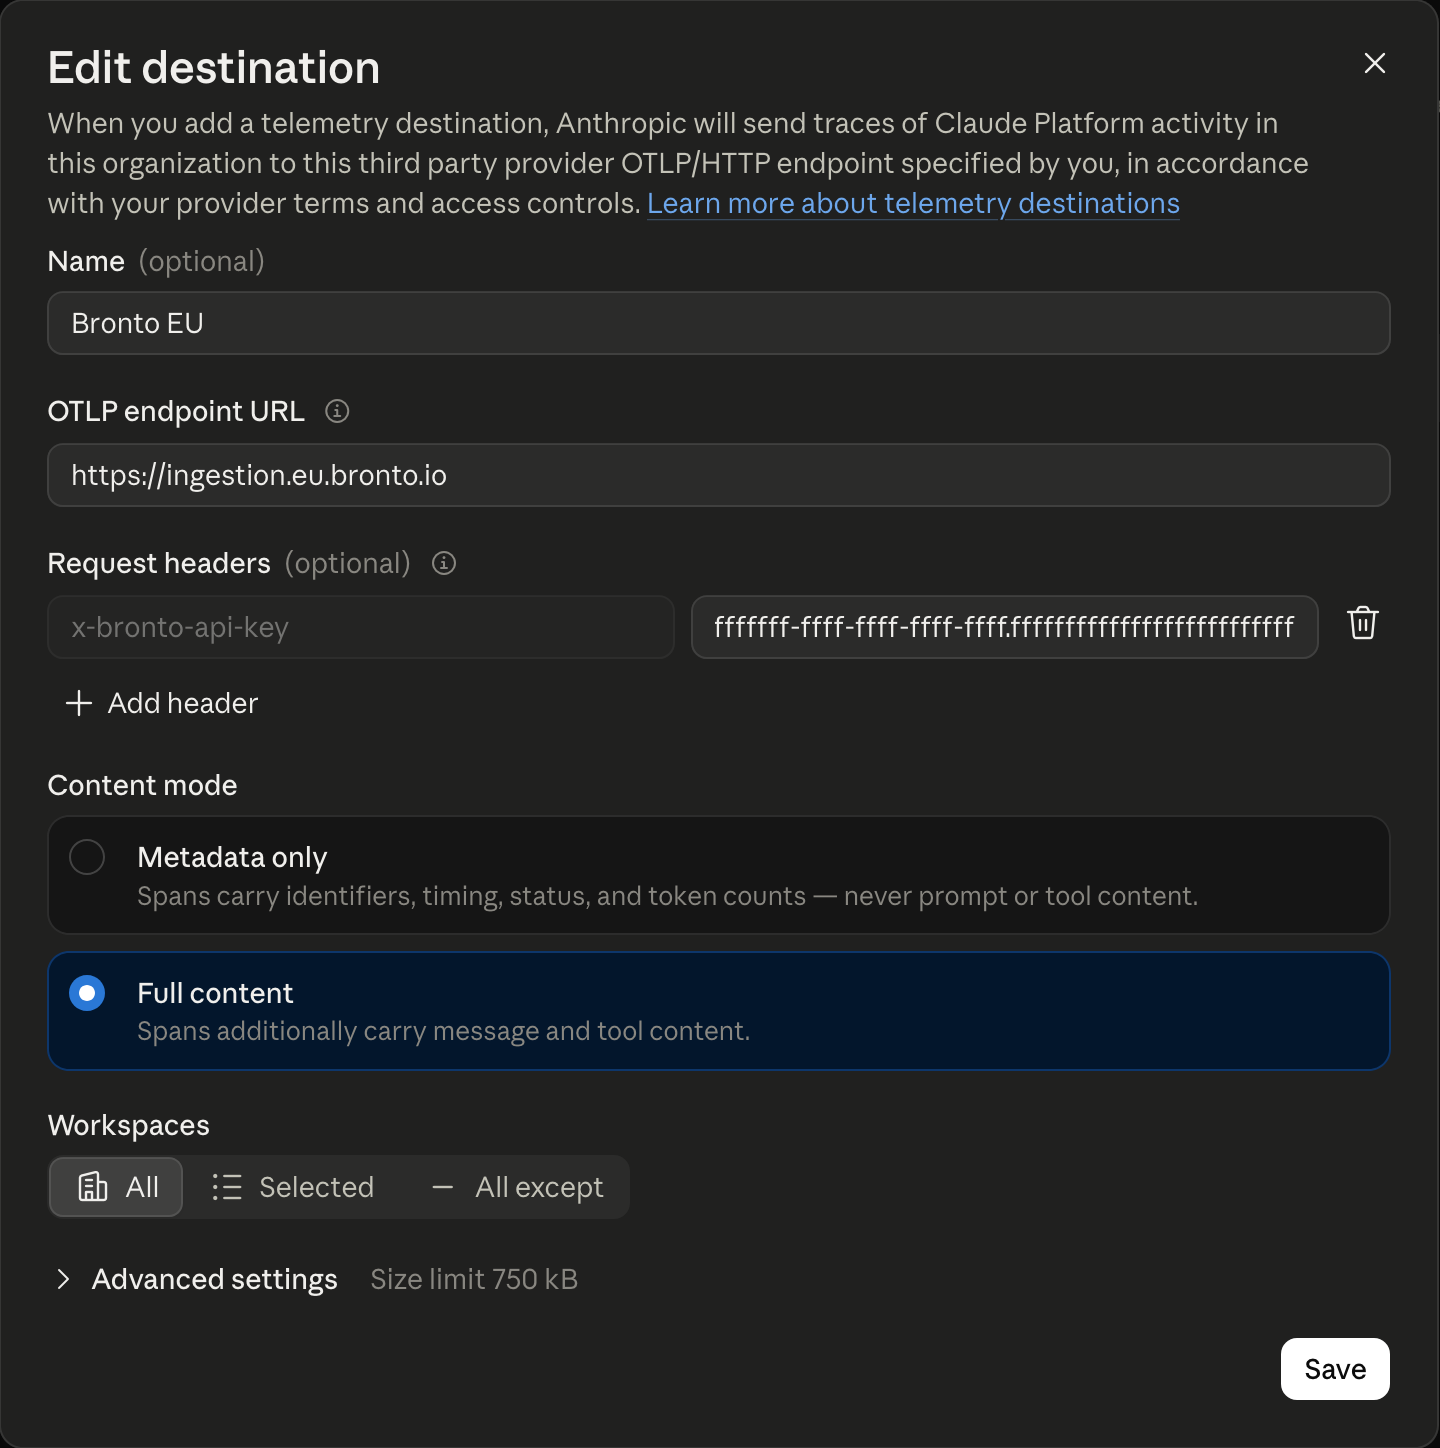
Provider: Custom
OTLP endpoint URL:
https://ingestion.eu.bronto.io(oringestion.us.bronto.io)Request header:
x-bronto-api-key, set to a Bronto API key with the Ingestion roleContent mode: Metadata only (default) or Full content, which adds prompts, responses and tool arguments
Enter the base URL. The API appends /v1/traces itself, so a URL ending in /v1/traces becomes /v1/traces/v1/traces and fails with a 404. (Your app's exporter is the opposite: OTEL_EXPORTER_OTLP_TRACES_ENDPOINT takes the full path.)
Bronto ingests the API's gzip-compressed OTLP/HTTP directly, so there's no Collector to run. To script the setup instead, our docs have the Admin API call and troubleshooting for each delivery state.
Step 2: The first trace, from curl
No SDK, just curl:
curl https://api.anthropic.com/v1/messages \
  -H "x-api-key: $ANTHROPIC_API_KEY" -H "anthropic-version: 2023-06-01" \
  -H "content-type: application/json" \
  -d '{"model":"claude-haiku-5-5","max_tokens":20,"messages":[{"role":"user","content":"Say hi"}]}'
About a minute later, two spans were in Bronto under service.name = claude-platform:
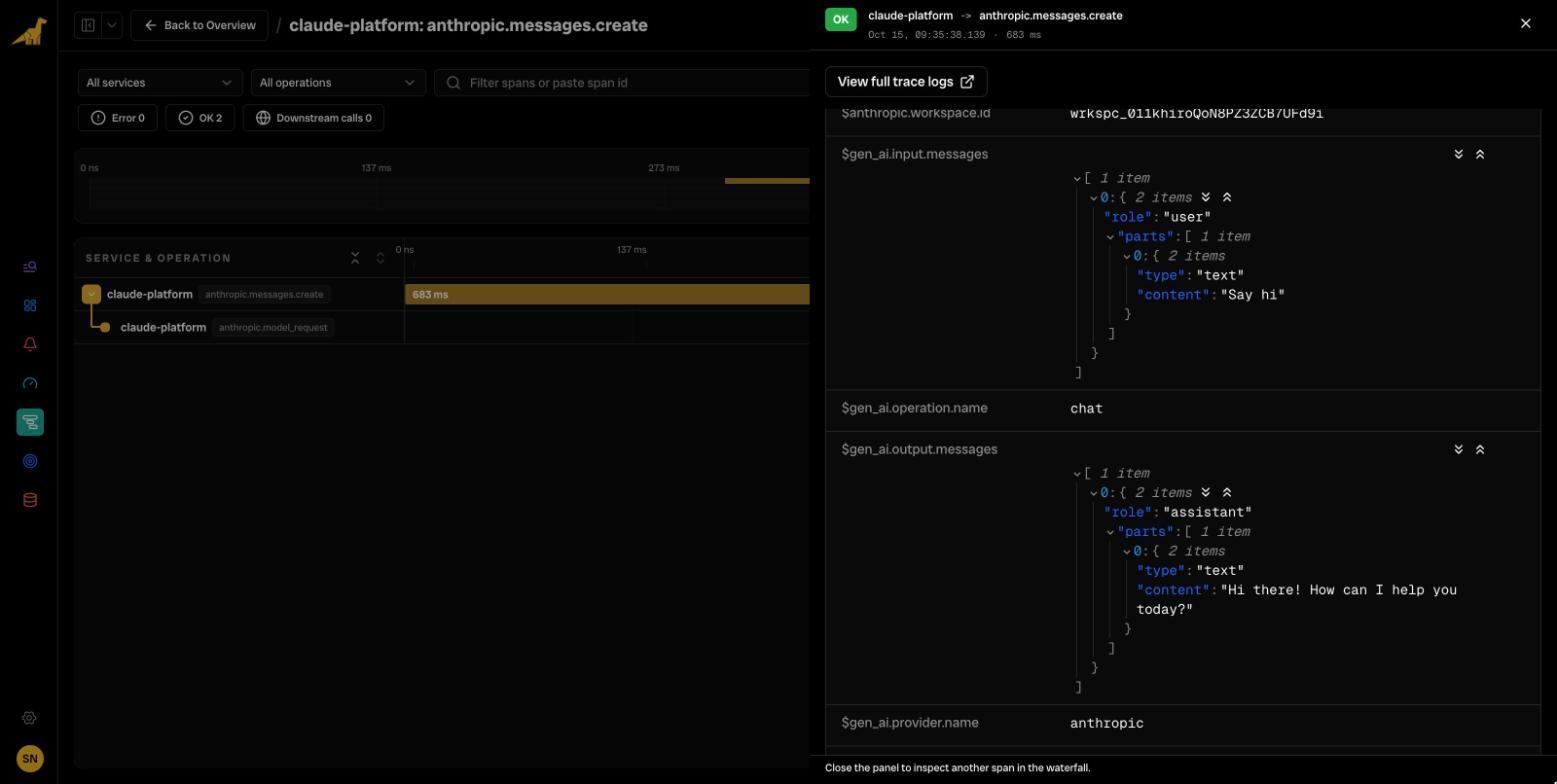
With Full content, the SERVER span holds the whole exchange: gen_ai.input.messages is [{"role":"user","parts":[{"type":"text","content":"Say hi"}]}]. It also has anthropic.request.id, workspace and organisation IDs, the service tier, and token usage including cache reads and writes.
Bronto makes span attributes queryable with a $ prefix, and numeric ones aggregate. Sum $gen_ai.usage.input_tokens and $gen_ai.usage.output_tokens over the model runs, grouped by $gen_ai.request.model, for token usage per model:
"$span.name" = 'anthropic.model_request'Step 3: Add the SDK and get one trace
The second source is your application. The Claude SDK (Python, TypeScript, Go, Java, C#, PHP, Ruby) emits client spans for requests, the tool runner, your own tools and file uploads, through standard OpenTelemetry. Register a tracer provider before the first Claude call and the SDK uses it:
from opentelemetry import trace
from opentelemetry.exporter.otlp.proto.http.trace_exporter import OTLPSpanExporter
from opentelemetry.sdk.trace import TracerProvider
from opentelemetry.sdk.trace.export import BatchSpanProcessor

provider = TracerProvider()
provider.add_span_processor(BatchSpanProcessor(OTLPSpanExporter()))  # reads OTEL_EXPORTER_OTLP_*
trace.set_tracer_provider(provider)

from anthropic import Anthropic
client = Anthropic()  # no tracing code needed
export OTEL_SERVICE_NAME=support-agent
export OTEL_EXPORTER_OTLP_TRACES_ENDPOINT=https://ingestion.eu.bronto.io/v1/traces
export OTEL_EXPORTER_OTLP_TRACES_HEADERS=x-bronto-api-key=<key>
export ANTHROPIC_OPEN_TELEMETRY_TRACES_CONTENT_MODE=content # optional: prompts in SDK spans tooThe SDK sends a W3C traceparent header with each request, and the API attaches its spans to it. Wrap a tool-runner call in your own span, and one trace holds both halves:
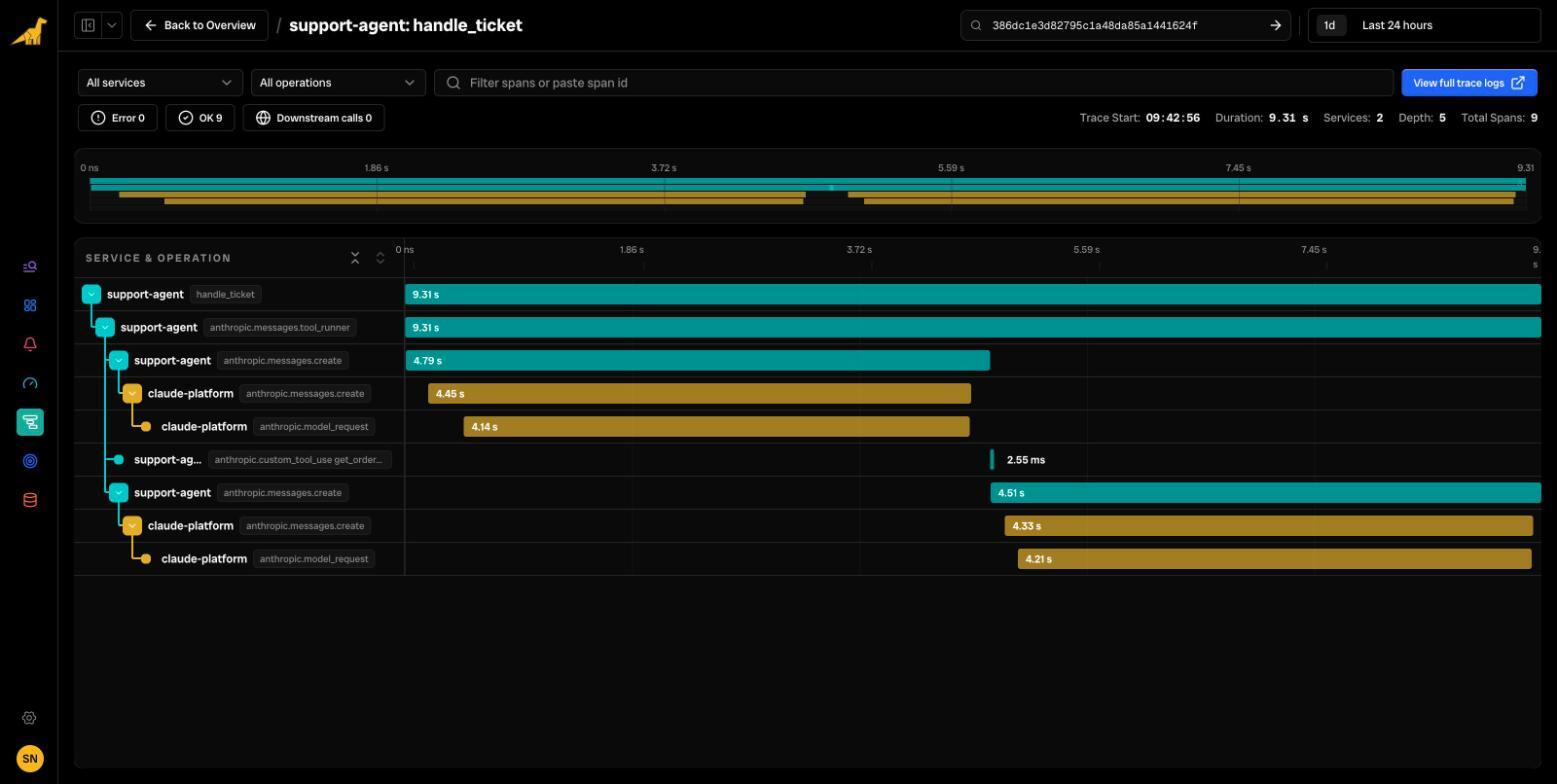
Spans you create inside a tool nest under the tool's span, so your database query shows up exactly where the model asked for it.
Step 4: Build something real, an on-call copilot
Next, an app with a realistic trace shape. An alert fires (CheckoutLatencyHigh), and a FastAPI service, the On-call Copilot, asks Claude to triage it with four tools: recent deploys, log search, latency metrics and the runbook. The data is fake but consistent: a deploy at 06:02 shrank the checkout service's database pool from 50 to 5.
Claude (Opus 5.5, low effort) called all four tools in parallel, then wrote:
Likely root cause: Deploy v2.31.0 cut the checkout DB connection pool from 50 to 5 […] Payments p99 stayed flat at 210–224ms, so payments isn't the bottleneck.
With Full content, the API span shows what the model sent back: four tool_call parts.
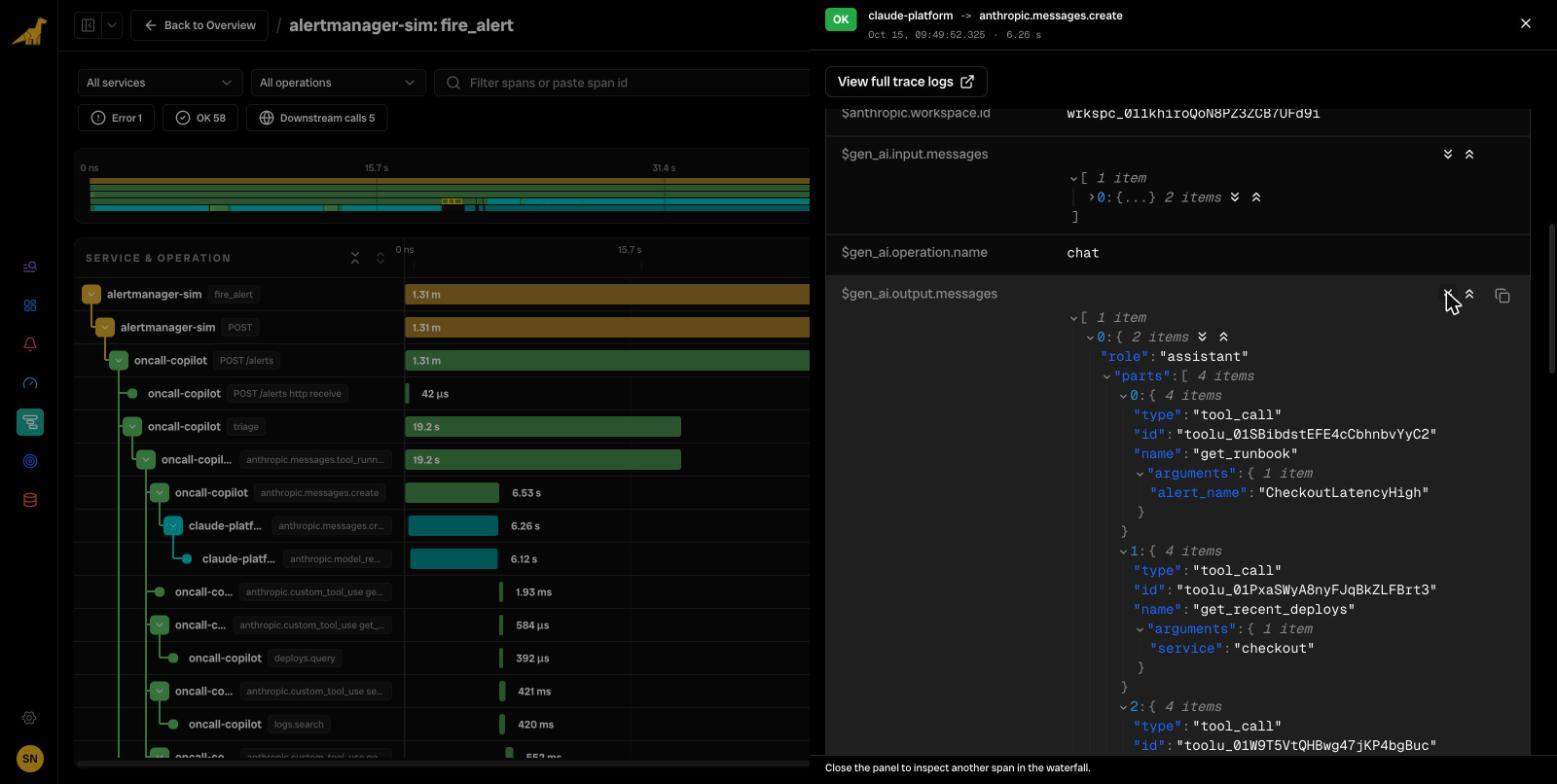
The alert simulator propagates traceparent into the webhook, so it's all one trace across three services (alertmanager-sim, oncall-copilot, claude-platform): 26 spans, about 10 seconds, three model calls, roughly 5k input and 0.8k output tokens.
Then a Managed Agent writes the postmortem. The copilot uploads the latency data with the Files API, starts a session with a hard budget (max_list_cost of $0.50) and serves a custom tool, get_incident_timeline. The agent analyses the CSV with pandas in its sandbox and writes postmortem.md. The trace grows to 59 spans:
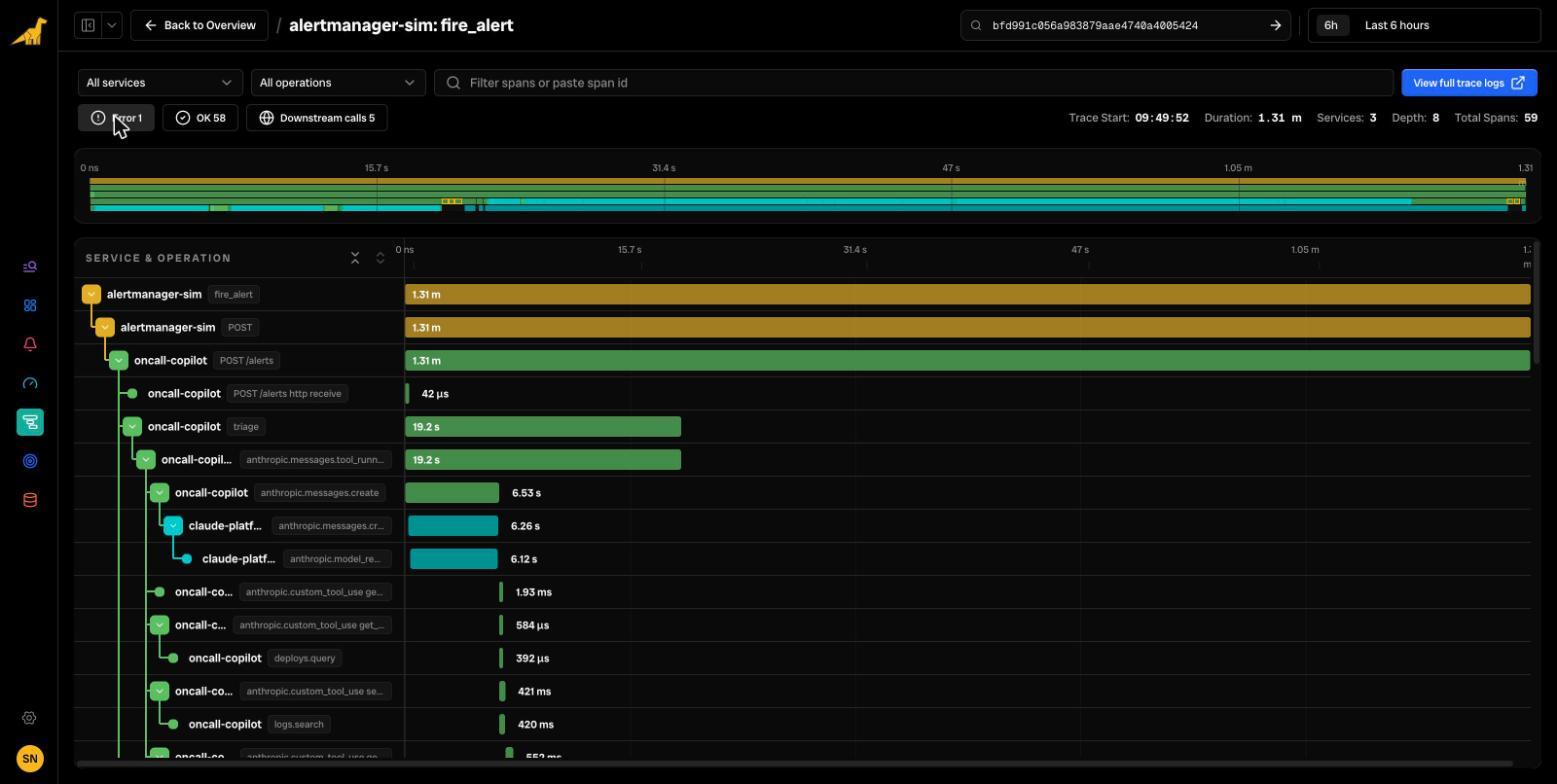
Turn spans carry anthropic.session.id, gen_ai.agent.name, the thread ID (gen_ai.conversation.id) and the stop_reason; requires_action means the agent is waiting on your tool. Sandbox tool spans include anthropic.tool.evaluated_permission, so you can audit the permission policy.
Step 5: The bug the trace found
The first postmortem looked great. The trace didn't.
I had mounted the file with mount_path="/mnt/data/latency.csv", but Managed Agents roots mount_path under /mnt/session/uploads/. The agent searched the filesystem for 12 seconds and spent an extra model run, and the output showed none of it. With the path fixed, the next run read the file first time.
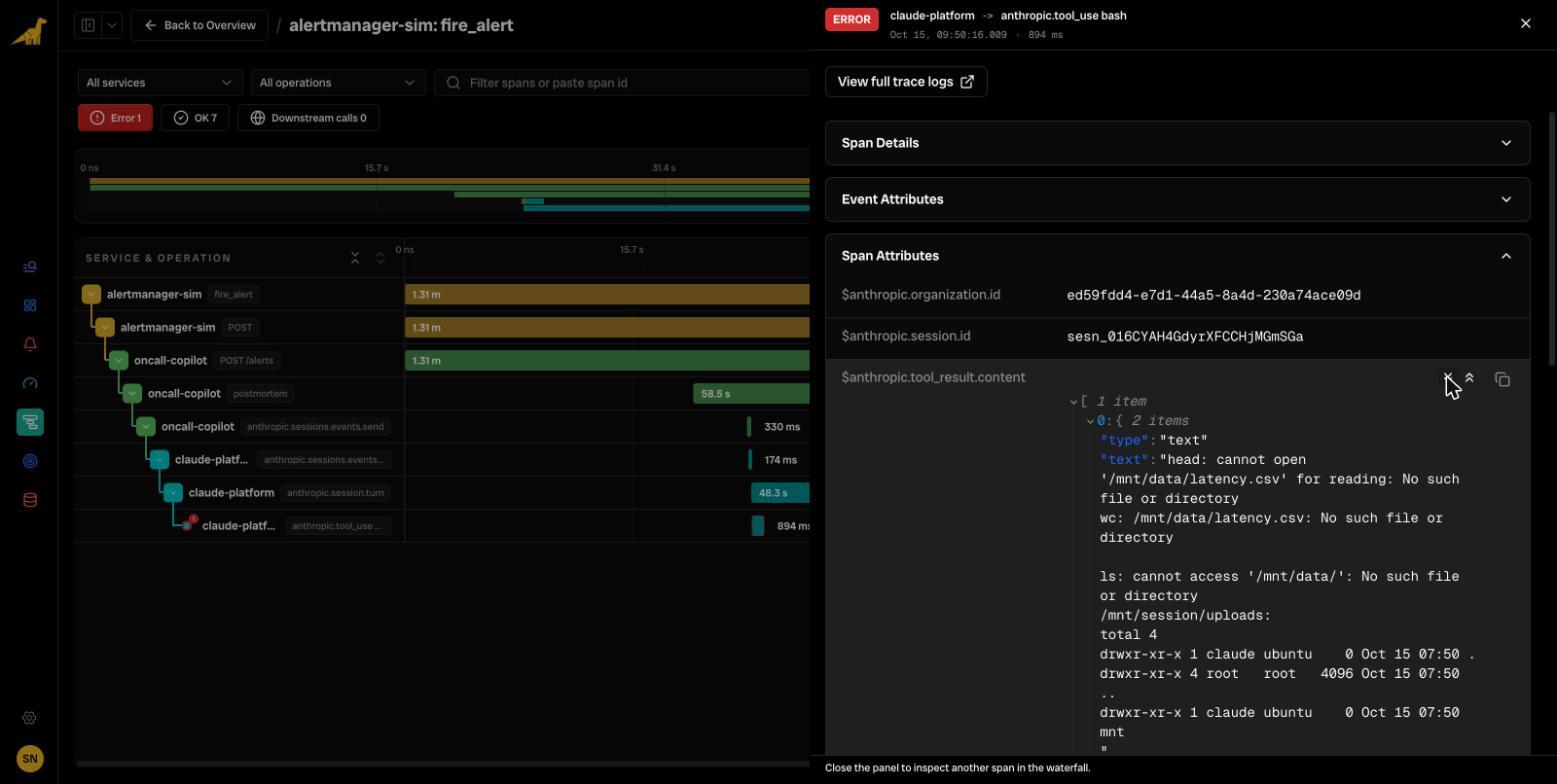
A correct answer can hide a wasteful path. Only the trace shows it.
Step 6: Break it on purpose
make chaos makes the metrics tool time out after 2.5 seconds. The trace shows anthropic.custom_tool_use get_latency and my metrics.query span in ERROR, once per retry, and the answer changes:
Not verified: I couldn't get latency numbers for checkout or payments because the metrics backend timed out.
The trace tells you why the answer is hedged. If the app also exports logs over OTLP, the metrics.query timed out log line carries the same trace_id and sits next to the failing span.
Server-side tool failures look the same. With web_search capped at max_uses: 1, its span came back ERROR with error.type=invalid_tool_input, next to a code_execution span reading "Server tool use limit exceeded".
Things worth knowing
Count tokens once. The SDK CLIENT span, the API SERVER span and each
anthropic.model_requestrepeat the same usage; sum one level (anthropic.model_requestfor API spans). Delivery is at-least-once, so deduplicate on trace and span ID, and use Anthropic's Usage API for billing.agents.create,environments.createand Files API calls only have SDK spans; API tracing covers Messages and Sessions.Content mode is set per destination and per SDK client. The default is metadata only; Full content puts prompts and responses in your backend, under its retention rules.
A session can span traces: in one of my four sessions, an agent turn arrived as its own root. Filter on
anthropic.session.idto see a whole session.It's beta, and span names can change between SDK versions. Pin them.
The API destination needs OTLP/HTTP protobuf on a public HTTPS hostname that answers within 5 seconds.
The Bronto docs cover the full attribute list, queries and troubleshooting.
Try it yourself
You need a Claude API key and an OTLP backend. Bronto has a 14-day free trial you can sign up for here.
git clone https://github.com/bronto-community/claude-otel-lab && cd claude-otel-lab
make setup        # creates a virtualenv and .env: add ANTHROPIC_API_KEY and BRONTO_API_KEY
make demo         # one alert, triaged by Claude (a few cents)
make chaos        # the same, with a failing metrics backend
make postmortem   # plus a Managed Agents postmortem (about $0.25, capped at $0.50)
Or with containers:
docker compose up -d copilot && docker compose run --rm alertEach run prints a trace_id. Paste it into the Trace ID box on Bronto's Tracing page, and use the Error toggle to jump to failed spans. Add the Console destination from step 1 to get the API's half of the trace.
Tried it with your own backend, broke it in an interesting way, or traced something bigger than a fake checkout service? Open an issue or a pull request in bronto-community. I'd like to see what your agents get up to.

Try Bronto free for 14 days
Centralize your agent and infrastructure telemetry in one platform with sub-second search and 12-month hot retention. No credit card required.