
Bronto for Vercel
Store & Search 12 Months of Observability Data
Vercel's observability data is only retained for 30 days. With Bronto, you can keep logs for 12 months, always hot and instantly searchable. Resolve problems faster with high-context data designed for AI investigations.

1. Create a Bronto account
Try Bronto with a 2 week free trial
By signing up, you agree to our Terms of Service and Privacy Policy.
Already have an account? Sign in
2. Install the Bronto Connector in Vercel
Need to fix an error? In Bronto, you can run AI investigations on-demand, automated, or via an MCP server. With all of your data in one place, you can correlate logs, traces, and code without jumping between tools.
Full-stack observability built for the AI era, wired straight into Vercel
Bronto is a full-stack intelligent observability platform built on BrontoDB, orders of magnitude more efficient than legacy tools. No more choosing between blindspots and overstretched budgets, especially as AI workloads push data volumes 10 to 100x higher.
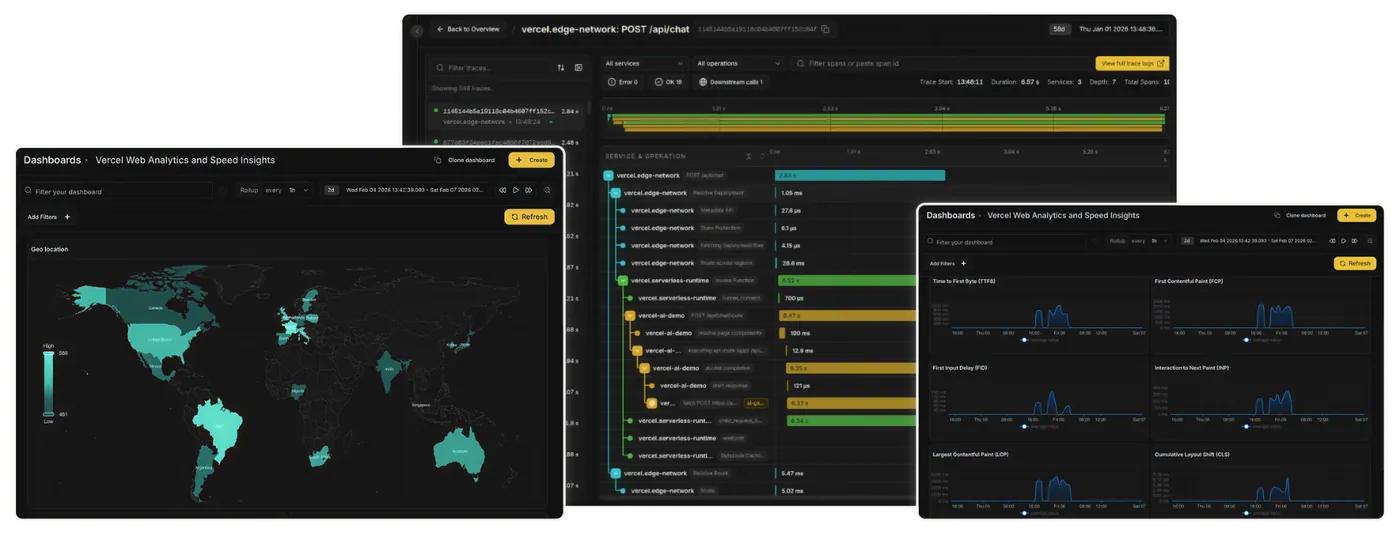
All Vercel drains, one home
Logs, Traces, Speed Insights, and Web Analytics in one place. Correlate Core Web Vitals with backend traces.
Always-hot retention
A full year of Vercel telemetry queryable in milliseconds. No cold tiers, no rehydration.
More cost efficient
Built for AI-era data volumes, without the legacy hot-tier bill.
Sub-second search
Query TBs and PBs of Vercel logs and traces in milliseconds, consistently.
End-to-end correlation
Jump from trace to logs to code in seconds.
MTTR with AI
Every alert ships with an investigation report. Bronto Scope walks you straight to the root cause.
- LogsRuntime logs from your Vercel deployments
- TracesDistributed trace spans across your serverless functions
- Speed InsightsCore Web Vitals and real user performance metrics
- Web AnalyticsVisitor events and page view data
Parsed for AI, by default
gen_ai.system, gen_ai.request.model, gen_ai.usage.*, prompts, completions, latency, and cost arrive structured and queryable without manual instrumentation.- Raw log
[POST] /api/chat 200 fn=us-east-1::chat dur=1284ms "model=gpt-4o tokens_in=842 tokens_out=311 cost=$0.0089"
Parsedgen_ai.system=openaigen_ai.request.model=gpt-4ogen_ai.usage.input_tokens=842gen_ai.usage.output_tokens=311gen_ai.usage.cost_usd=0.0089duration_ms=1284 - Raw log
[POST] /api/agent 200 fn=iad1::agent dur=3421ms "anthropic claude-3-5-sonnet in=1204 out=892 $0.0276"
Parsedgen_ai.system=anthropicgen_ai.request.model=claude-3-5-sonnetgen_ai.usage.input_tokens=1204gen_ai.usage.output_tokens=892gen_ai.usage.cost_usd=0.0276duration_ms=3421 - Raw log
[POST] /api/embed 200 fn=fra1::embed dur=187ms "model=text-embedding-3-small tokens=2048"
Parsedgen_ai.system=openaigen_ai.request.model=text-embedding-3-smallgen_ai.usage.input_tokens=2048gen_ai.operation.name=embeddingsduration_ms=187
Pre-built dashboards in one click
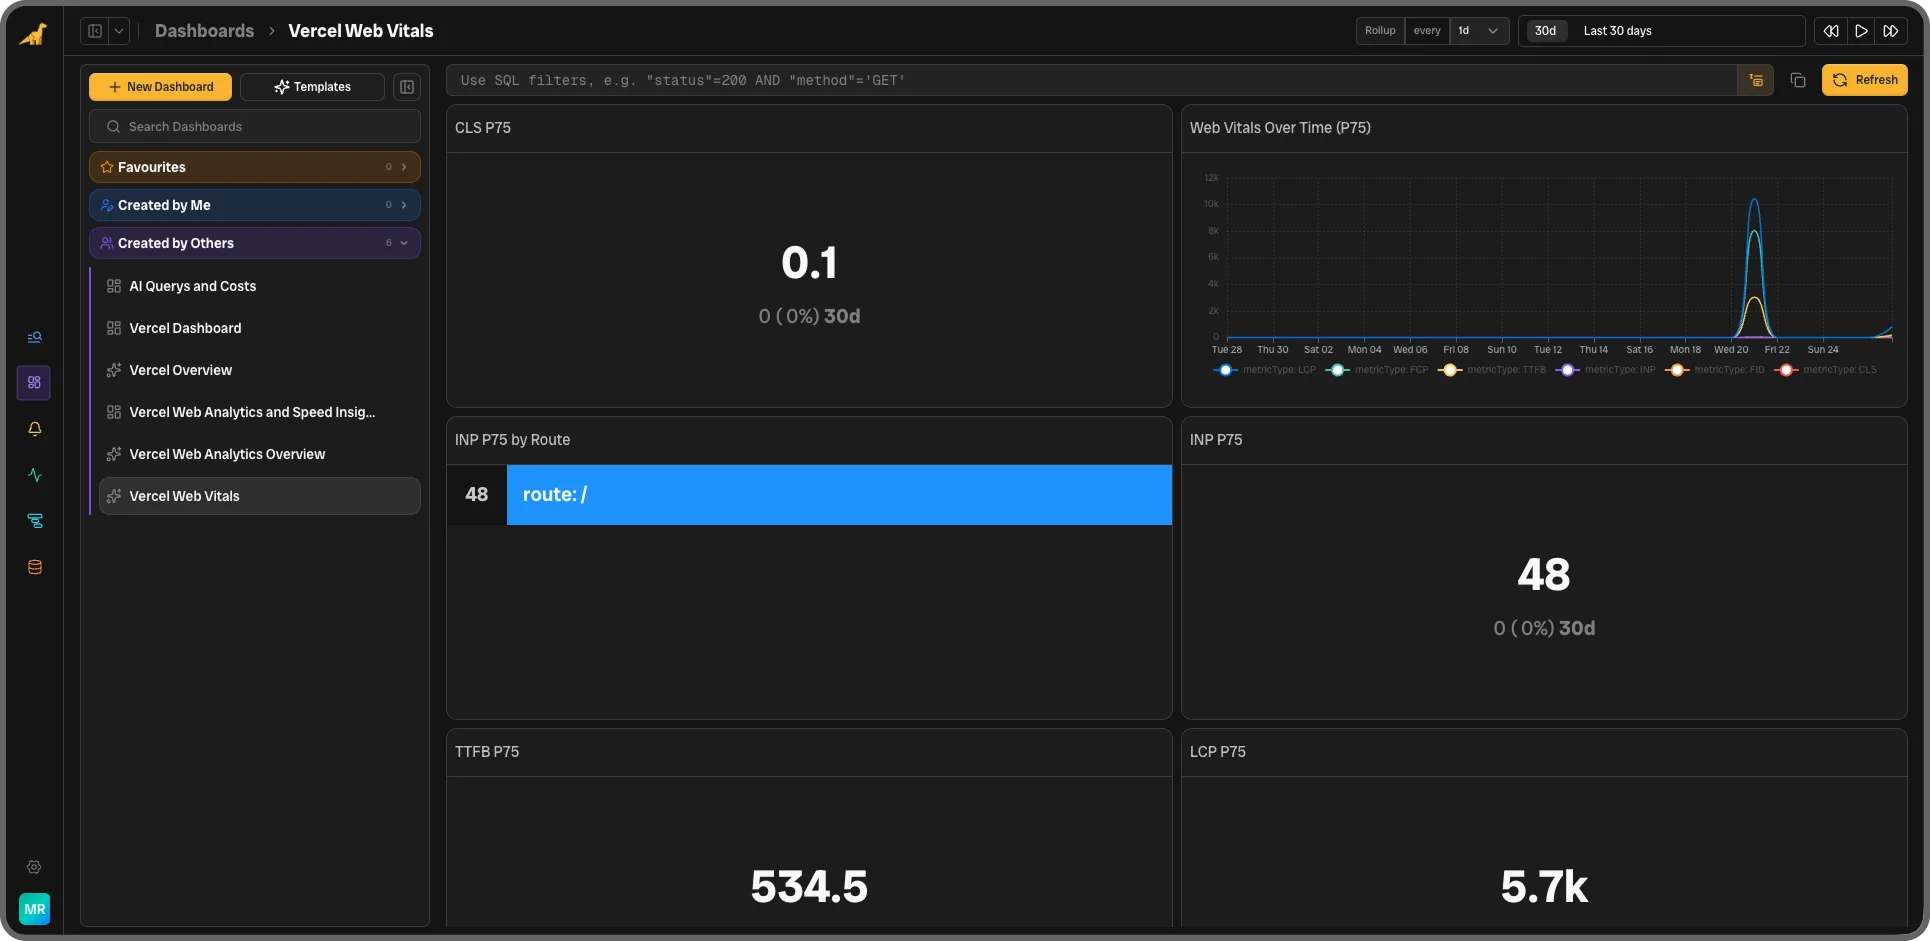
Bronto Express detects which Vercel drains you've connected and provisions the matching dashboards instantly. Each dashboard maps to a different drain type, so you can ship with any subset of Logs, Speed Insights, and Web Analytics.
View in docs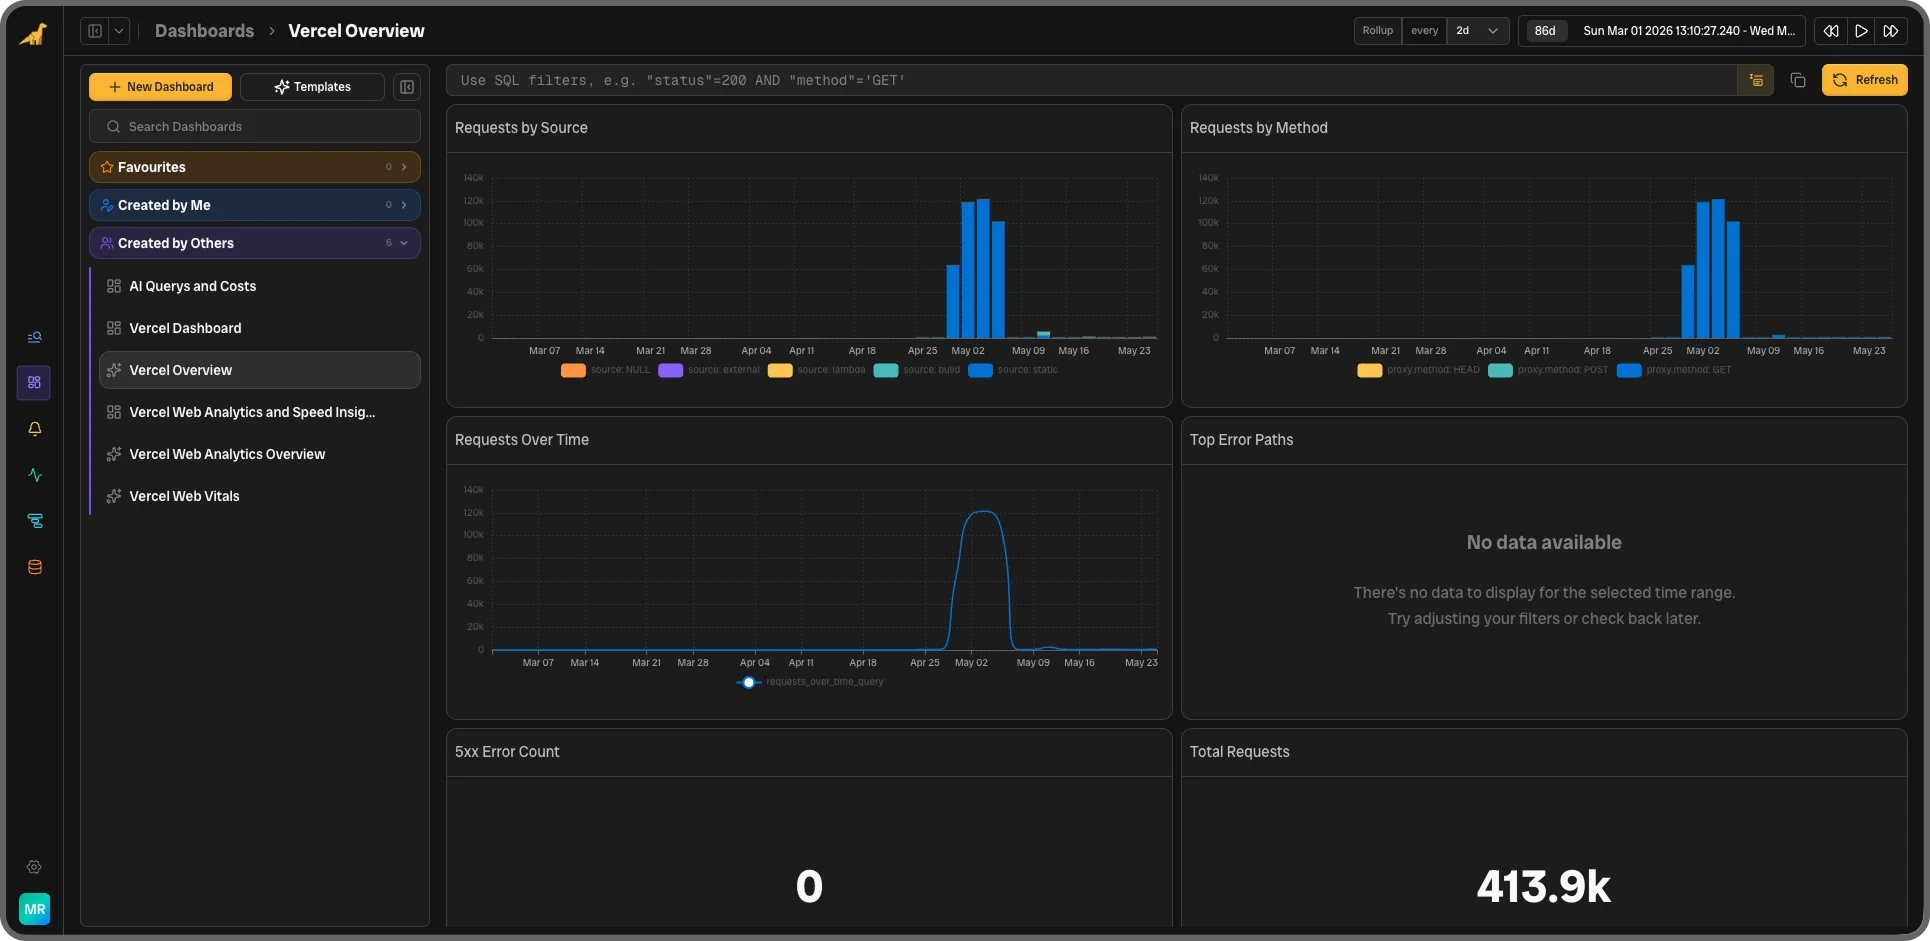
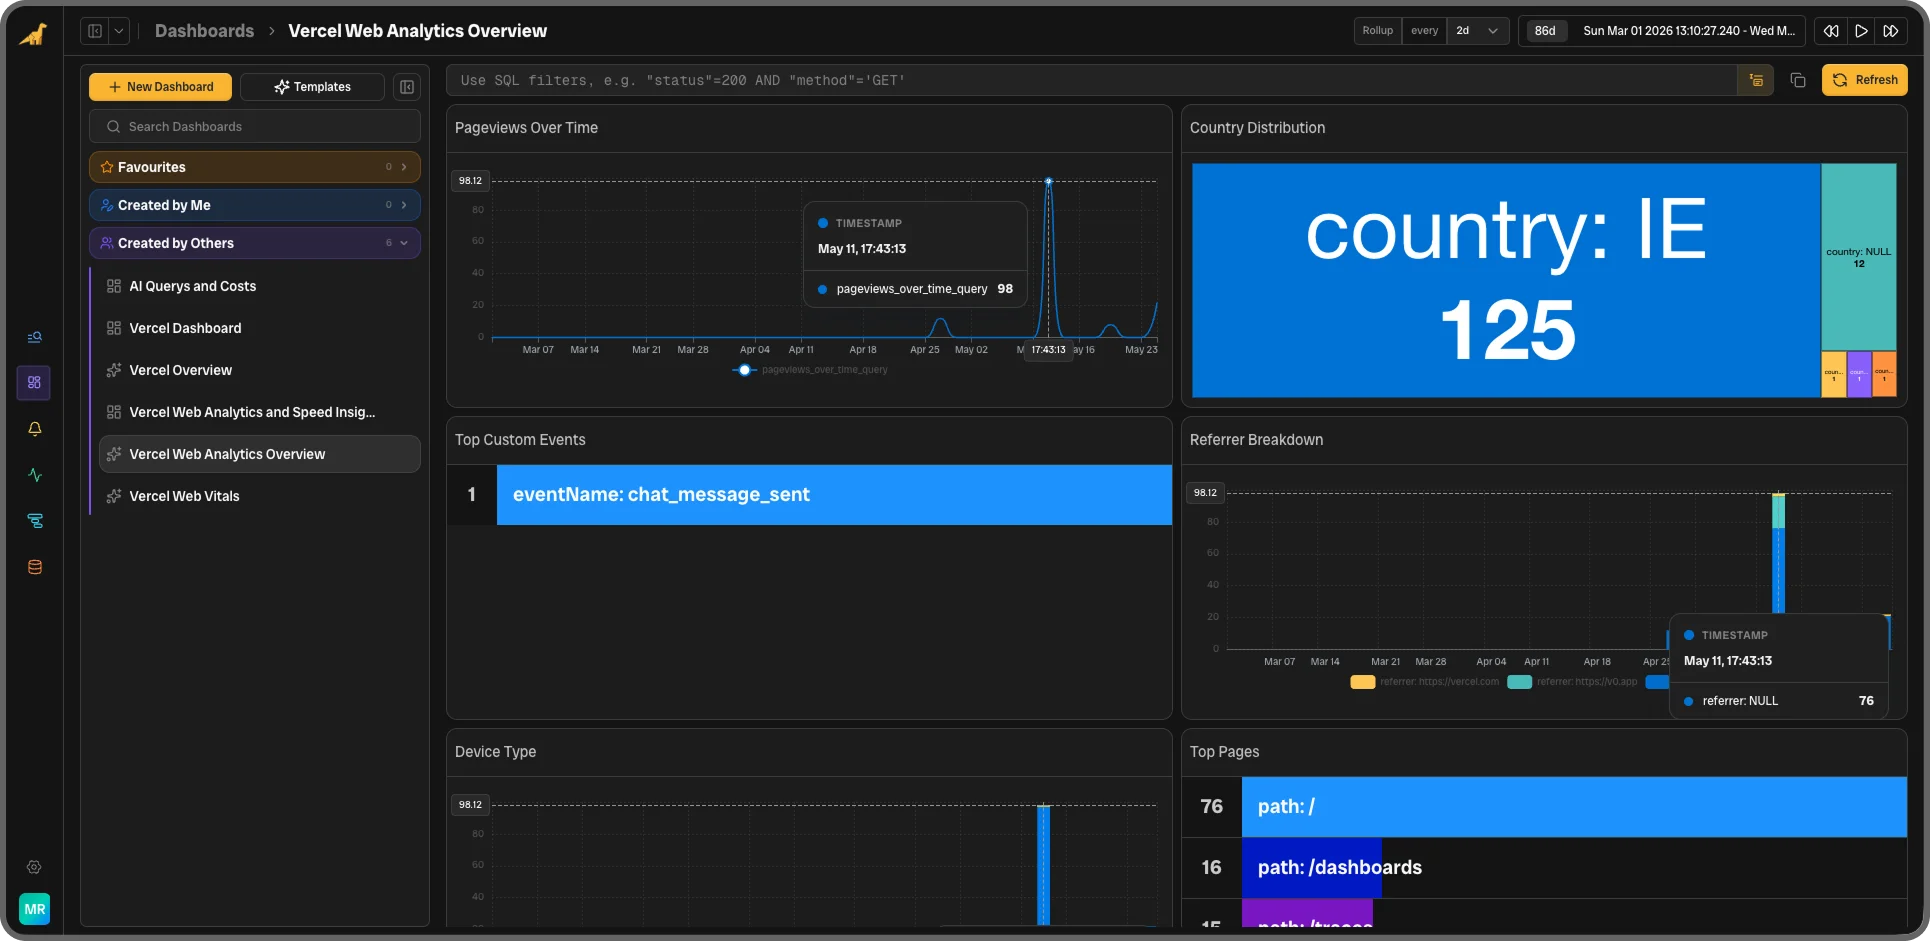
High-level view of request traffic, error rates, cache behaviour and firewall activity across your Vercel deployments.
- Lambda Error SpikeLogs drain10 events / 5 minCritical
- Lambda CrashLogs drainAny status code -1Critical
- 5xx Error Rate SpikeLogs drain> 5% of requestsCritical
- High 4xx RateLogs drain> 15% of requestsWarning
- Firewall Deny SpikeLogs drain100 denies / 5 minWarning
- LCP P75 RegressionSpeed Insights drainP75 > 2,500 msWarning
- INP P75 RegressionSpeed Insights drainP75 > 200 msWarning
Error and fatal log events from lambda sources
Events with status code -1 (process crash)
Requests denied by the Vercel WAF
Error-level events from the build source
LCP measurements above 2,500 ms
INP measurements above 200 ms
An observability platform agents can actually use
Bronto is designed for both humans and agents. Plug Vercel telemetry into your AI SRE, copilot, or vibe coding workflow without rebuilding your stack.
MCP server out of the box
Claude, Cursor, the AWS DevOps agent, and any MCP-compatible agent can query Vercel logs, traces, and metrics directly.
Cost-aware by design
Up to 100x cheaper than legacy hot tiers.
Context enrichment
Statement Patterns and Statement IDs group similar logs and link back to the exact code path, so agents reason over structure instead of raw text.
Structured, not stringy
Every field parsed at ingest, so agent tool calls return typed JSON instead of regex guesses.
OTEL GenAI + OpenLLMetry support
Agentic and non-agentic workloads in one place, at production scale.
Everything you need to operate apps on Vercel
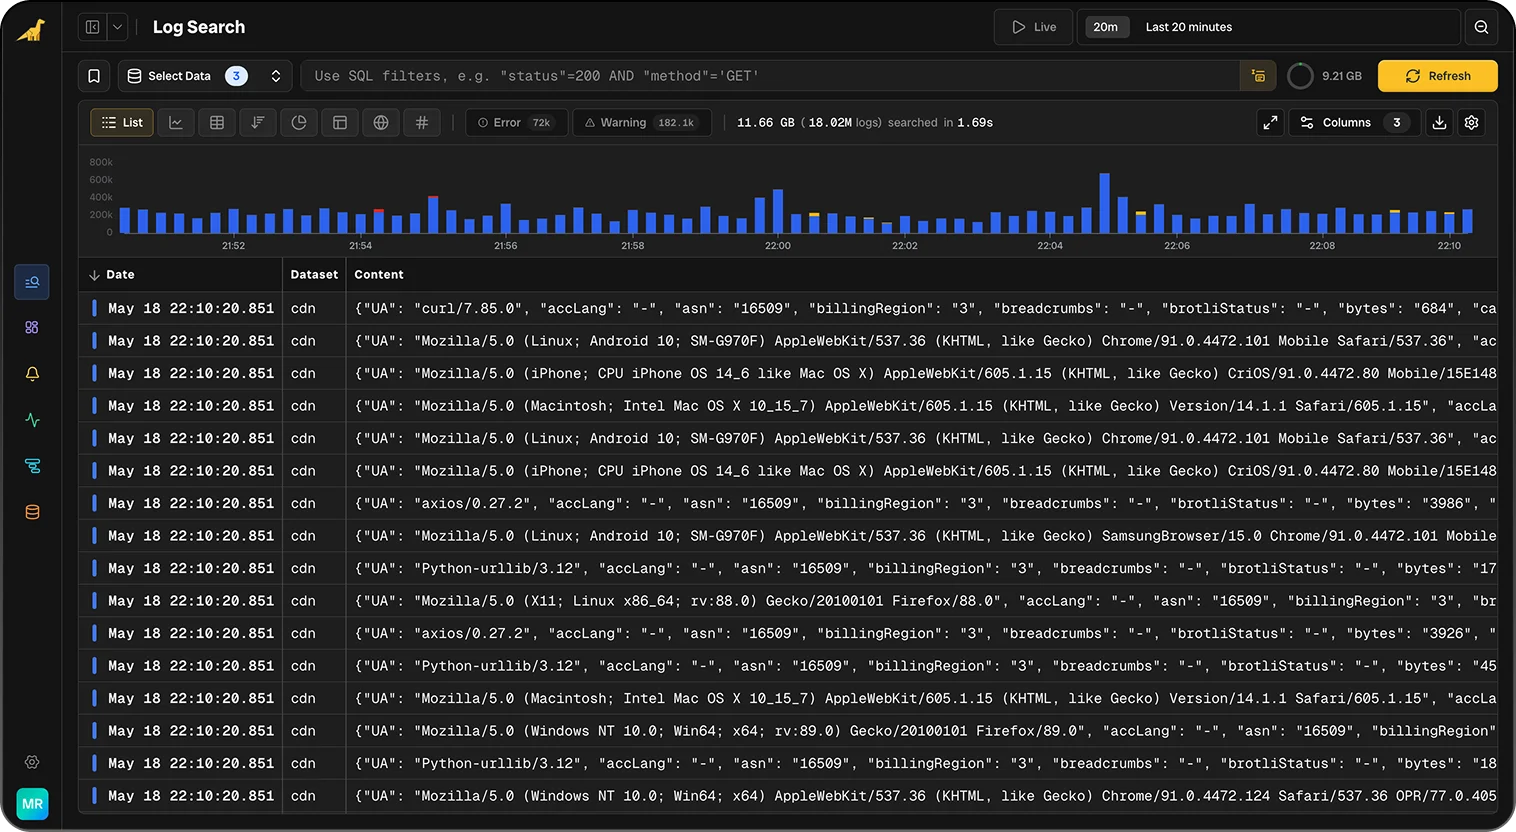
Streaming runtime logs
Every function invocation and edge log, no sampling required.
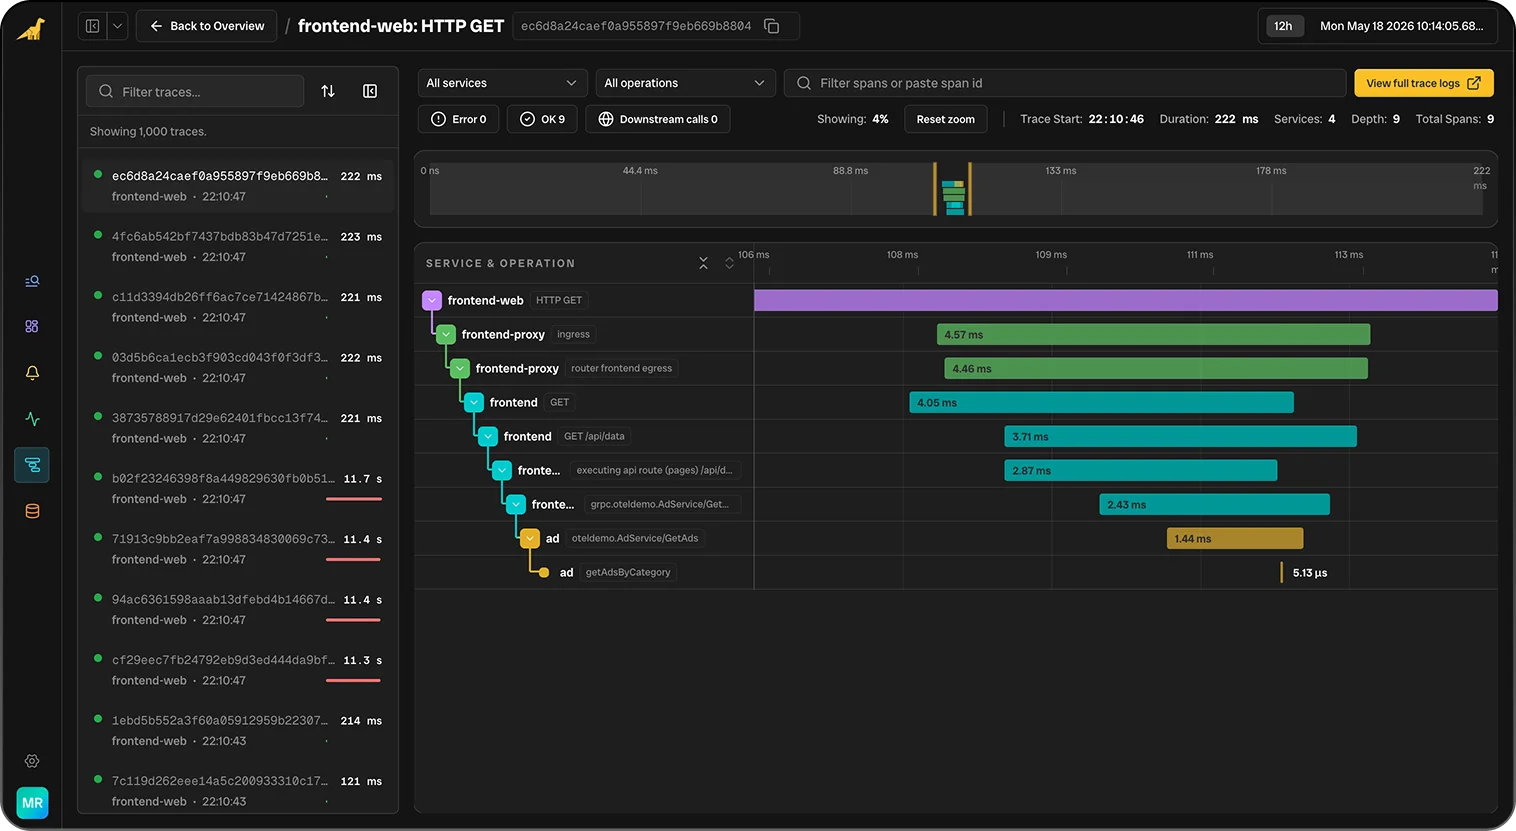
Distributed traces
Span-level visibility across serverless and edge functions, linked to the originating log.
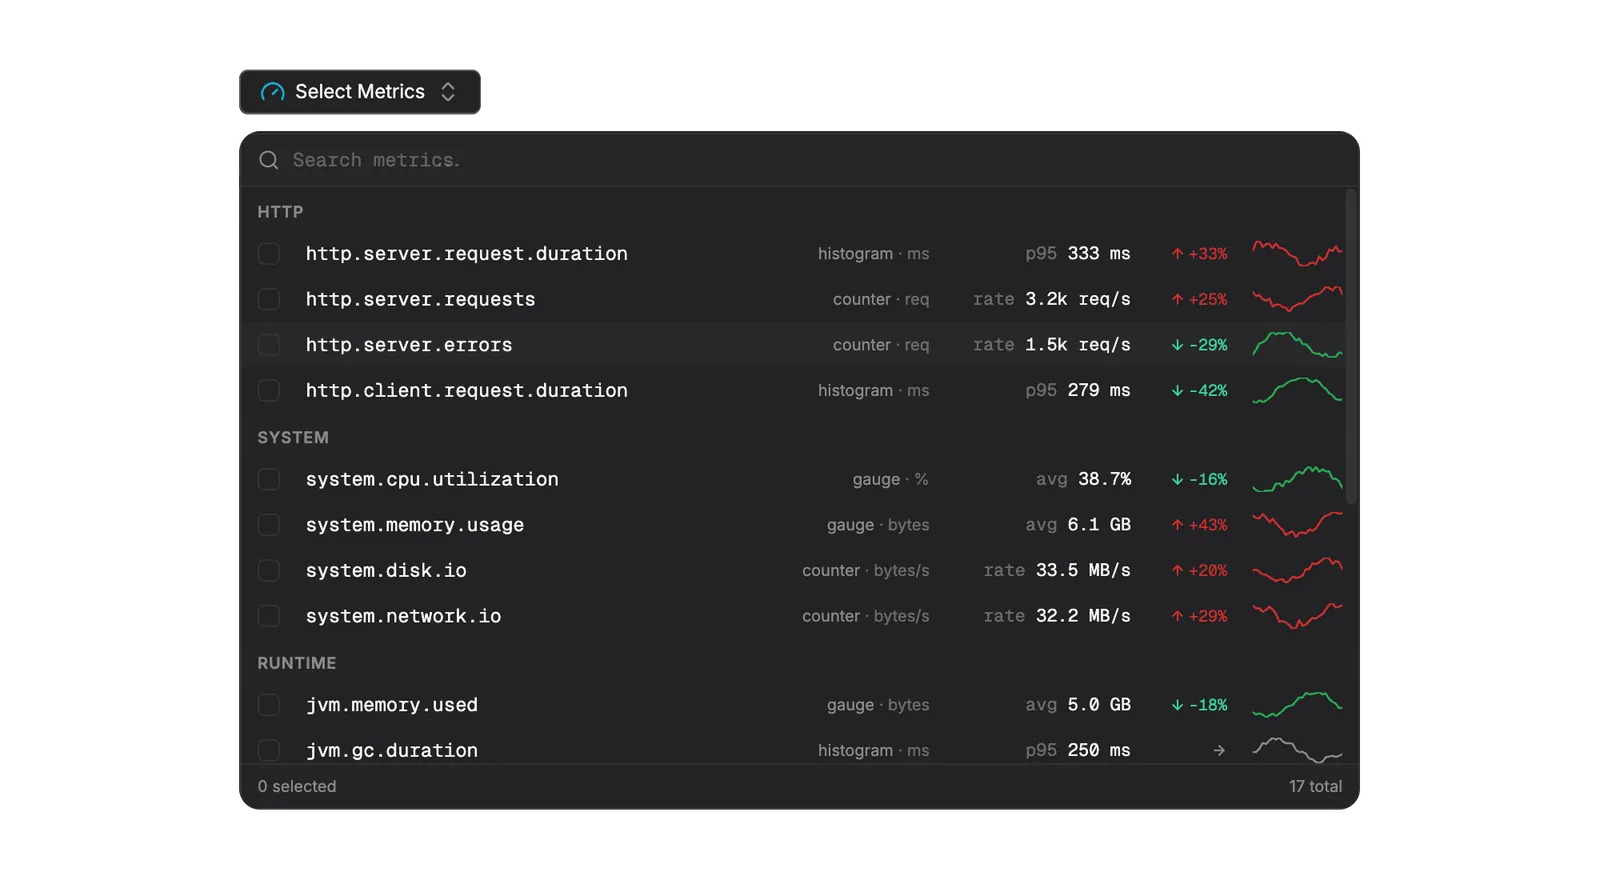
Speed Insights and Web Vitals
LCP, INP, and CLS for real users, alongside your backend data.
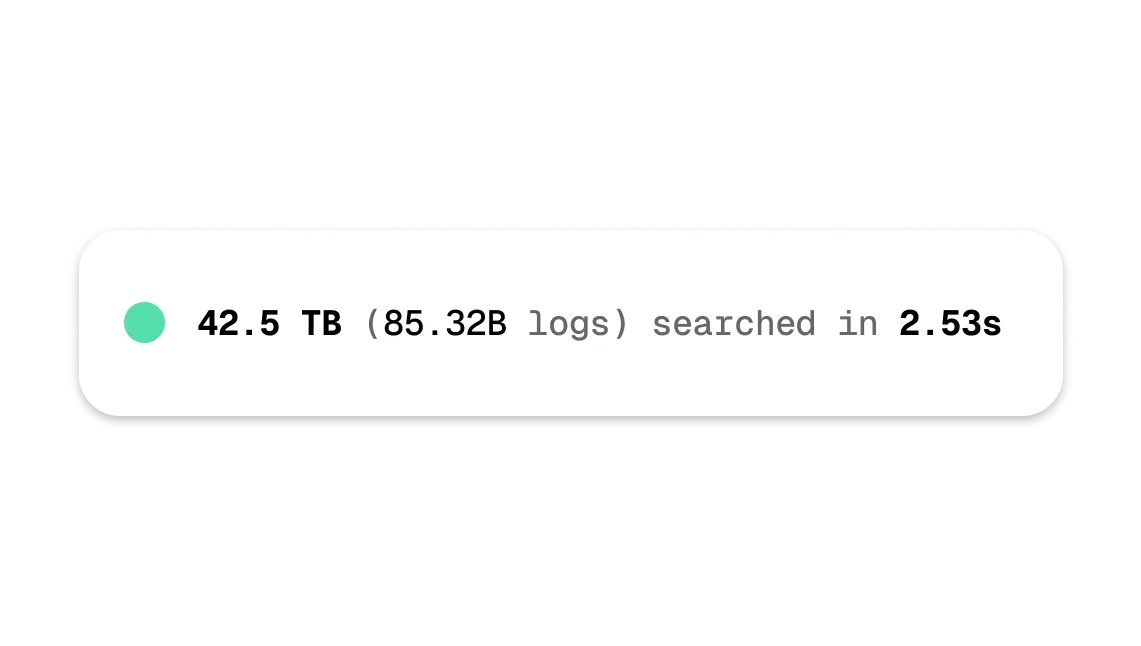
Sub-second search at any scale
BrontoDB returns queries in milliseconds, across petabytes of telemetry.
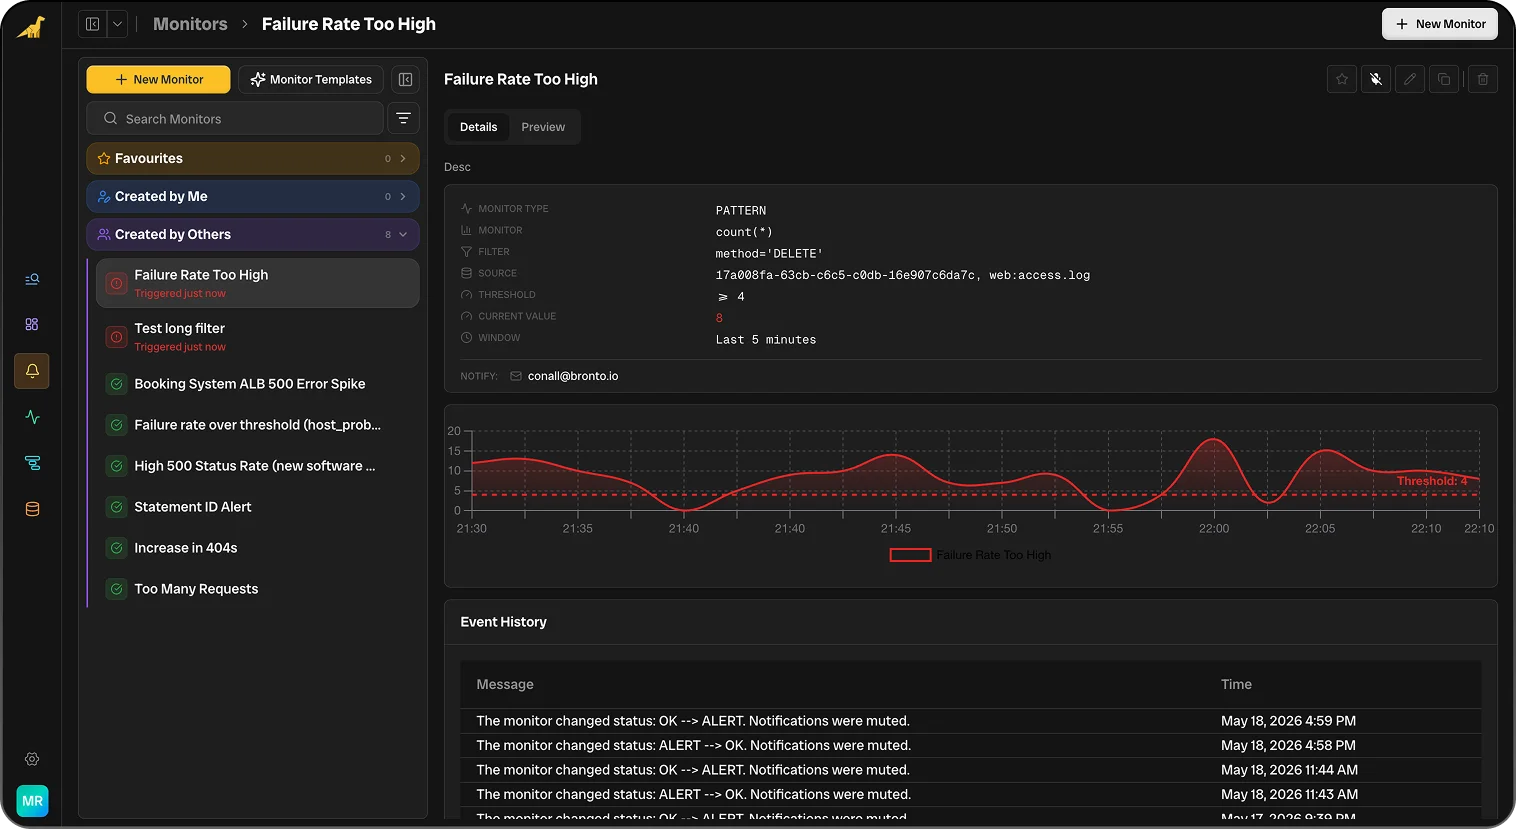
Monitors and alerts
Anomaly detection and threshold monitors. Every alert ships with an investigation report.
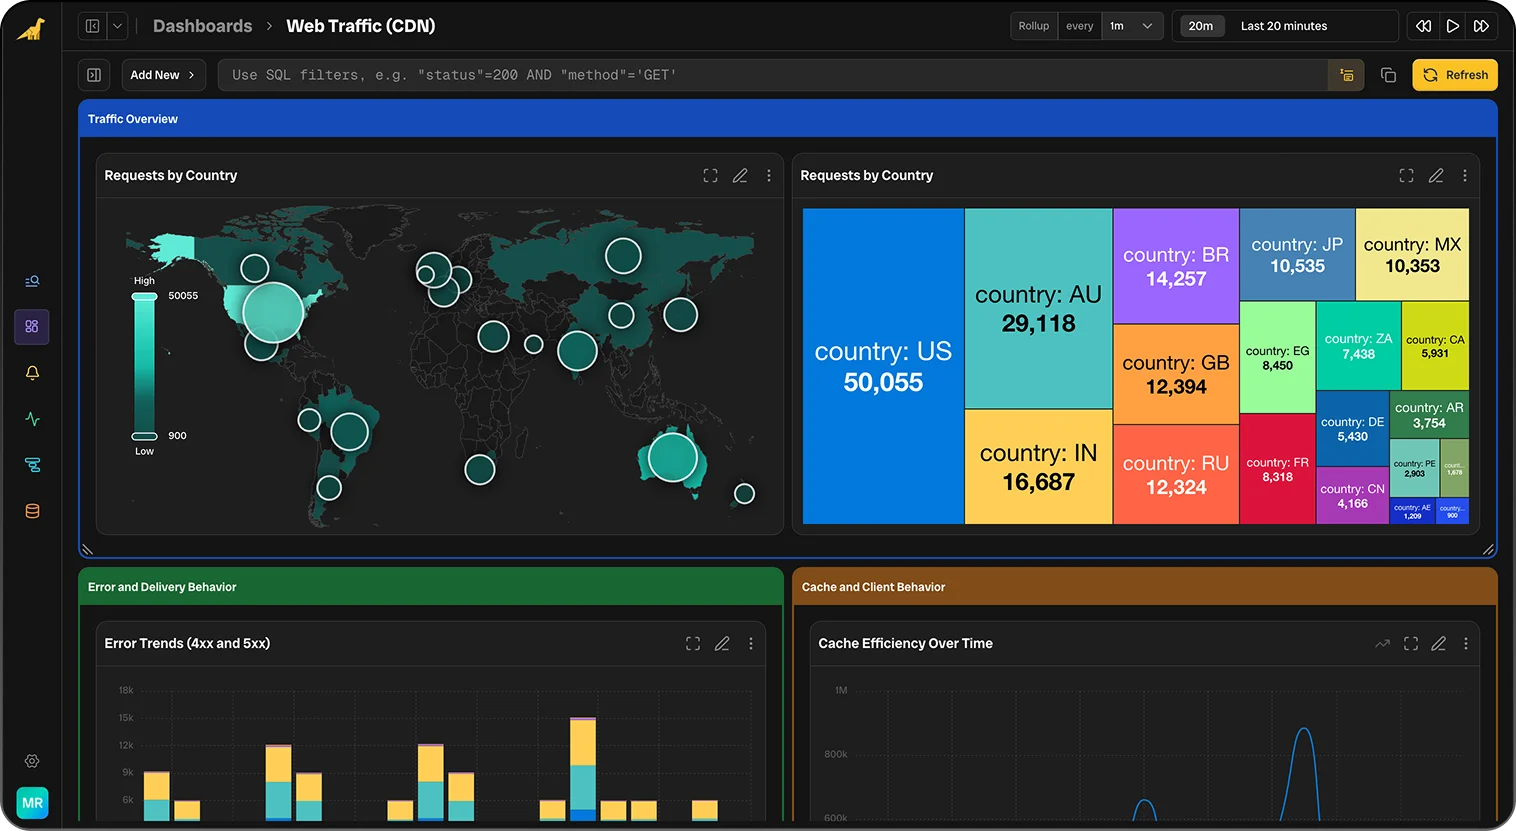
Dashboards on your data
Build views by query, or vibe your own UI with BrontoVibe.
Get the full story faster with AI-integrated analysis
Access your data in Bronto instantly wherever you work. It's easy to build on top of our platform to create new dashboards, tools, and agentic workflows.
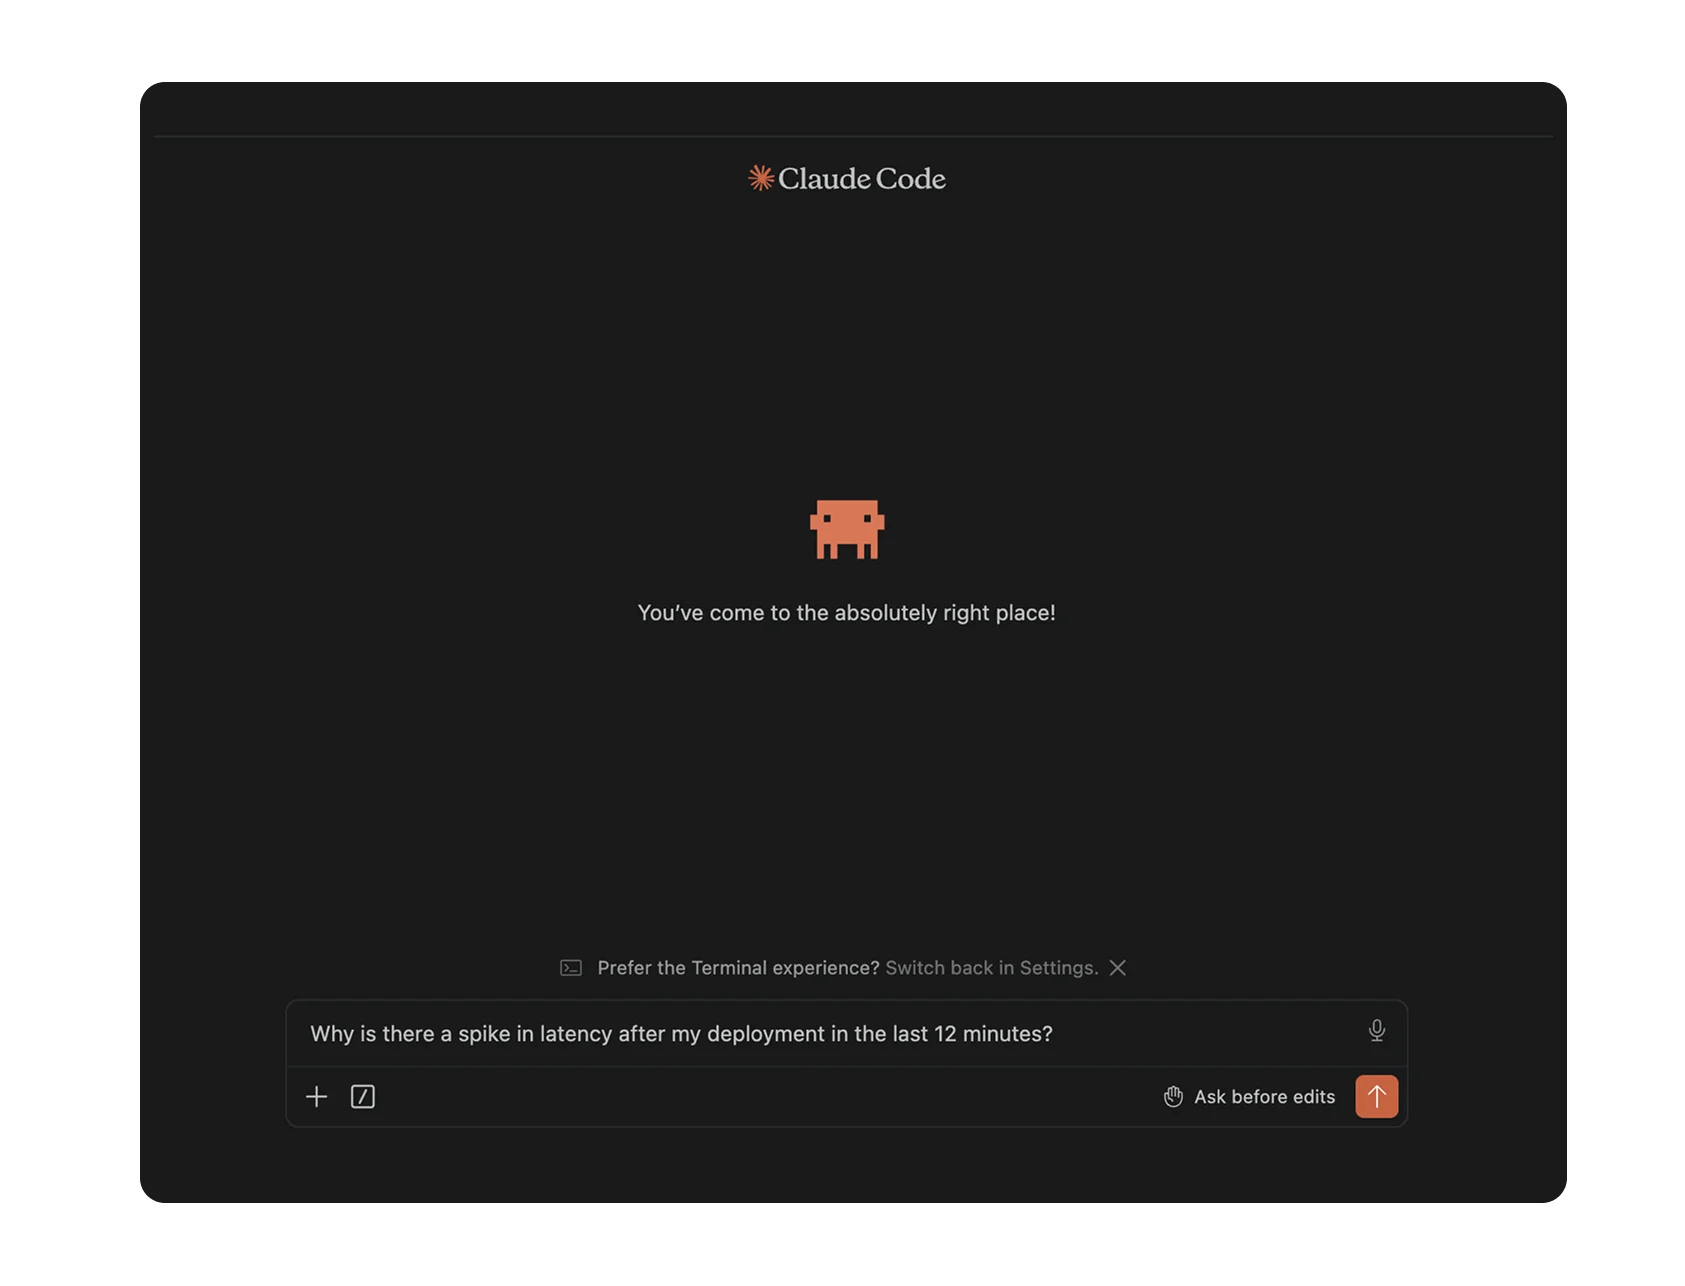
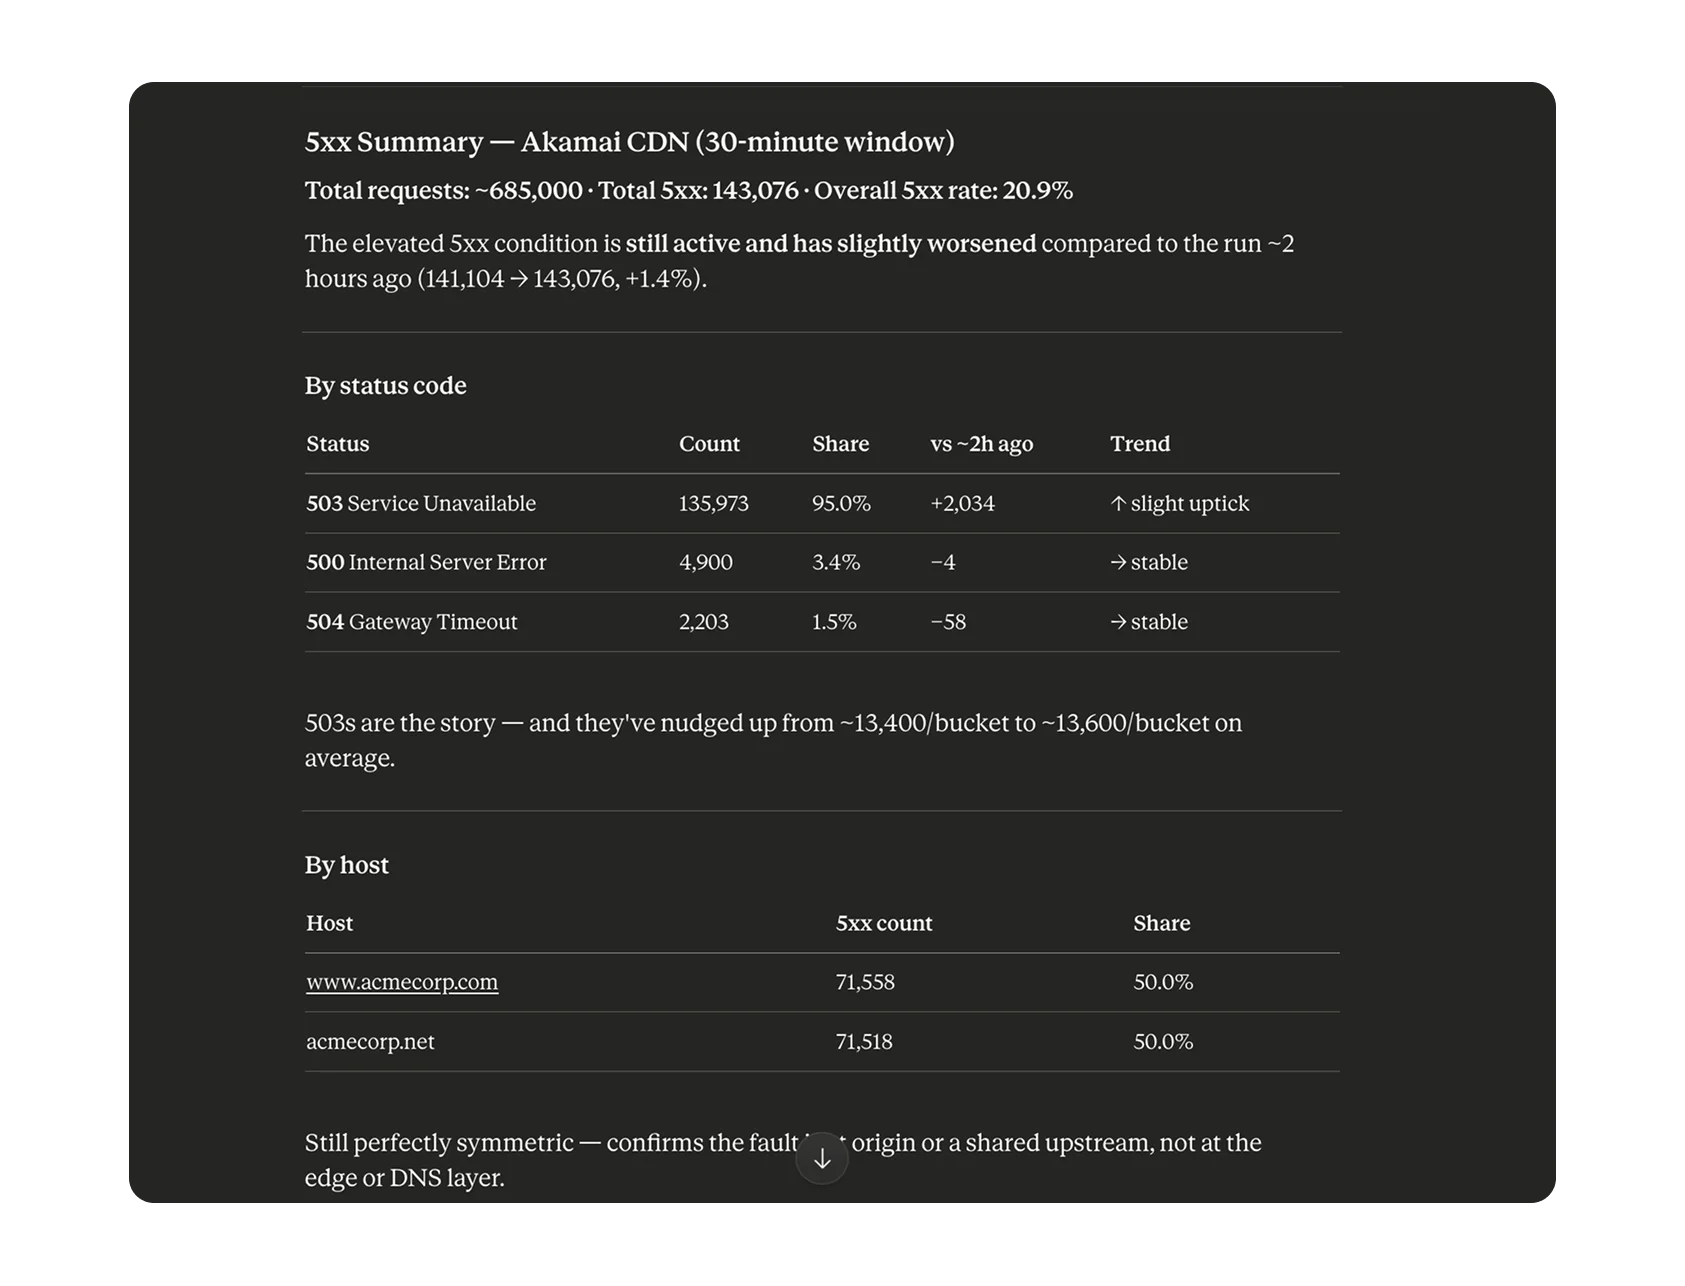
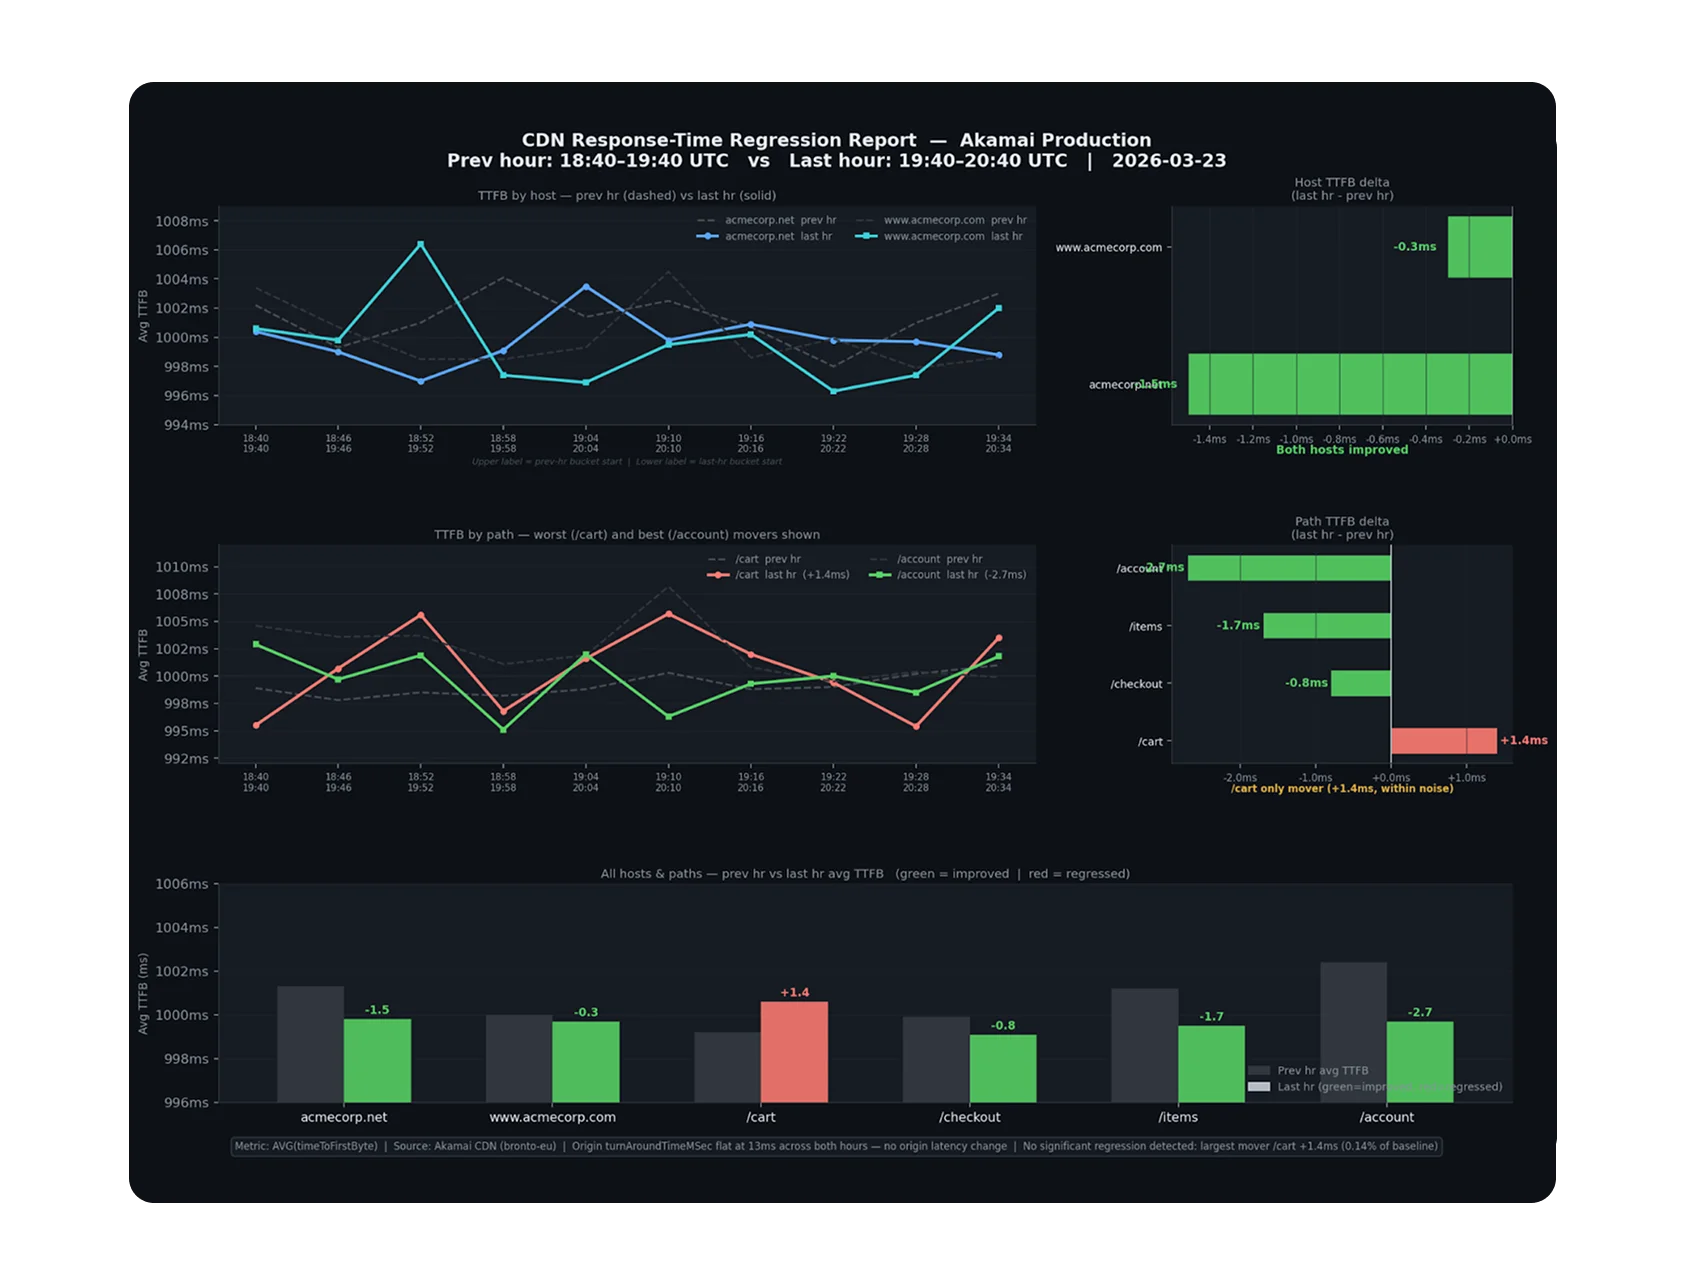
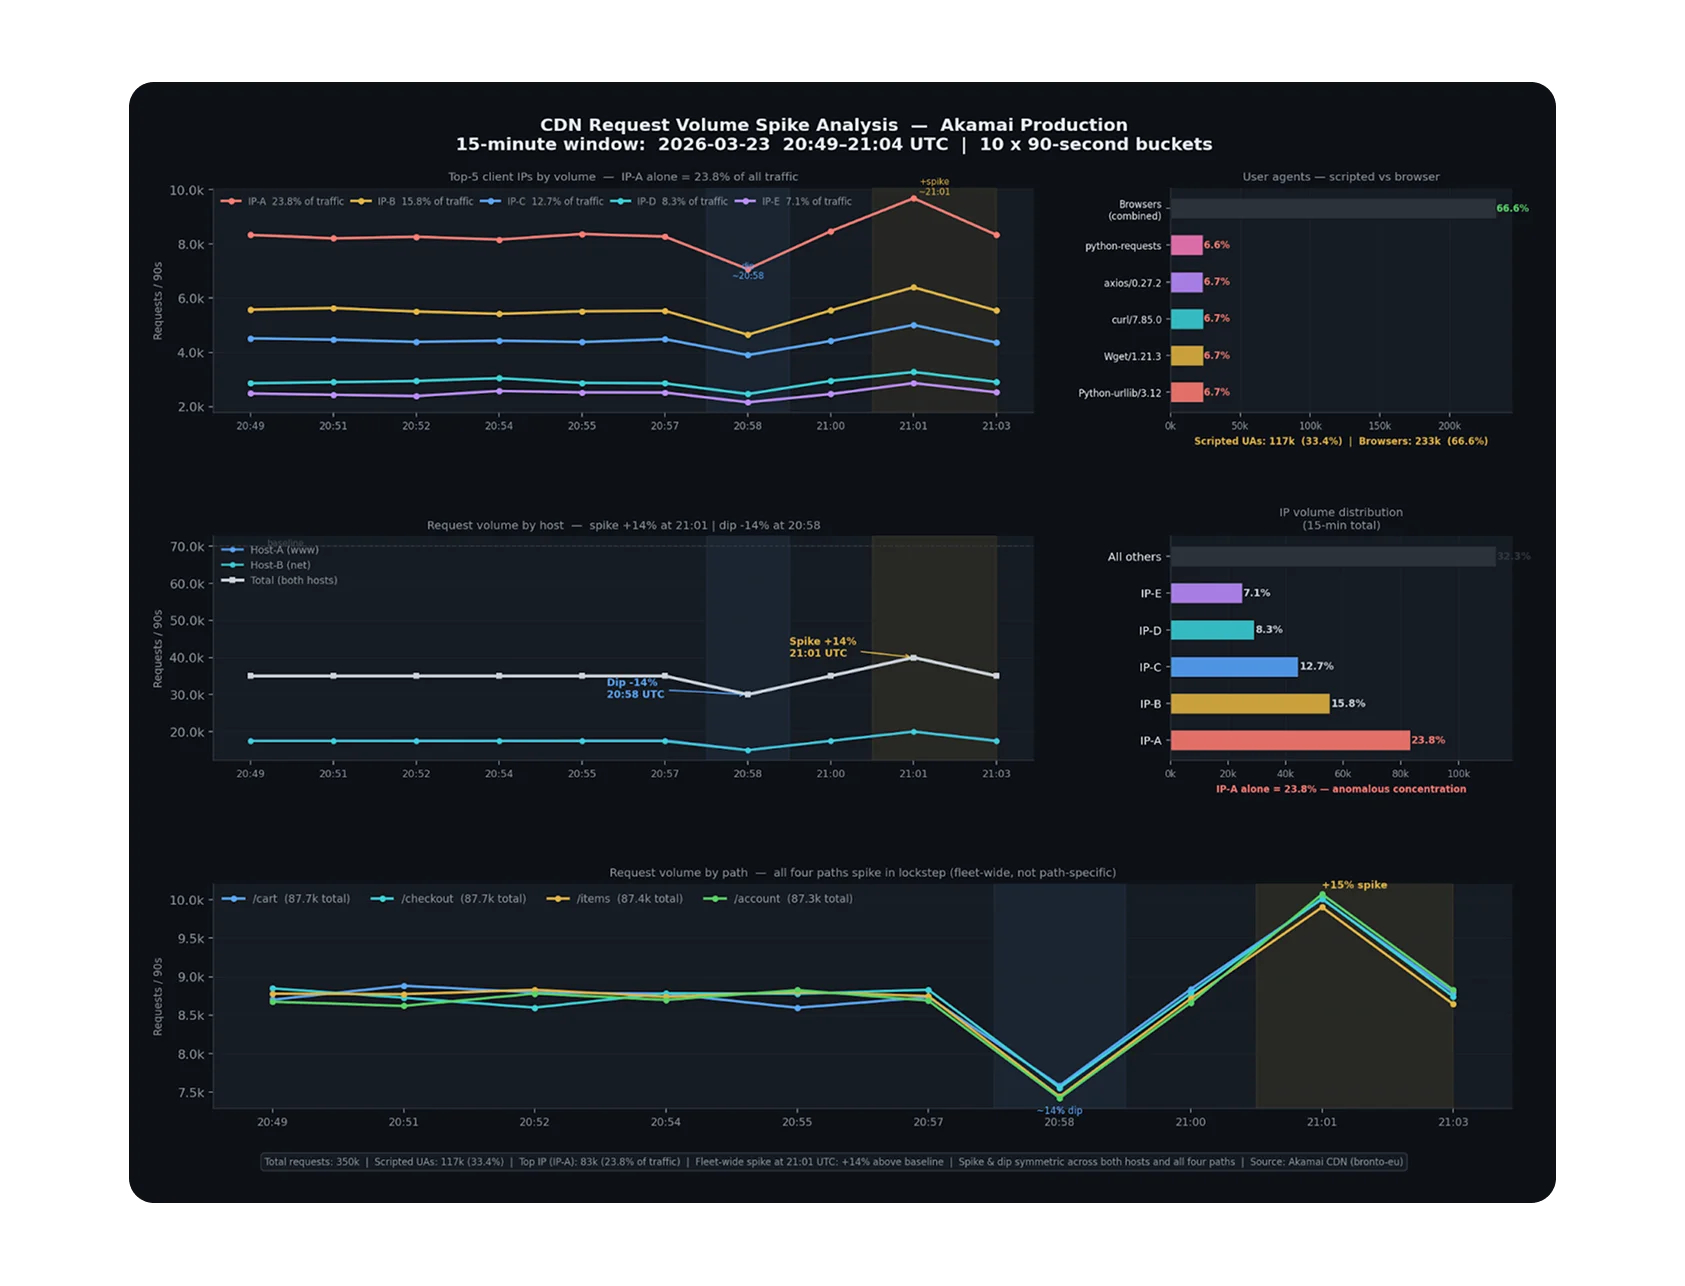
Bronto MCP Server
Plug Bronto straight into Claude, Cursor, and any MCP-aware agent so your logs, metrics, and traces become a first-class tool call.
REST & Query API
Programmatic access to every query, dashboard, and alert.
CLI & Terminal
Search, tail, and pipe Bronto data right from your shell.
Vibe it with v0
Bronto's UI is open source. Fork it as a v0 template, prompt your way to custom dashboards and internal tools on top of the Bronto API, and ship straight to Vercel.


AI SREs
Let autonomous agents triage incidents, investigate anomalies, and surface root cause in seconds.


IDEs & Coding Agents
Query your telemetry without leaving your IDE or coding agent of choice.
Common questions


Give your Vercel logs a better home
Sub-second search, 12 months hot retention, and AI-native parsing for every drain.