
Building an Agent with Vercel Eve and Observing it with OpenTelemetry and Bronto
Severin Neumann
Head of Community
This year our team attended Vercel Ship, first in London and then again in New York. If you watched the keynote, you may have noticed the same thing I did: how often the word "observability" came up. For someone who has spent years working on OpenTelemetry, that is a good sign. Platforms talking about observability as a core feature, not as an afterthought, is exactly where we want the industry to be.
One of the announcements was eve, a framework for durable, filesystem-first AI agents. After the keynote we had the opportunity to sit down with Remi, who walked us through how he uses eve and what he has been building with it. While he was showing us his setup, I had two questions in my head:
How quickly can I stand up an agent that is actually helpful in my day-to- day work?
How good is its observability?
For the second question, he pointed me to the docs, which call out that eve is OpenTelemetry native. That did not surprise me. Next.js was one of the first frameworks with native OpenTelemetry support, and it has been on the integrations list on opentelemetry.io for a long time. Vercel building their agent framework on the same foundation is the consistent next step.
Once I was back from the event, I wanted to give eve a try. What I needed was a concrete project.
A real task: keeping track of events and CfPs
The list of things that I need to keep track of is long, but one I always found particularly hard is tech events: conferences, meetups, and especially their Call for Papers deadlines. There are so many of them, scattered across many places and websites.
There are great non-gated resources for this, like developers.events and CNCF Open Community Groups, but not all of them are relevant to us, because they either are out of scope, held in a language that no one in our team speaks or in places we currently have no one to go to. We need a way to go through those lists, dig into the detailed pages and identify the ones that are most relevant to us, based on ever changing requirements. And, then, we need a way to keep an eye on the CfPs and other deadlines.
This is a perfect candidate for an agent that pulls from those pages, reads the details, categorizes them and assists us to keep track in Slack and in Jira.
Based on that, I knew fairly well what I needed to do:
Get eve.
Give Claude Code the description above.
Wait for Claude to create a first version of it.
Deploy it to Vercel.
Enable OpenTelemetry for observability.
Send the data to Bronto.
Improve from there.
That was the plan, and here is how it played out:
Building the agent
My description for Claude Code was roughly this:
Build an events helper agent that pulls CfPs and events from the developers.events feeds, make it easy to add more sources later, answer the question "what are the upcoming CfPs I am interested in", post a weekly digest to Slack, and file promising CfPs into Jira. Do not build anything yet, make a plan first, and check what Vercel’s eve already provides before writing code from scratch.
That last instruction shaped the whole project. It turned out that most of what I asked for already exists in eve or on Vercel:
Searching the web for new event sources: eve ships built-in
web_searchandweb_fetch tools. Zero code.Slack: a built-in eve channel. The credentials come from Vercel Connect, so there are no bot tokens or signing secrets in the code.
Jira: an eve Connection pointed at Atlassian's remote MCP server, again through Vercel Connect. Each user signs in with their own Atlassian account, and writes are gated behind an approval step.
The weekly digest: an eve Schedule, triggered by Vercel Cron.
Persistence: private Vercel Blob, with a local file fallback so
eve devworks offline.
The agent definition itself is almost nothing:
// agent/agent.ts
import { defineAgent } from "eve";

export default defineAgent({
  model: process.env.EVE_MODEL || "anthropic/claude-sonnet-5",
});
Everything else is convention: tools live in agent/tools/, schedules in agent/schedules/, channels in agent/channels/, and eve wires them together. The model is a Vercel AI Gateway id, configurable through an environment variable.
What actually needed to be written was the domain logic: fetching and normalizing the feeds, filtering out past deadlines, and an interests model with two layers. There is a global profile, managed by admins, which drives the weekly digest. On top of that, each user has a personal overlay where they can add topics or exclude global ones. The effective interests of a user are the global set plus their additions, minus their exclusions. The user identity always comes from the verified Slack session, never from the model.
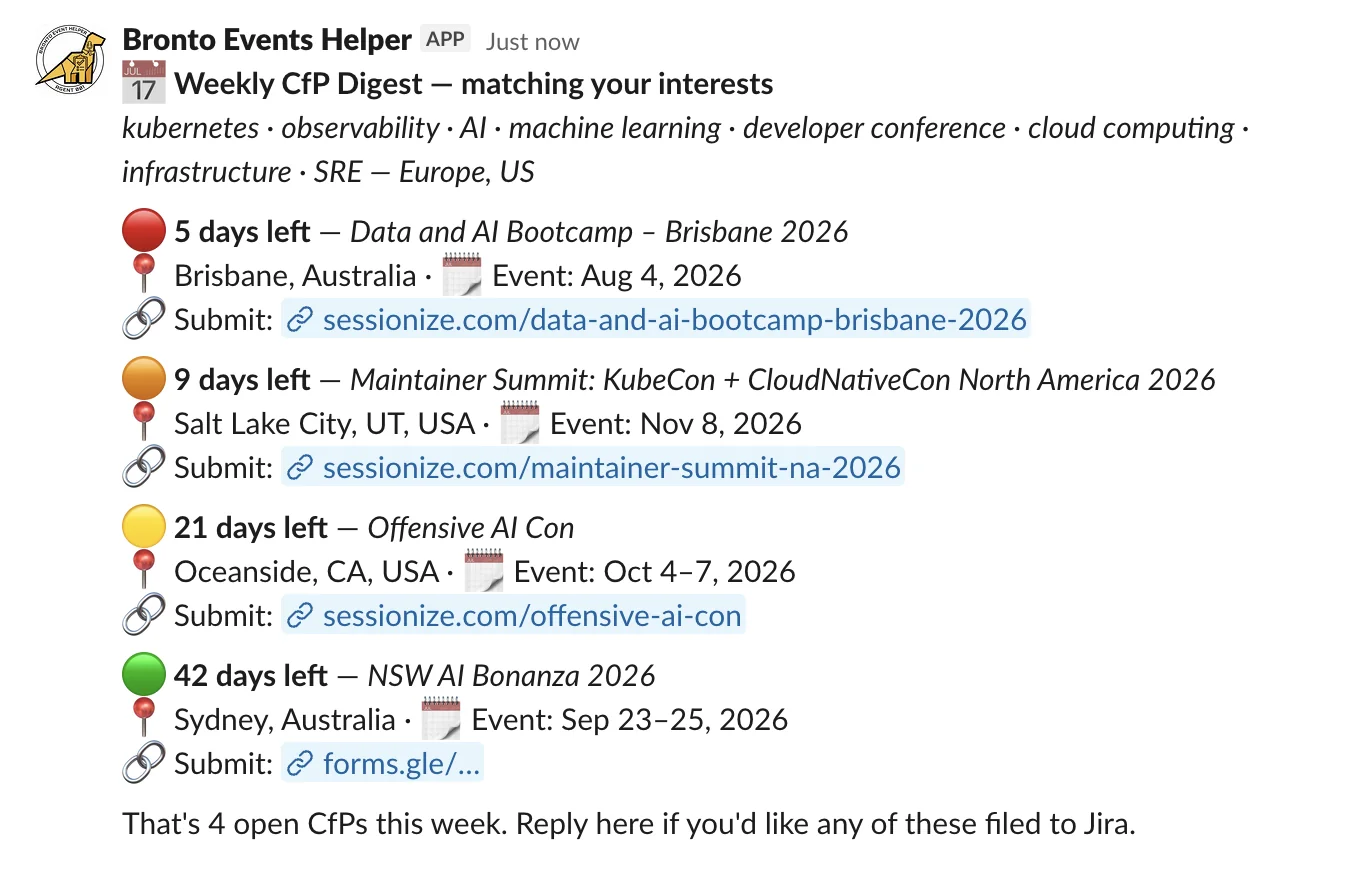
Today, the agent scans its sources daily. At the last count, that was 178 open CfPs and 893 upcoming events, including 99 from Open Community Groups. The platform has no official API yet, but its map view is backed by a JSON endpoint, so the agent pulls that once an hour into a Blob cache instead of scraping HTML or hammering the site.
Why I wanted the observability from day one
Between "deployed" and "working", there was a debugging session that made the case for observability better than any slide from the keynote. I wired up the Slack connector, sent the bot a message, and nothing happened. No error, no reply.
The problem is, that a webhook-driven agent has a long chain: Slack, Connect, the deployment, the environment configuration, the platform protection, the model gateway. Any link can break. Chasing the root cause was not a trivial task, especially without some visibility into the flow.
While I was certain that Claude Code could figure out this particular problem with the available documentation and details from Vercel, I used the opportunity to enable OpenTelemetry and to point the OTLP exporter to Bronto. I gave Claude Code access to the telemetry via the Bronto MCP server and from there it took only a few minutes and tokens to figure out what was wrong:
There were four independent causes stacked on top of each other:
The Connect webhook pointed to a default path that eve does not serve
The live deployment was older than the code that referenced the real connector
Two environment variables only existed in my local .env.local and not in production
Vercel's SSO deployment protection redirected every webhook to a login page
Claude asked me a few questions about my preferences, and after that I could add more features much faster, because Claude Code, eve, OTel and Bronto worked in tandem.
Enabling OpenTelemetry for Vercel Eve Agents
Here is the part I want to highlight. eve instruments the whole agent loop for you. Every conversation turn produces a proper OpenTelemetry span tree:
ai.eve.turn                      ← one conversation turn
├── ai.streamText               ← each reasoning step
│   ├── ai.streamText.doStream  ← the actual model call
│   └── ai.toolCall             ← each tool execution (list_cfps, manage_interests, …)
The spans carry session ids, turn ids, and token counts, and by default they also record the full prompts and outputs. You do not write any of this instrumentation yourself. The only thing you write is one file, agent/instrumentation.ts, which eve discovers automatically. Its only job is to say where the telemetry should go:
// agent/instrumentation.ts
import { OTLPHttpProtoTraceExporter, registerOTel } from "@vercel/otel";
import { defineInstrumentation } from "eve/instrumentation";

const endpoint = process.env.BRONTO_OTLP_ENDPOINT?.replace(/\/$/, "");
const apiKey = process.env.BRONTO_API_KEY;
const recordIo = process.env.BRONTO_RECORD_IO !== "false";

export default defineInstrumentation({
  recordInputs: recordIo,
  recordOutputs: recordIo,
  setup: ({ agentName }) => {
    if (!endpoint || !apiKey) return; // no config, no export

    registerOTel({
      serviceName: agentName,
      traceExporter: new OTLPHttpProtoTraceExporter({
        url: ${endpoint}/v1/traces,
        headers: {
          "x-bronto-api-key": apiKey,
          "x-bronto-collection": process.env.BRONTO_COLLECTION ?? "events-helper",
          "x-bronto-dataset": process.env.BRONTO_DATASET ?? "agent-runtime",
        },
      }),
    });
  },
});
Since this is plain OTLP over HTTP, the destination can be any OpenTelemetry-compatible backend. For Bronto it is the regional ingestion endpoint, in my case https://ingestion.eu.bronto.io/v1/traces, plus an API key header and optional collection and dataset headers to organize the data.
From the first accepted span onwards, every conversation with the bot shows up in Bronto as a trace.
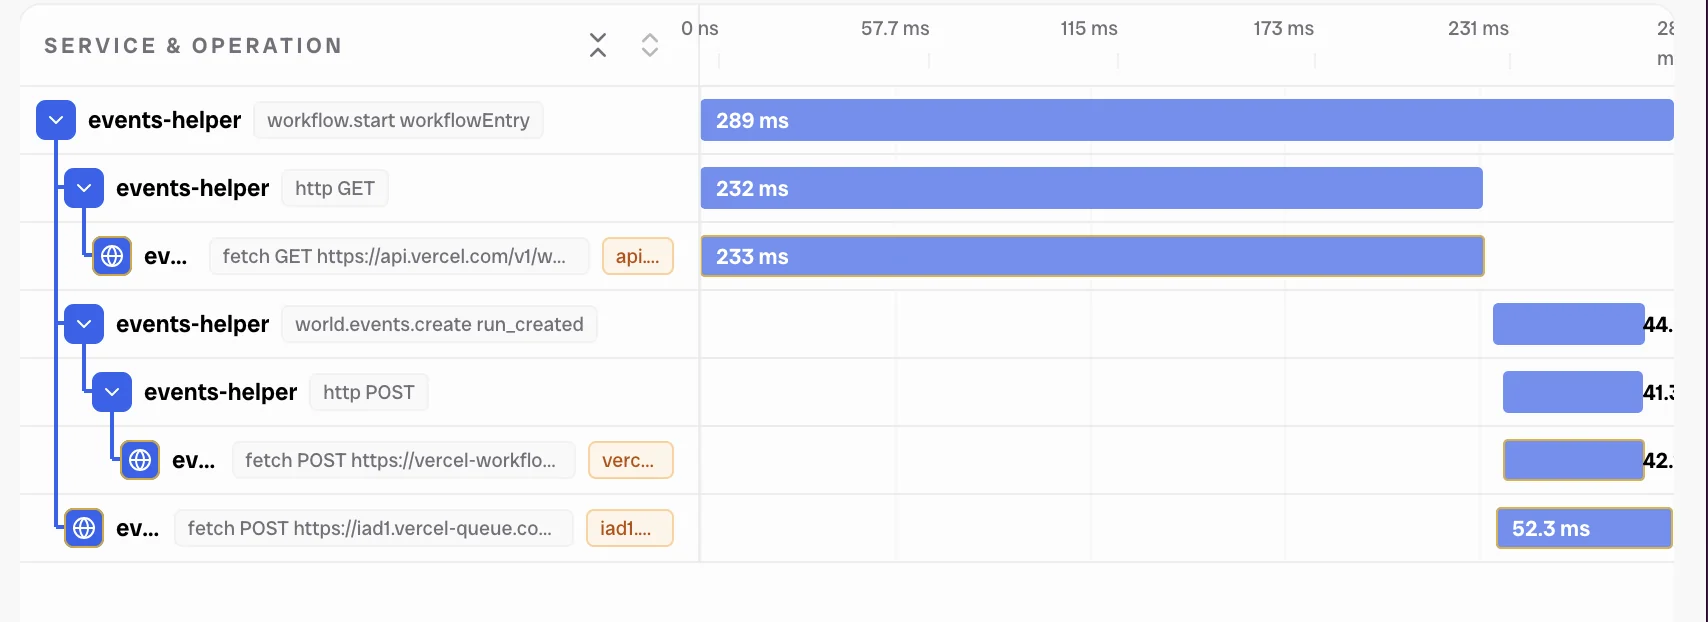
Two things are worth calling out:
Prompts and outputs are recorded on the spans by default.
For LLM observability this is what you want: when the agent gives a strange answer, you can see what the model actually saw. But it also means your traces contain conversation content.
Eve provides recordInputs and recordOutputs switches for this, and I exposed them as a single BRONTO_RECORD_IO=false environment variable for cases where sessions may carry sensitive content. The bot is currently under development and only used by a handful of people within Bronto, who are aware of this, but eventually this is a conscious decision that has to be made, to keep it on for better visibility or turn it off for higher privacy.
The setup fails safe.
If the endpoint or key is missing, for example on a fresh checkout running eve dev, no exporter is registered and the agent runs normally. Telemetry should never be the reason your agent does not start.
Logs that belong to their traces
Traces show the structure of a turn. Logs show what the code decided inside it. The important part is connecting the two, and since eve’s spans are standard OpenTelemetry, the active span context is directly available:
// agent/lib/log.ts (excerpt)
import { trace } from "@opentelemetry/api";

function emit(level: LogLevel, message: string, attributes?: LogAttributes) {
  const spanContext = trace.getActiveSpan()?.spanContext();
  const record = {
    level,
    message,
    service: "events-helper",
    ...(spanContext ? { traceId: spanContext.traceId, spanId: spanContext.spanId } : {}),
    ...attributes,
  };
  console.log(JSON.stringify(record));
  shipToBronto(level, message, attributes, spanContext);
}
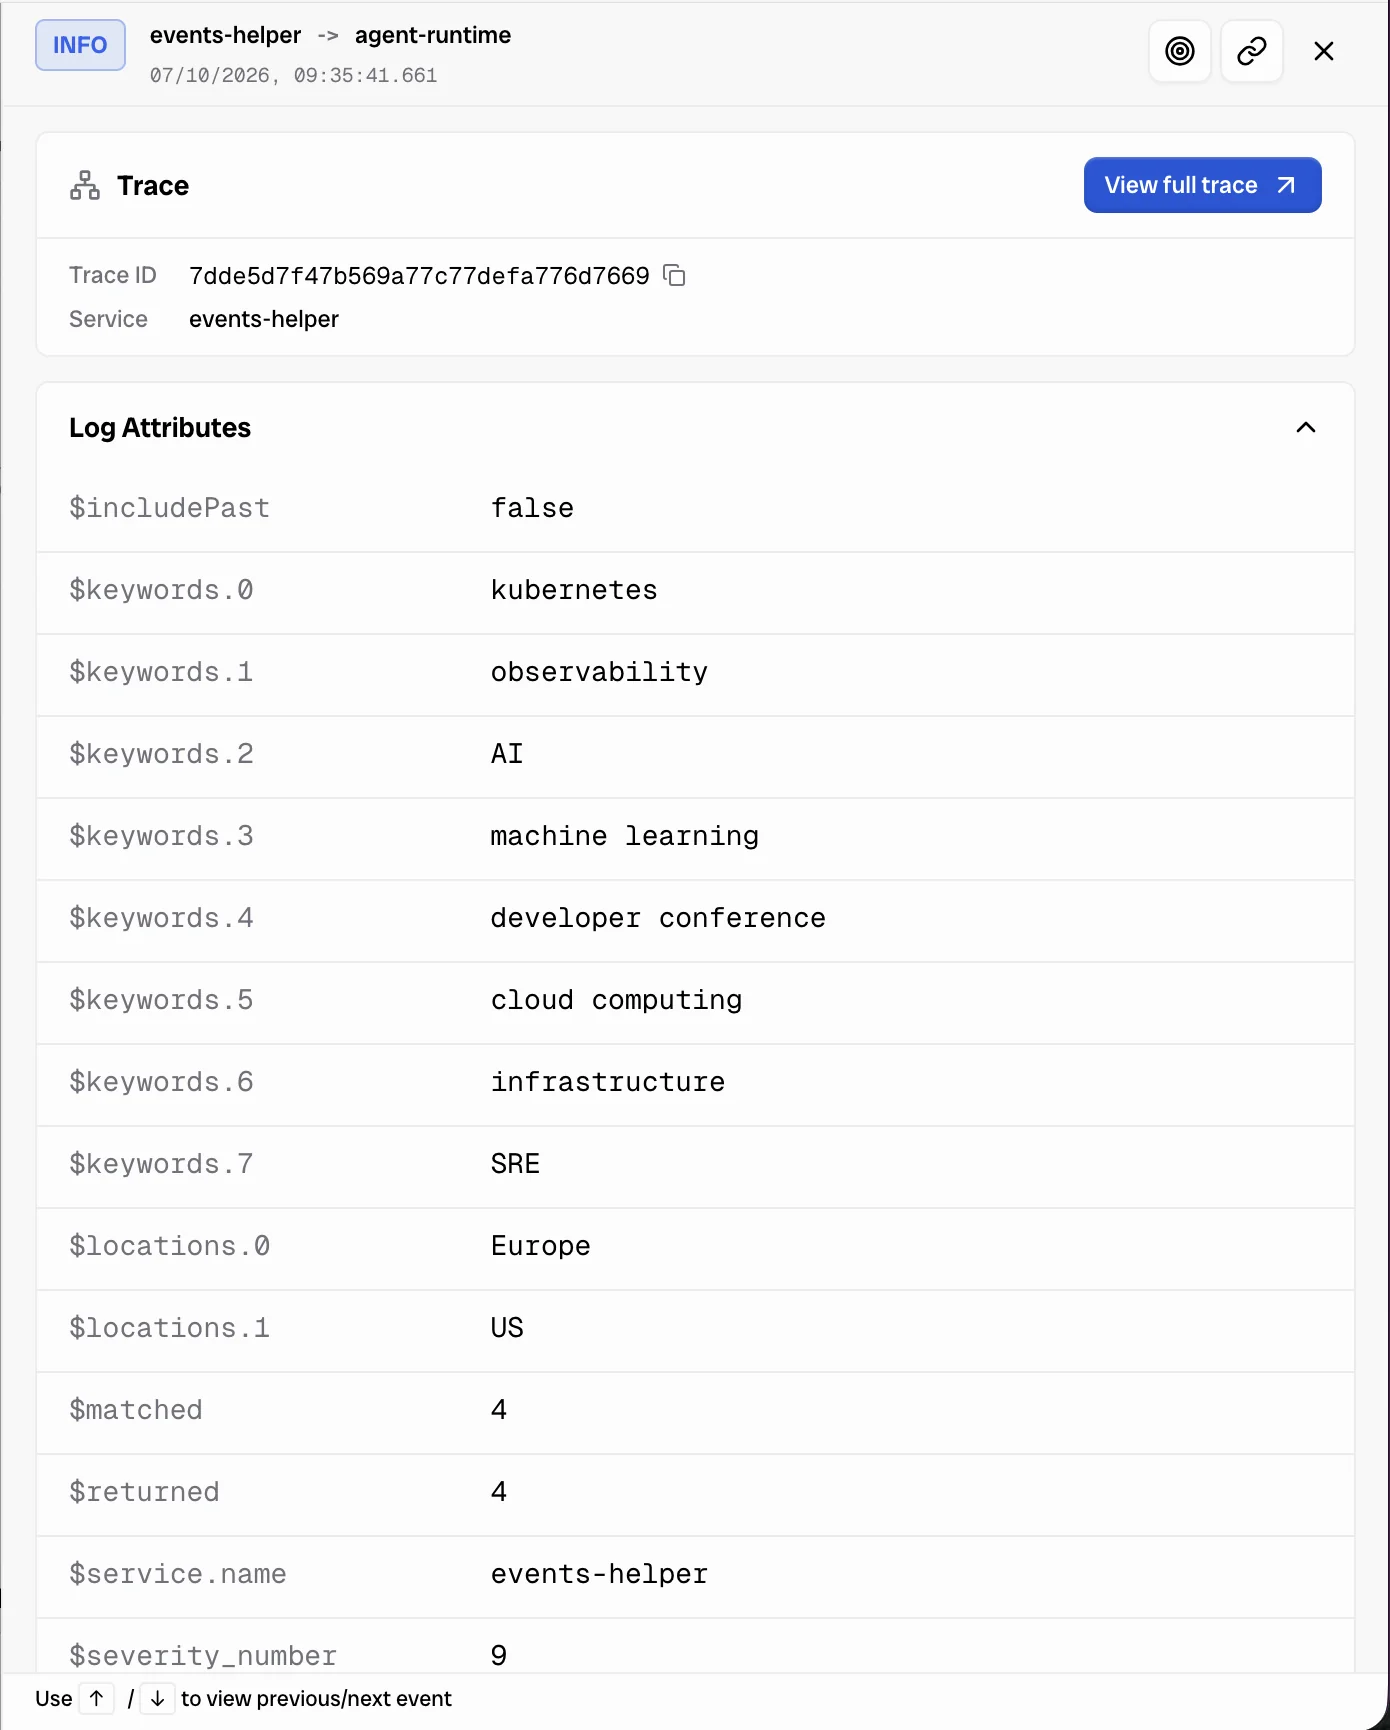
Every log line the agent emits, for example "cfps queried, matched: 2", "source fetch failed", or "unauthorized set_global attempt", carries the traceId and spanId of the tool call it happened inside. In Bronto, that means you can go from a slow or failed span directly to the log lines it produced, and back.
There is one practical detail for Vercel users. The platform way to get runtime logs out of Vercel is Log Drains, and Bronto has a documented endpoint for them. That is the right long-term setup, but Drains require a Pro plan, and during development this project runs on the free plan. So the log helper has a second delivery path: next to console.log, it sends each record directly to Bronto's /v1/logs endpoint as OTLP/JSON, fire and forget, never blocking a tool call.
One nice detail: OTLP/JSON encodes trace and span ids as hex strings, which is exactly the format the OpenTelemetry API already gives you, so Bronto correlates the logs to their spans without any conversion. Once the agent reaches good quality, it will move to a Bronto owned account with Pro plane. This allows the Drains to be used and so with a single environment variable (BRONTO_DIRECT_LOGS=false) the direct path is turned off, so nothing arrives twice.
Deployment logs: knowing what changed
The signal I find most underrated is not traces and not runtime logs. It is the answer to the question "what has changed?". When an agent starts behaving differently, the first suspect is rarely the code path, it is the last deployment.
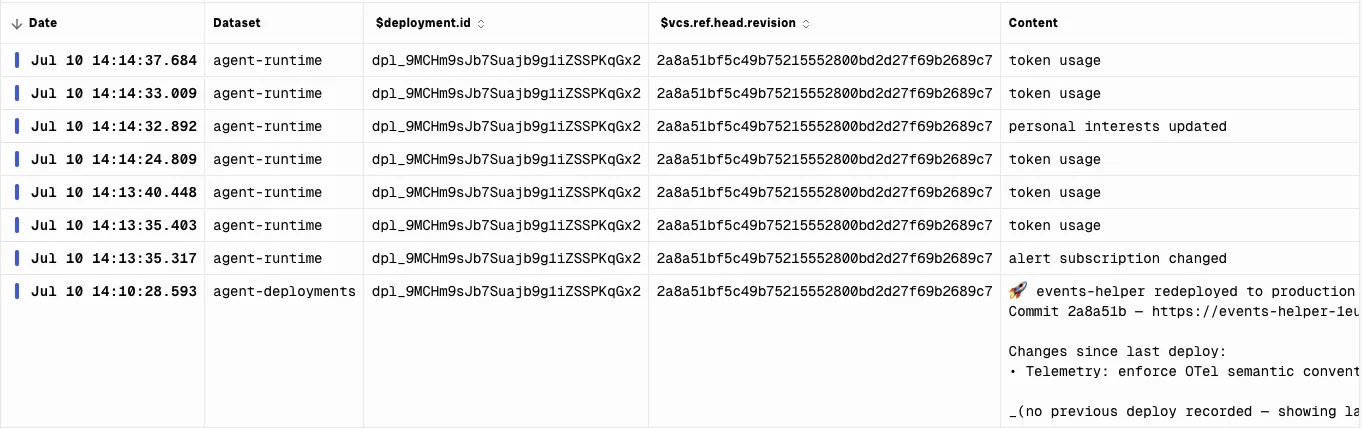
So the deploy script for this project does more than deploy. npm run deploy diffs the git history since the last recorded deployment, ships to production, sends a change summary to me on Slack, and posts the same summary to Bronto as a log record. Every deployment becomes a durable event in the observability backend, next to the telemetry it affects.
In Bronto, the data is organized into one collection (events-helper) with two datasets, split by one simple question: does it correlate by trace id?
agent-runtime: traces and runtime logs. They describe the same turns and share trace ids, so they belong together.agent-deployments: deployment events. They have no trace context. They are the change log of the system.
When the agent gets slower or starts answering differently, I can put the runtime data and the deployment events next to each other and see immediately whether a deployment lines up with the change in behavior. I am planning to build some views in Bronto for exactly this, and possibly let BrontoVibe generate them from the data.
What I can answer now
With all of this in place, the questions from that first blind debugging session have direct answers:
Why was that reply slow? The span tree shows whether the time went into the model call, a slow feed fetch, or the Jira round trip.
What did the model actually see? Recorded inputs and outputs on the span, redactable when needed.
Which source is flaky? Per-source fetch failures are logged with the trace that triggered them.
It behaves differently since Tuesday, what changed? The deployments dataset has the commit and the change summary.
What does this cost? Token counts are attributes on every model call span.
The part I would underline for anyone building agents on Vercel: none of the instrumentation here is custom. Eve emits standard OpenTelemetry, @vercel/otel exports it, and any OTLP backend can receive it. The decisions that were left for me were the ones that should be mine anyway: what to record, where to send it, how to organize it, and which log events are meaningful for this specific agent.
We published the full source of the agent as open source, including the tools, the instrumentation, and the deploy scripts, under the Apache-2.0 license: https://github.com/bronto-community/events-helper/.
If you are building an agent with eve, or sending OpenTelemetry data from anywhere else, and you are looking for a place to put it: Bronto ingests OTLP traces and logs natively, and is built for observing your agents. The setup you saw above is the complete integration.
You can test out Bronto yourself by starting a free trial today.
What’s next
As we use this agent actively at Bronto, we will add more features, like a generalized way to subscribe to calendar pages, that can help keep track of meetups. Likewise, if you need any additional features, let us know. Maybe an integration with Linear instead of Jira?
But, we do not stop there! This is only one agent of many, that we are rolling out. Most interestingly eve enables team members outside of the engineering teams to create an agent on their own: while I was building this agent for our events, and wrote this blog post, Patrick Londa, our Director of Marketing added another eve-based agent to our slack, that is here to assist with many other activities we need help with like weekly metrics reporting and Jira project management . Pretty soon, like Vercel, we will need a routing agent.
Enjoyed this post?
Share it with your team or network.

Try Bronto free for 14 days
Centralize your agent and infrastructure telemetry in one platform with sub-second search and 12-month hot retention.
- 14-day free trial
- No credit card
- Set up in minutes