
Turning Investigations into Automations with the Bronto MCP Server
Ciaran McGauran
Lead Software Engineer
Our previous posts showed how the Bronto MCP server plugs into your live infrastructure data to reveal what's happening in dynamic production environments, using either an AI client like Claude Code or a custom LangGraph agent. We stepped through examples using CDN logs to investigate spikes in 5xx errors, identify latency regressions, and trace abusive traffic, showing how engineers can explore production issues using natural language.
But operations aren't only fire-fighting. Once you've investigated an incident and found the query that exposes an issue, you shouldn't have to do that work again next week. The next step is turning those discoveries into reusable infrastructure: monitors, saved searches, and lightweight diagnostics that help you understand what data indicates a healthy system, what is failing, and what is actually being used.
This third post covers how Bronto has expanded our MCP server toolset to help teams catch recurring issues, preserve analysis context, and understand how their data is being used.
The new tools fall into three areas, each addressing a different question about the data:
Turning investigations into monitors — How do you make sure a problem you just solved gets caught automatically the next time it happens?
Preserving analysis context — How do you keep the useful viewpoints an engineer built while exploring data or investigating an incident so the team can reuse them?
Coverage, usage, and health — How much of your data is actively being analyzed or monitored?
Turning investigations into monitors
In the previous article, we investigated spikes in 5xx errors, latency regressions, and abusive traffic. The next step is to turn those investigations into monitors. To support this and similar use cases, Bronto exposes some additional tools:
create_monitor: Takes the queries from your investigation and turns them into monitors. It is not limited to threshold conditions: you can also alert when a datasource goes silent, so if an edge device stops sending data you hear about it—a class of failure that thresholds alone would miss. Monitors can be created in bulk, so a single request can cover every edge region, while dry_run lets you preview how often the monitor would have alerted before anything is saved. Every monitor is created in a muted state, so your team reviews it in the Bronto UI before it can page anyone. It can also set ai_report_instructions: the investigation playbook Bronto runs when the monitor fires. We cover that below in Attaching an Investigation Report.
get_coverage: Once the monitors exist, this shows which dataset are not used in any monitors, so the gaps become the next batch to create. It reports monitored, searched, and ingesting per dataset in a single call—covered in full under Coverage, usage, and health below.
validate_monitors: A monitor is only useful if it can still fire. This tool validates your existing monitors and reports any that are no longer working as expected because their data has stopped flowing or they have been modified externally.
search_monitors: Finds existing monitors and, for a given one, returns its monitor events—the trigger and recovery history, including per-group transitions where relevant. Useful for retrospectives and as context before creating a new monitor, so the agent does not duplicate one that already exists: e.g. a useful tool to support questions like When did this alert first start firing? When did it recover? Did the same group trigger before?
Attaching an Investigation Report
The most valuable thing a monitor can carry isn't its threshold—it's the context that turns a firing alert into a diagnosis. That's what Bronto's Investigation Reports do: you attach a free-text Investigation Prompt to the monitor, and when it fires, an LLM runs the checks you described across your observability data and writes a root-cause report before the responder reaches their keyboard. Their job shifts from gathering evidence to reviewing a diagnosis.
The playbook for an Investigation Report can come from two places:
Your own operational knowledge — what dependencies matter, what healthy looks like, and what an on-call engineer would check first.
The AI itself — after it has inspected the datasets and fields through MCP, it can write the monitor and the Investigation Prompt in the same call.
Use Investigation Prompts where the cause is ambiguous at fire time. A no data alert may not need a long explanation; a noisy, multi-signal failure often does.
We'll look at a real report later in the post: a short, generic playbook turns into a detailed diagnosis once it runs against the live schema and recent data.
Preserving analysis context
Not every query belongs in an alerting pipeline. Some are exploratory views or triage workflows: combinations of filters, field predicates, and aggregations that are useful for understanding data but do not warrant a page. Instead of leaving them in one engineer's terminal history, the AI can save them for the team:
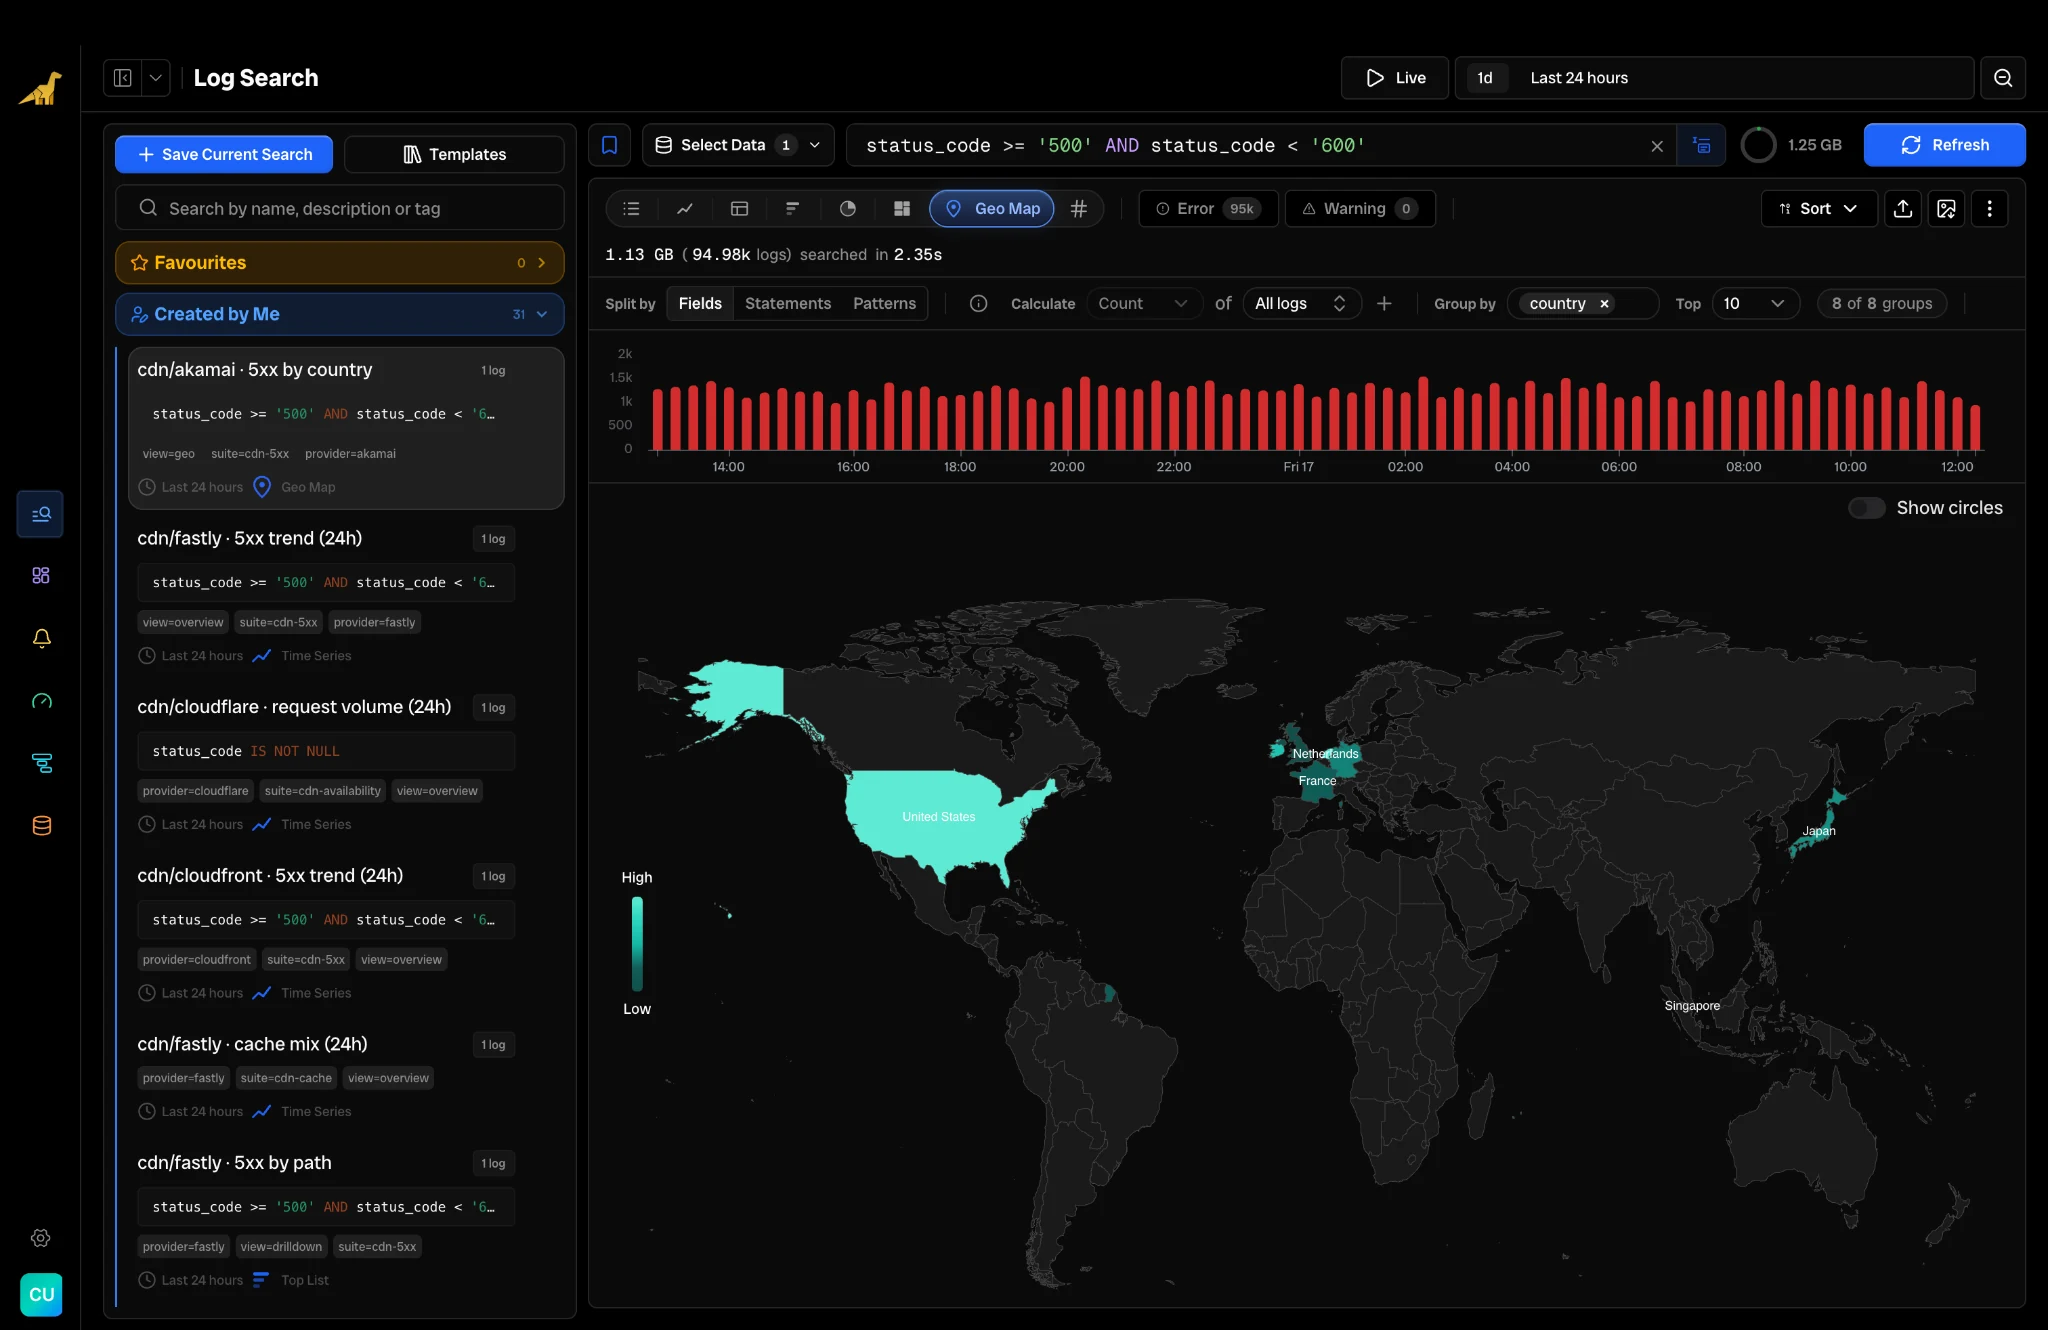
create_saved_search: Packages a query, names it consistently and saves it, also making it visible in the Bronto UI. The AI creating the saved search can also choose how the saved view renders—not just as a raw event list, but as a timeseries, a ranked top-list, a table, or a geomap of request origins by country. So show me 5xx errors by edge location does not come back as a wall of log lines; it lands in the UI as a map the on-call engineer can read at a glance. It supports batch creation, with a dry-run mode to validate the whole set first, so the agent can stand up a suite of related triage views in one shot.
Tagging: The AI applies consistent tags to bind a set of searches into one investigation or reusable triage suite—for example,
investigation:cdn-5xxorsuite:origin-triage—so on-call engineers can pull up the whole viewpoint during an incident or post-mortem.
get_saved_searches: Lets the agent see what searches already exist. This is useful for encouraging reuse rather than reinventing one-offs, and for building a shared library of searches over time. It also makes it possible to assemble a curated set of searches that power tight, specific reports without the AI having to work out how to query the data each time, saving tokens in the process.
run_saved_search: Executes a saved search by ID, so the agent can reuse a validated query instead of rebuilding it. It returns the same event or aggregate result as running the underlying query directly, while allowing the time window to be overridden for the current investigation. Together with get_saved_searches, this lets reports and investigations reuse searches consistently while reducing query reconstruction and token use.
Coverage, usage, and health
An automated environment needs a handle on cost and coverage even more than when there is a human in the loop. Bronto exposes tools that help answer a few simple questions: is data still arriving, is anyone using it, and is it being monitored?
get_coverage: Reports, for every dataset, whether it is monitored, searched, and still ingesting data. A dataset that is ingesting log events, but has no monitors may be a blind spot at worst or at best a dataset that may not be useful - you'd like to know which. (The search and ingestion axes are drawn from the usage API, so require the caller's role to have billing access, otherwise it returns unavailable.)
get_error_summary: A pre-computed, organisation-wide view of errors and warnings per dataset. Because it is pre-computed, it is fast and costs zero search quota to run. It is also a cheap first pass for investigations: when errors spike, the agent can narrow the blast radius before running deeper searches.
Combining these tools turns coverage into an audit: data you pay to ingest and parse but nobody queries, stale data that may no longer be useful, live datasets that are ingesting without monitoring coverage, and a summary of where there are errors.
A worked example: auditing a whole CDN collection
In the previous post, we used CDN prompts to investigate what was happening in live log data. Now that we have the new tools described above, we can do the operational version: hand the agent a goal and it does the discovery and builds multiple; constrain it and it does exactly that and no more.
There are really three phases in the workflow:
Assessment: where am I missing observability?
Action: create the missing monitors and saved searches.
Monitoring: review related monitors and searches, then attach enough playbook context that a future alert starts with a report rather than a blank page.
Assessment: where am I missing observability?
The first step was not to create anything. It was to ask Claude what was missing and see Claude use the MCP Server tools:
Which datasets are ingesting data but are unmonitored?
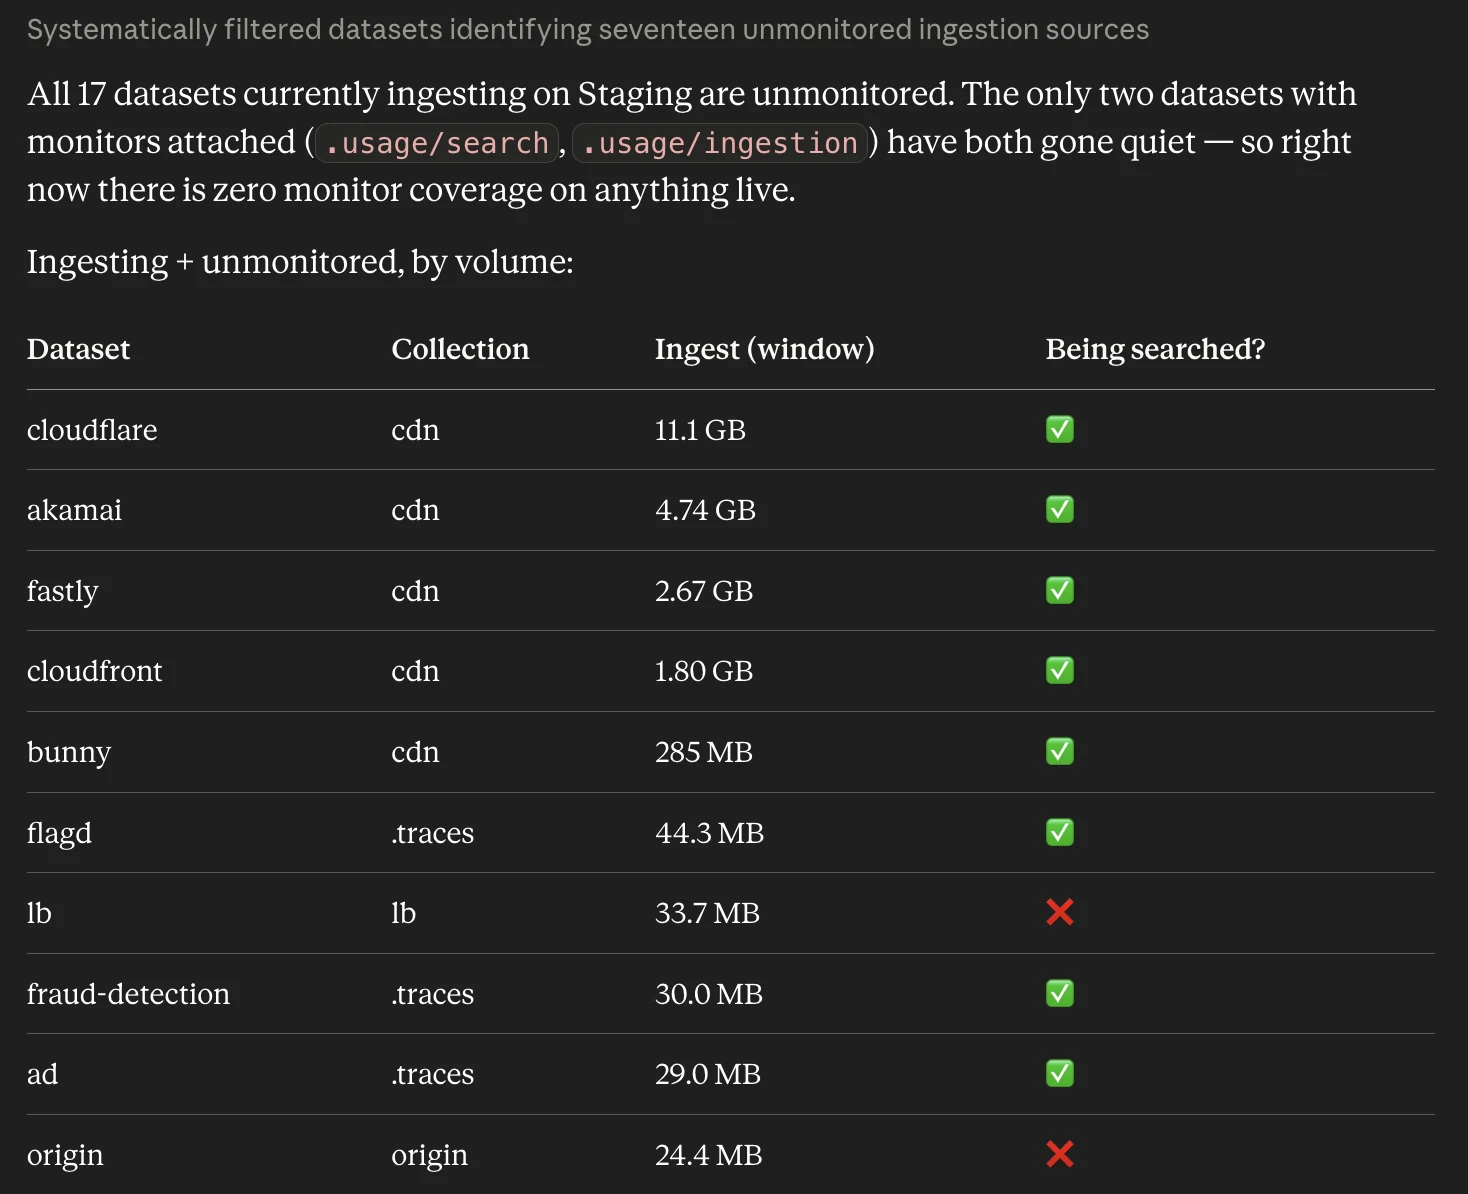
Coverage audit showing ingesting datasets without monitors
Which datasets ingest heavily but are never searched?
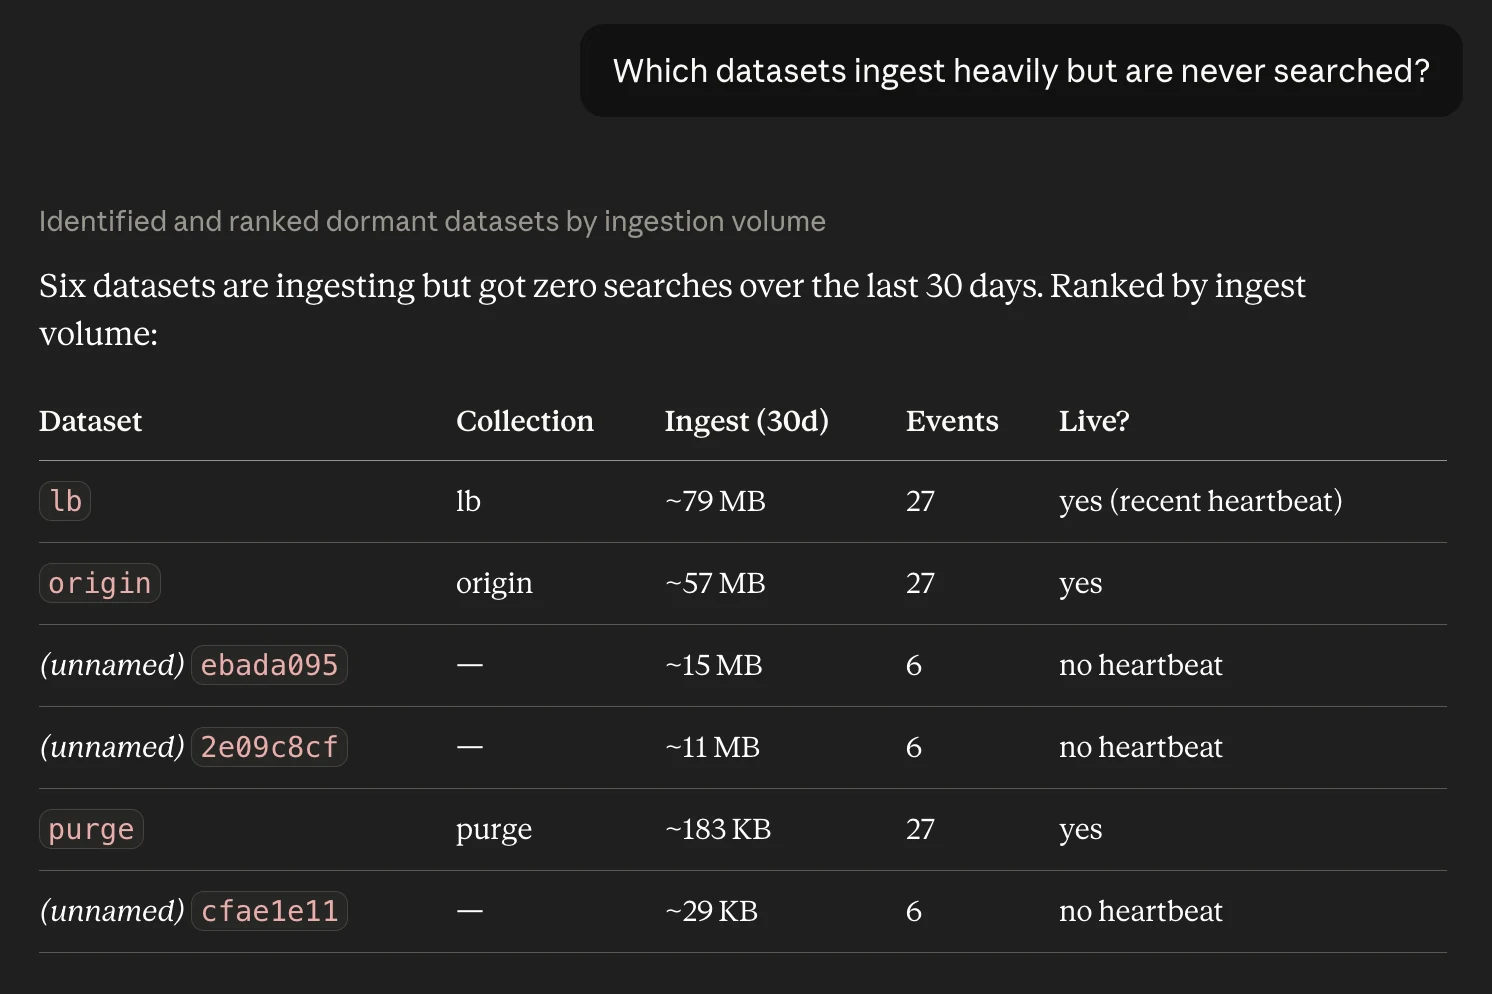
Coverage audit showing ingest-heavy datasets that are never searched
Which datasets have gone stale?
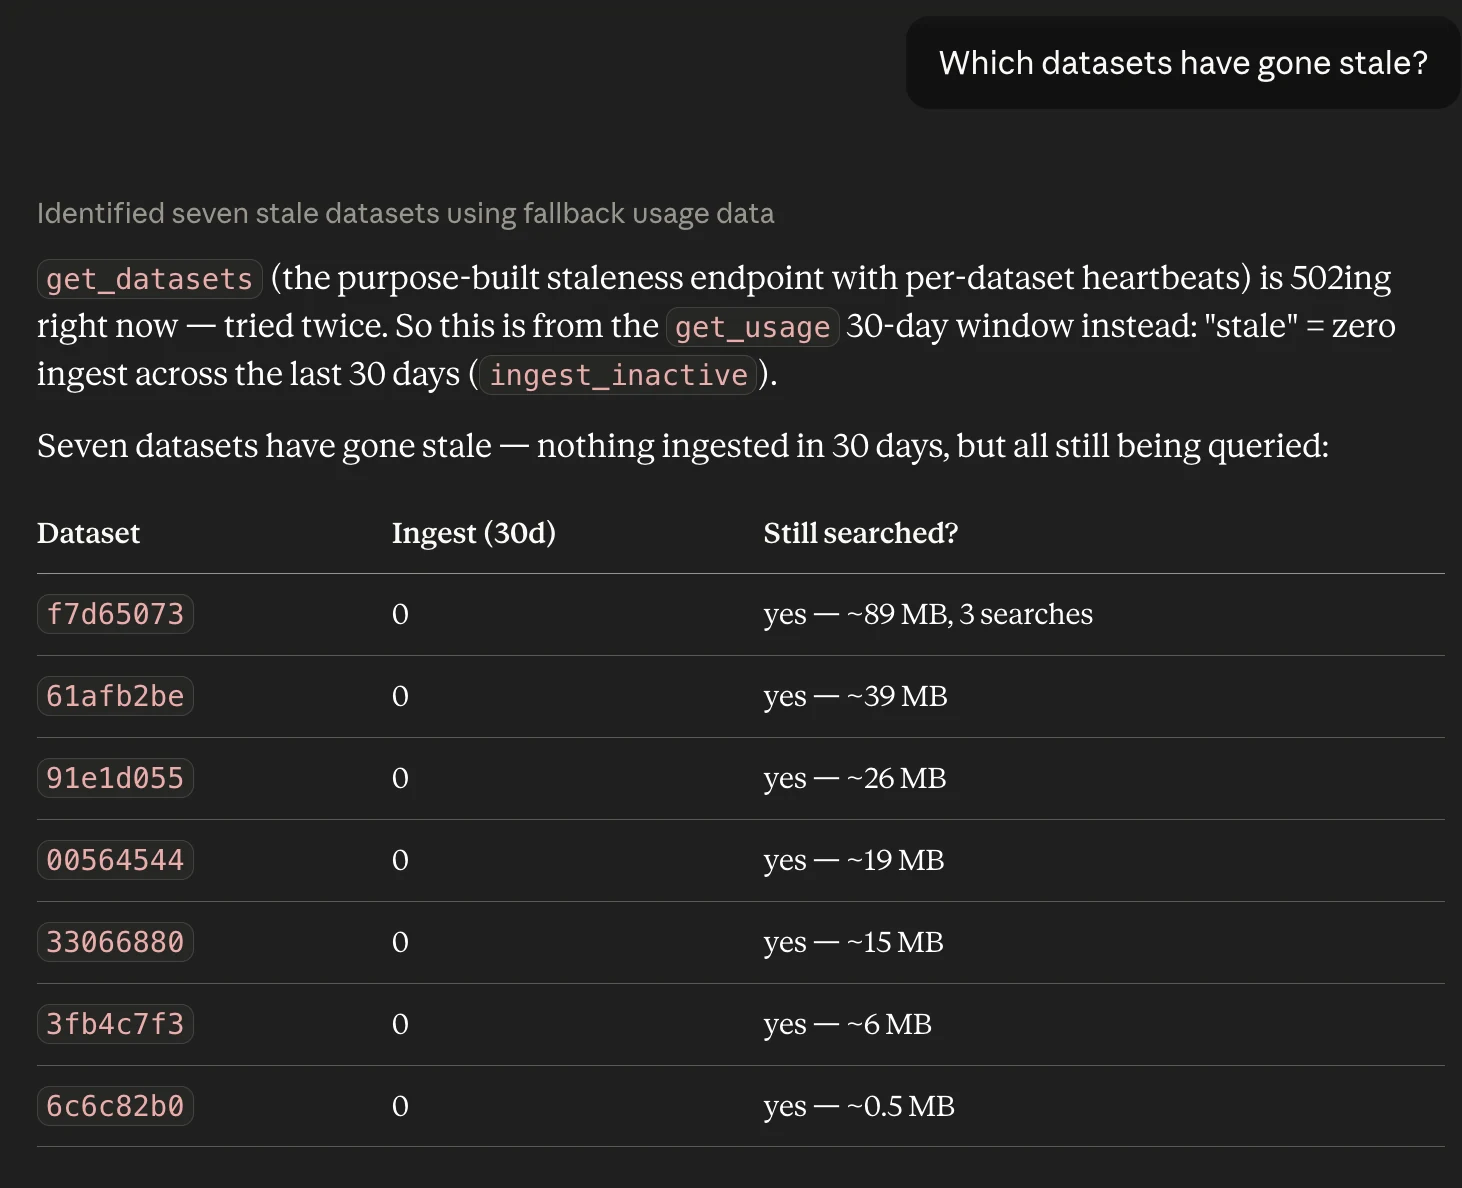
Coverage audit categorising stale datasets by recency
Which datasets have a high volume of errors and are unmonitored?
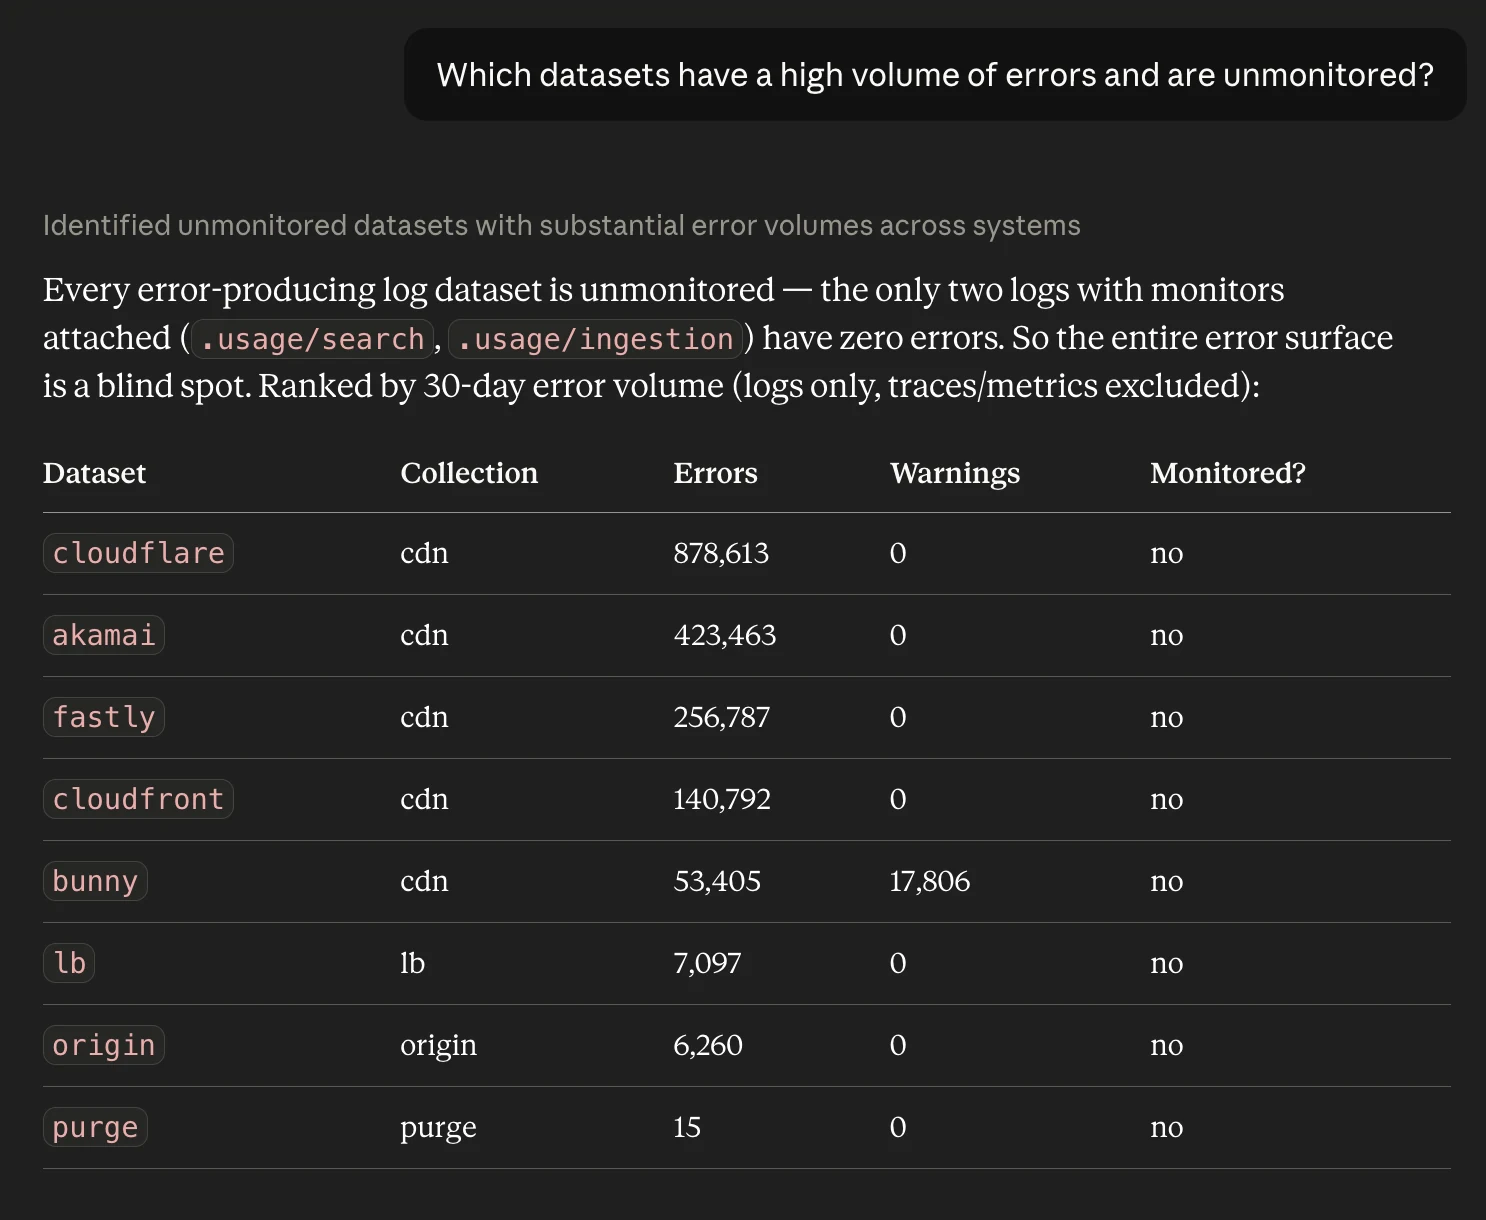
Coverage audit showing high-error datasets without monitors
With a few prompts, the agent can assess which areas of the system are not getting the attention or observability coverage they need.
The answer came back indicating a poor level of coverage: the cdn collection had live data, but not enough monitors or reusable searches around it. So the next step is to create the missing resources, then run the coverage check again.
Action: create the missing resources
With the gaps identified, we're at a decision point. From here we can go one of two ways: a directive prompt, or an exploratory one.
A directive prompt spells the work out: which datasets, which filters, which saved searches. This is the mode for when you bring a new service online and you don't want the agent creating anything beyond exactly what you've specified. In the next section we'll run both against the CDN collection and compare what each produces.
An exploratory prompt is a single line describing the outcome you want, letting the agent decide what to build. This is the mode you reach for when you want to explore the data yourself, when you don't fully know what's in there yet and you want a feel for what might be useful. You're giving the agent room to survey the collection and surface what matters. The quality of results will be heavily dependent on the underlying model used to run the prompt.
Directive Prompt
For the directive prompt, we spelled out the work for the agent to do:
> For each dataset in the cdn collection, create monitoring for validated 5xx spikes only. Call get_keys on each dataset first and build only on fields you've confirmed exist. status_code is a STRING on these datasets — use a lexical range (status_code >= '500' AND status_code < '600'), not a numeric comparison. Per dataset, create: one 5xx-spike rate monitor, one overview 5xx trend saved search, one 5xx drilldown saved search, and one geo-map saved search grouped on that dataset's country field. Set the spike threshold per dataset rather than one global number, and note where a provider's baseline 5xx rate is already elevated.
This resulted in the agent creating five 5xx-spike rate monitors, one per dataset, each computing errors / total * 100 with per-dataset thresholds derived from that provider's own baseline, all created muted for review and scoped, as required, to the validated 5xx rate monitors the prompt asked for rather than the broader signal set the datasets could support.
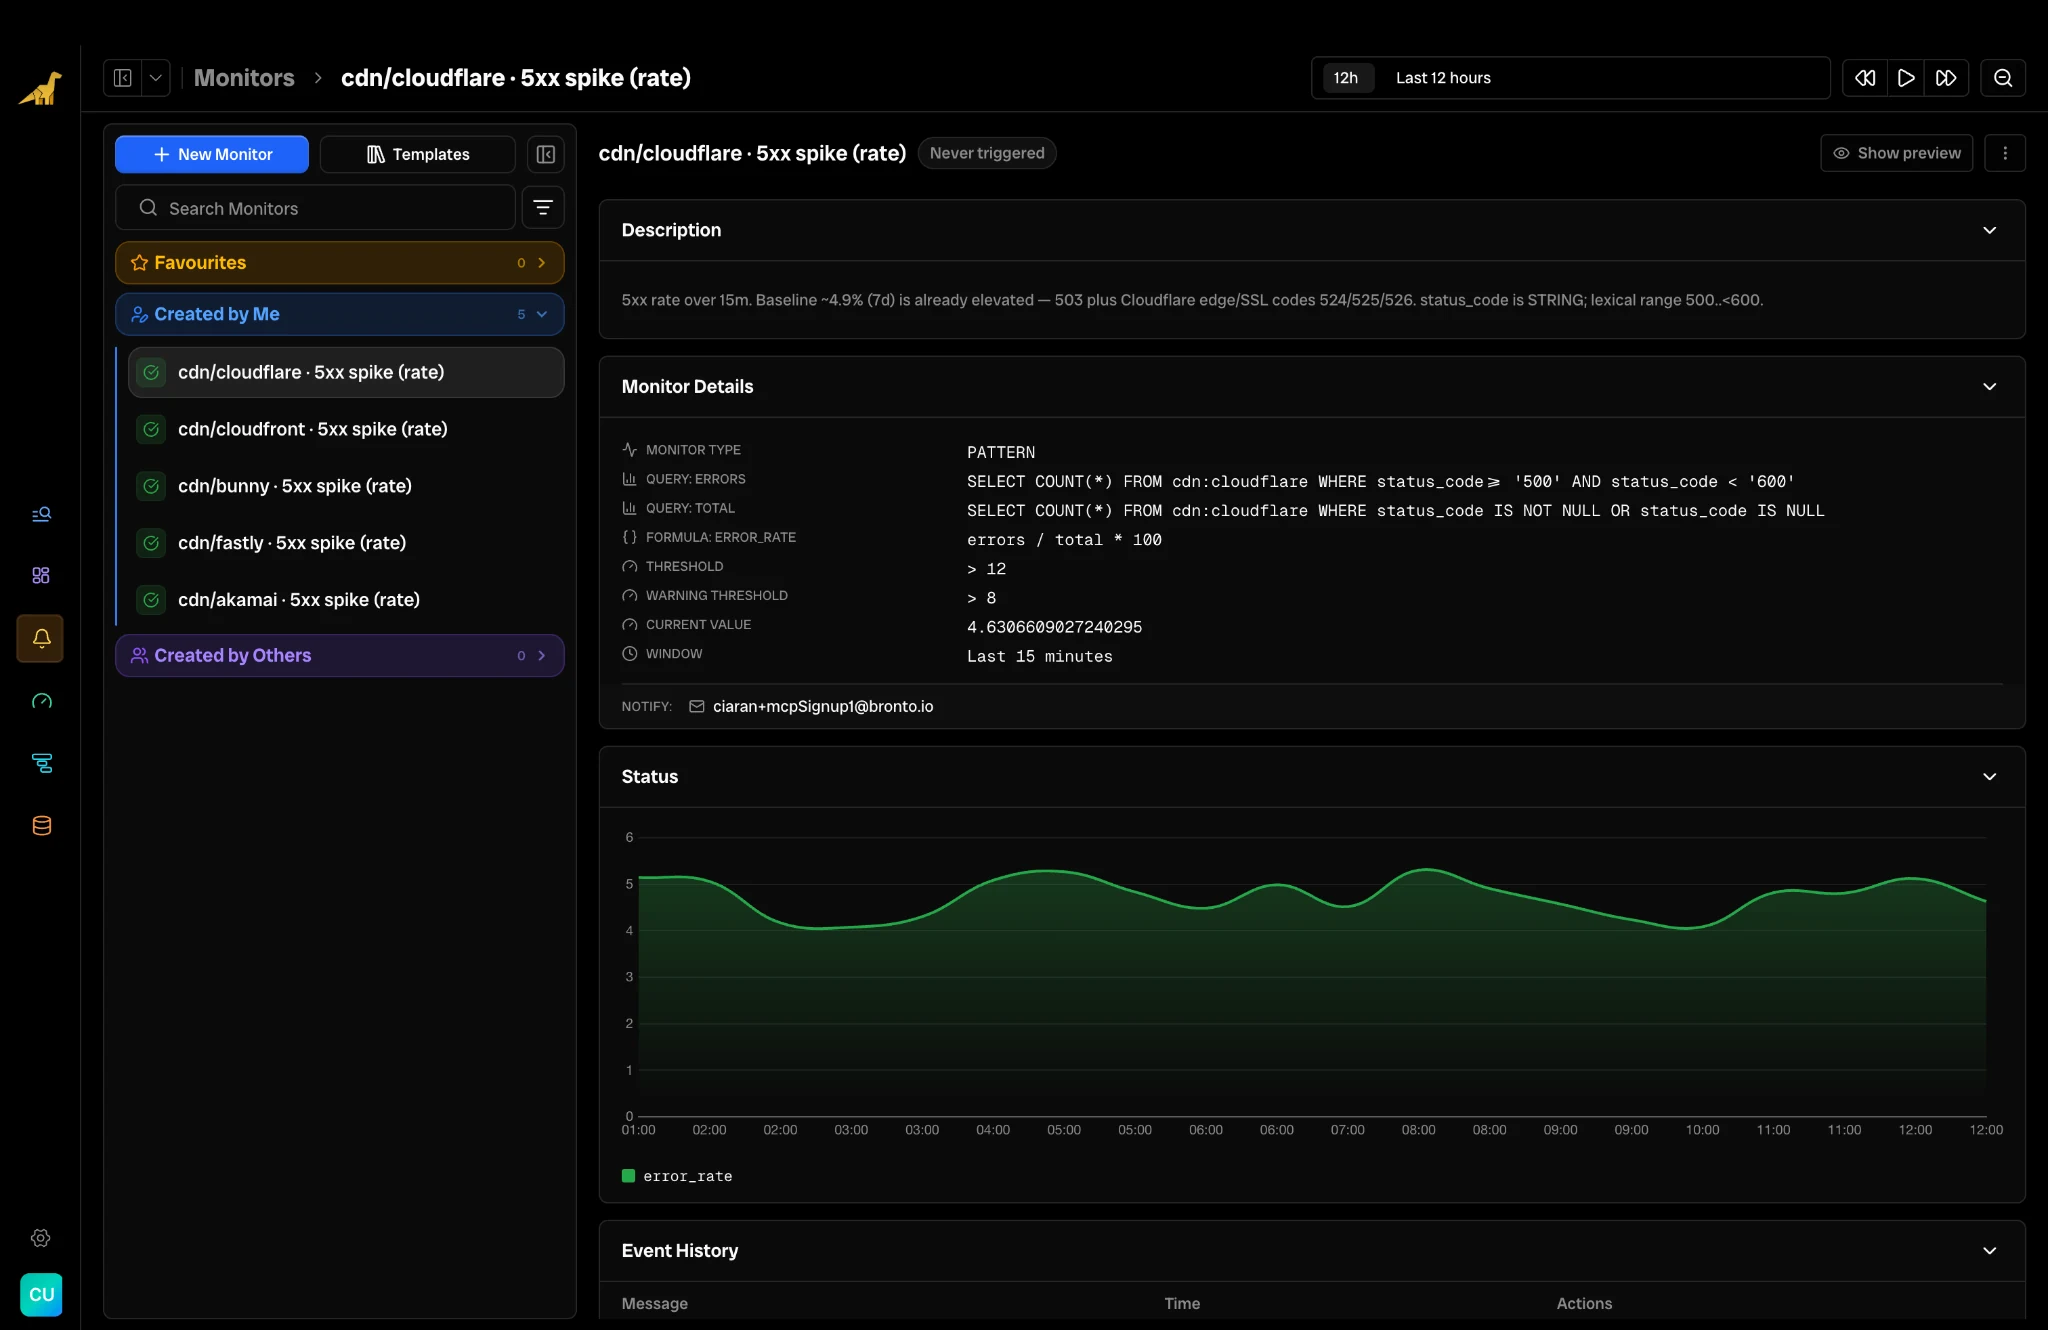
We also created 14 saved searches tagged suite=cdn-5xx, giving each dataset a 5xx trend overview, a 5xx-by-path drilldown, and a geo-map on its country field with CloudFront getting only two, since it has no country field.
Exploratory Prompt
The exploratory prompt was one line:
> Create useful saved searches and monitors and for the cdn collection and any related services.
That one line still did the discovery work first: check coverage, inspect errors, read the vendor schemas, dry-run the resources, then create the useful monitors and saved searches muted.
The exploratory prompt produced 11 new monitors, primarily focused on cache utilization and traffic volumes (all created muted, pending your review/unmute):
Cache hit-ratio drop (×5 providers) hits ÷ total, using each provider's own cache vocab; fires when it drops below baseline − ~15pp (Cloudflare 50/56, Akamai 62/68, Fastly 54/60, Bunny 54/60, CloudFront 62/68)
Origin 5xx rate (Cloudflare only) — origin_response_status 5xx ÷ total; fires above 3% (warn at 2%), baseline ~1.2%
Traffic drop/stall (×5 providers) — COUNT(*) over 15 min; fires below ~30% of steady volume, plus a no_data→ALERT to catch log-delivery stalls
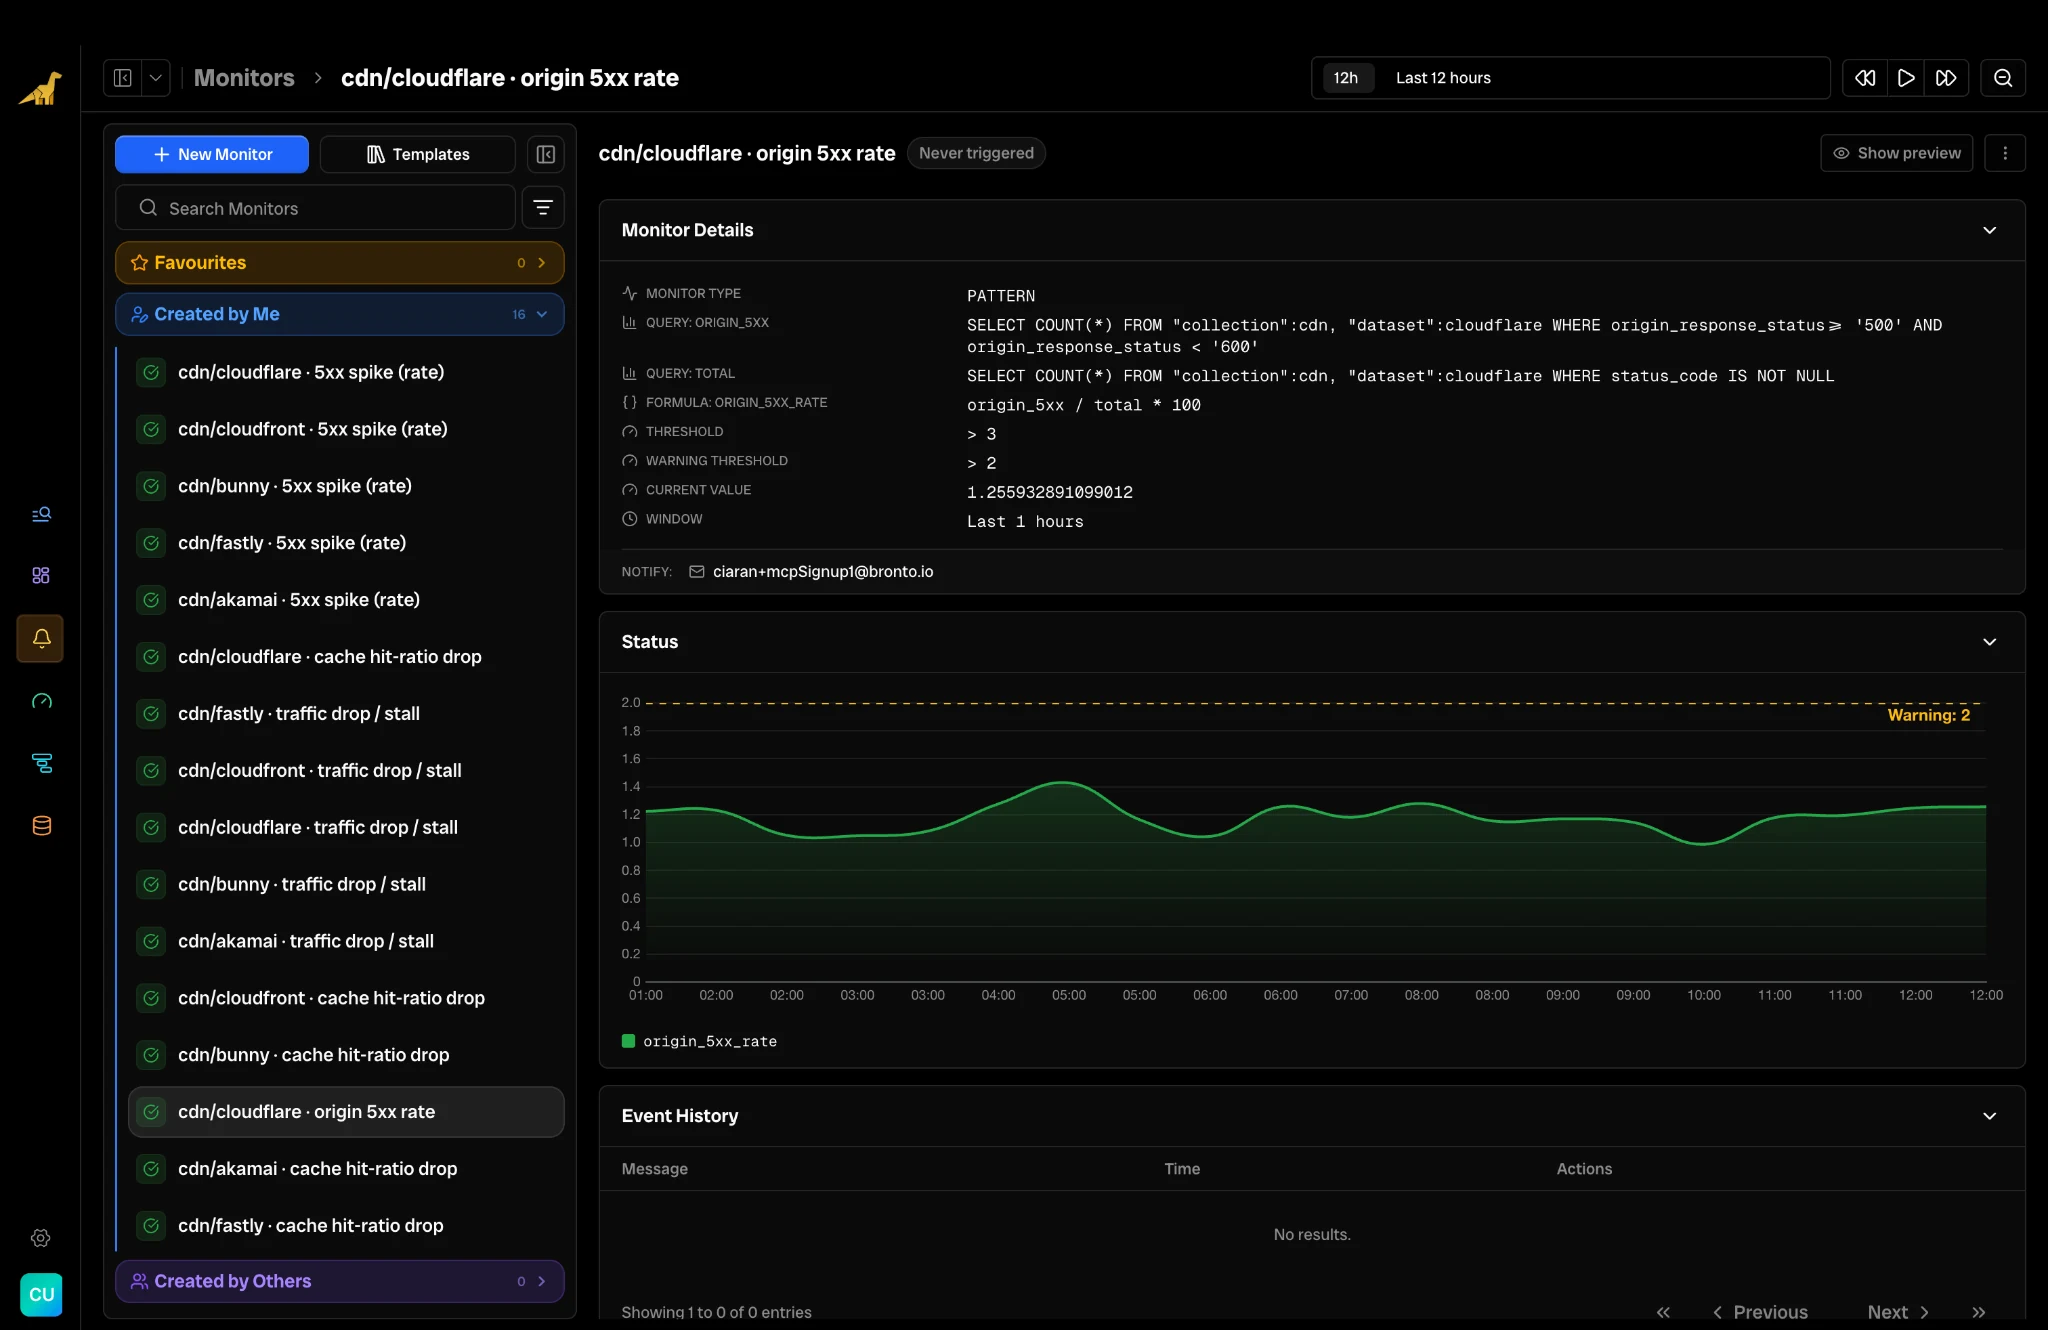
We also created more saved searches, 17 across three tagged suites (cdn-cache, cdn-origin, cdn-availability), mirroring the existing cdn-5xx overview/drilldown convention.
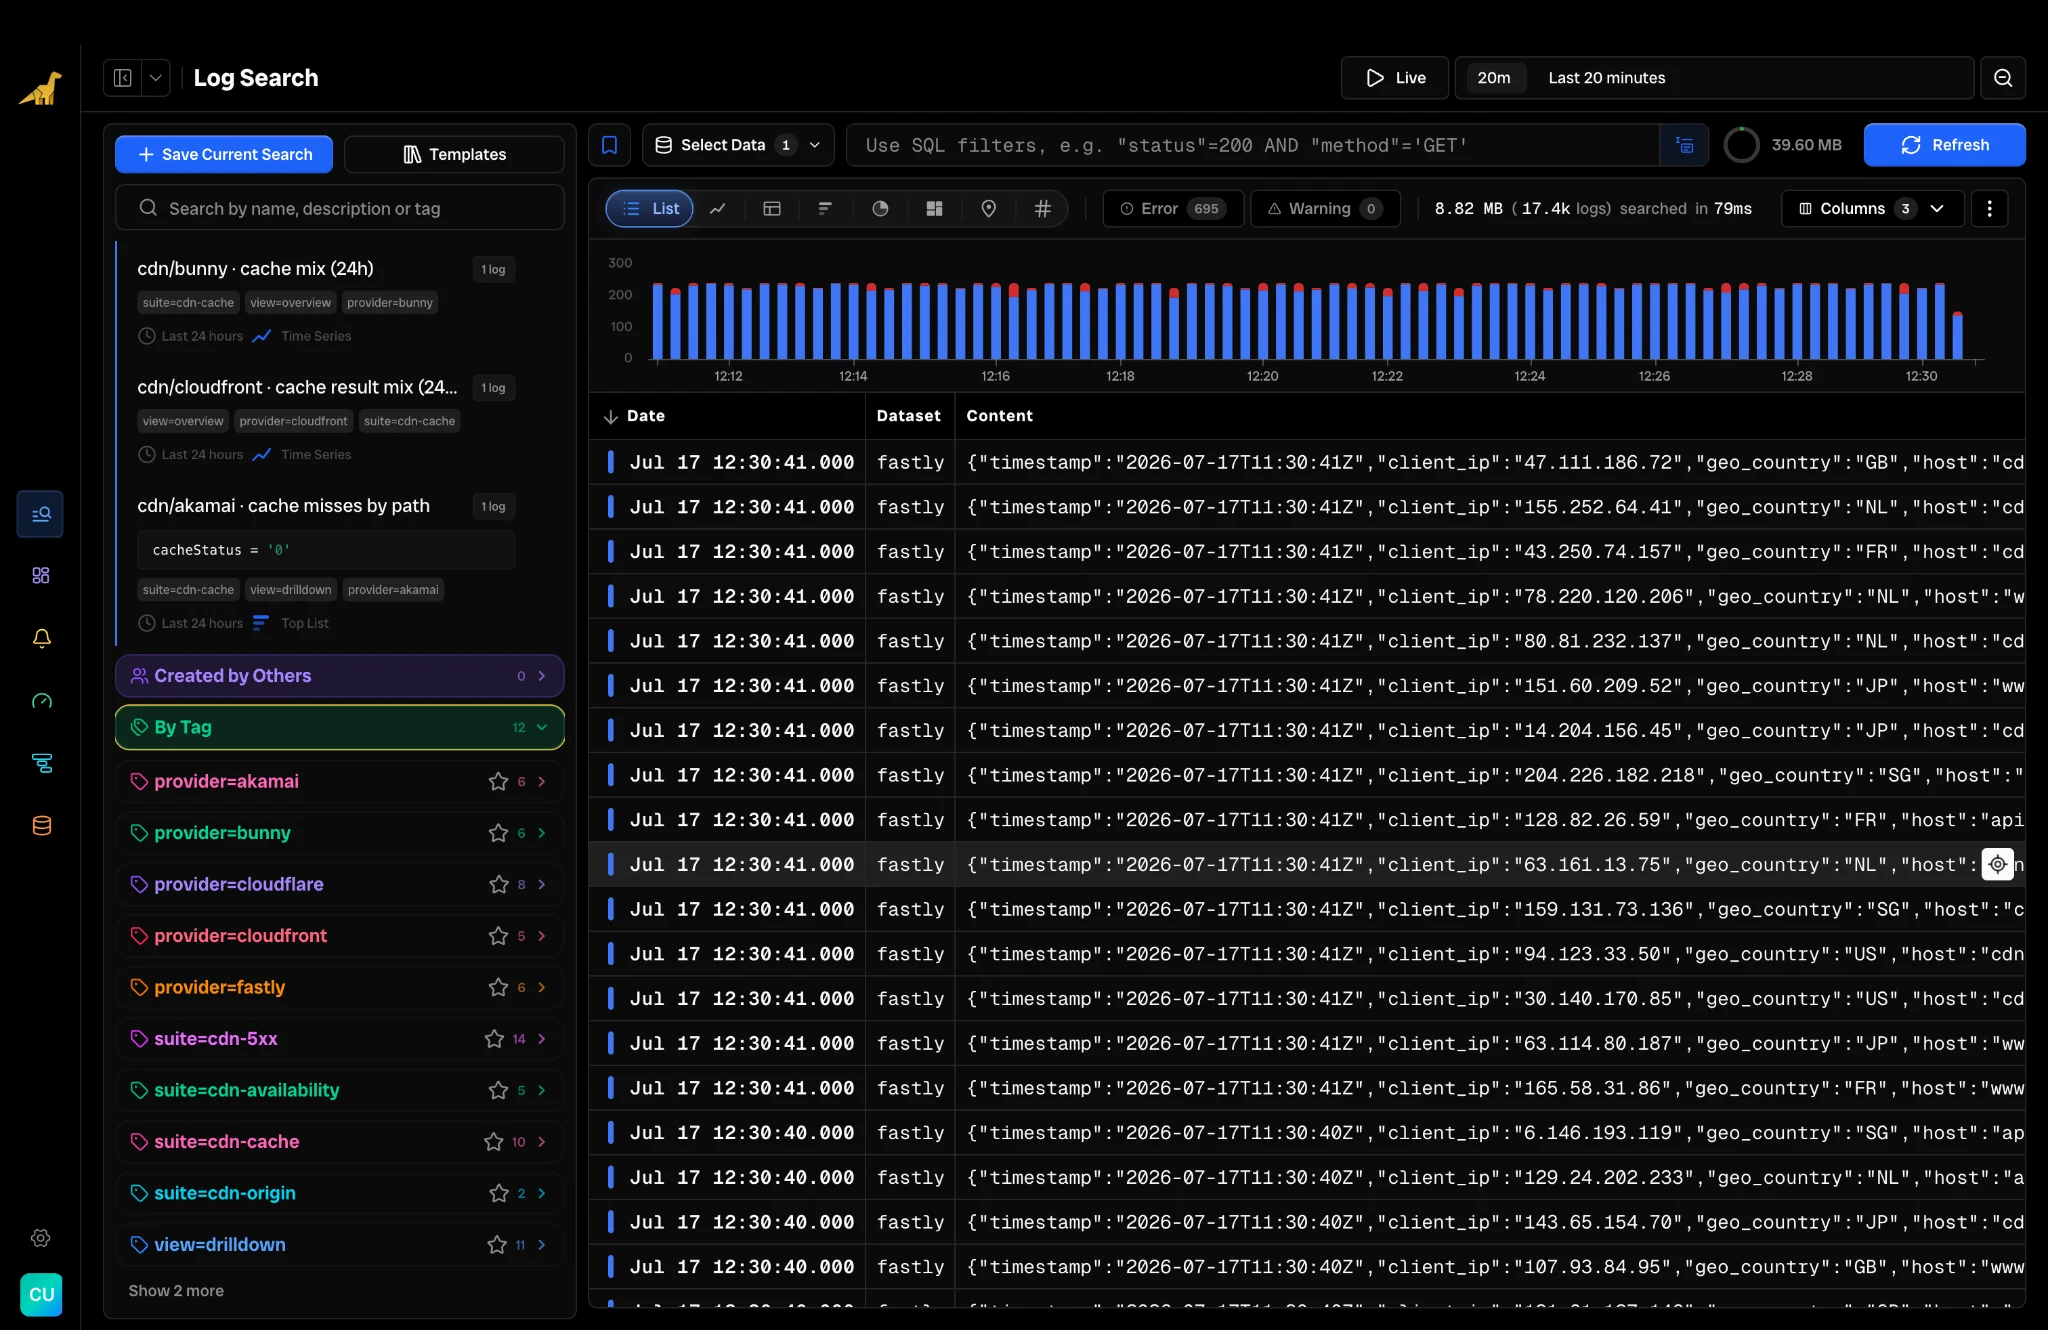
In both the above cases, the useful output was not just a count of resources. It was a small operating surface: muted monitors to review, saved searches grouped by purpose, and visual drilldowns that make the next investigation faster.
Both runs produced similar output at similar cost. The difference was the exploration: the exploratory prompt let the agent look around and build a few extras it decided were worth having, while the directive prompt built exactly what it was told and no more.
Exploratory prompts are for discovery and coverage; directive prompts are for rolling out a new system or service into an already mature environment.
In both scenarios, we produced an ai playbook that will run when the monitor is fired.
This is discussed in more detail below.
Monitoring: from playbook to report
Creating monitors and searches is not the end of the workflow. The agent can also inspect related monitors and saved searches, avoid duplicating what already exists, and attach the investigation context, in the form of an Investigation Report, that should run when a monitor fires.
For runs of both the exploratory and directive prompts, Claude used this capability by adding the following Investigation Prompt automatically to the monitors it created using the create_monitor tool:
> On fire, call get_keys; split 5xx by status_code and path; split by edge/PoP and country; check cache outcome and latency; check for a traffic surge; stay within the CDN data — no origin logs exist.
An example of the Investigation Report it produces can be seen below.
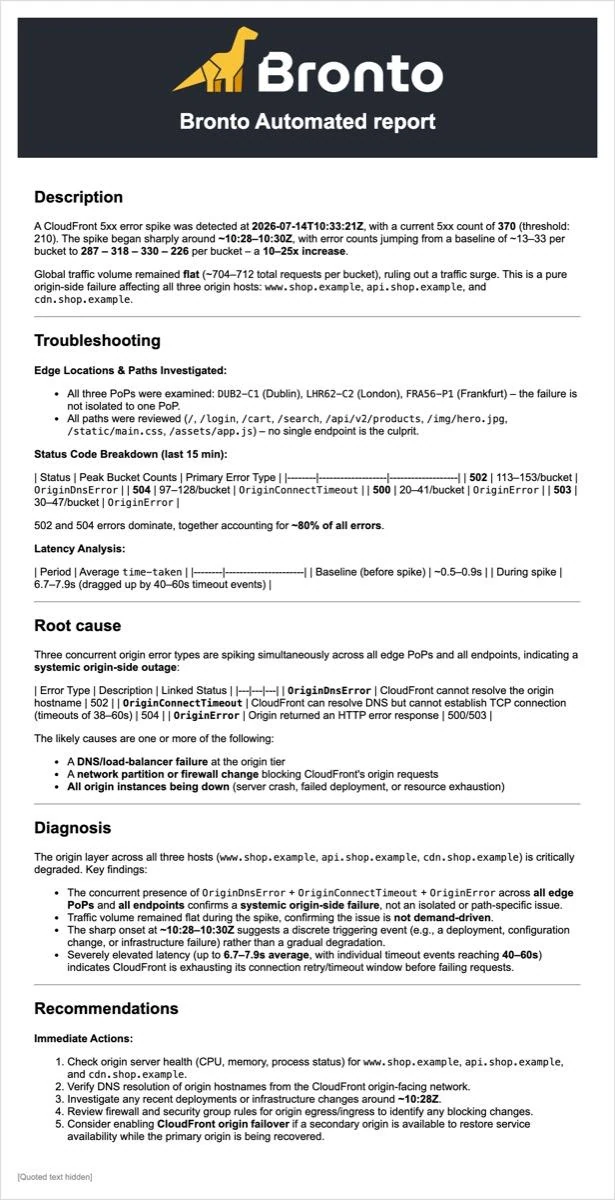
The Investigation Prompt should be a short, sentence of intent:
What should on-call check first?
What is the impact on downstream services?
What other queries should I run?
When a monitor fires, It will perform multiple queries behind the scenes, and create a diagnosis in the notification instead of a bare threshold breach.
The playbook above doesn't have to stay this minimal, either. Because the agent already knows the dataset shape, you can ask it for a deeper Investigation Prompt — one that checks upstream and downstream impact, not just the CDN layer — and it writes that playbook in the same call that creates the monitor. The tools don't just produce guardrails; they can produce the triage logic too.
Note: this example uses simulated CDN data. Any monitors created this way should still be reviewed carefully before they page: check the query, grouping, threshold, window, severity, and playbook against your real traffic patterns.
Closing thoughts
If we step back, it's worth noting what we did using Bronto's new MCP Server tools. We handed an LLM (Claude in this example) a one-line goal, as either exploratory or directive, and it understood our environment—built the searches, created the monitors, and wrote its own playbook for each one. When a monitor fires, that playbook runs the steps the model decided mattered, handing the on-call engineer a diagnosis to start from instead of a blank page.
That's what these new MCP Server tools are for: giving the LLM a predictable, efficient surface in Bronto to work against. The model brings the reasoning; the tools make it repeatable, reviewable, and easy to run. And the engineer stays in the driver's seat throughout, complementing the model with domain knowledge it cannot infer, directing it toward what matters, overriding what it gets wrong, and asking for confirmation before anything goes live.
Muted-by-default review is one expression of that, but the whole workflow is built for it: monitors, saved searches, and playbooks created from natural language and kept long after the investigation that prompted them. If you want to get started with Bronto, you can start a 2-week free trial today.
Enjoyed this post?
Share it with your team or network.

Try Bronto free for 14 days
Centralize your agent and infrastructure telemetry in one platform with sub-second search and 12-month hot retention.
- 14-day free trial
- No credit card
- Set up in minutes