It's the data, stupid
Noel Ruane
Co-founder, Co-CEO
Trevor Parsons
Co-founder, Co-CEO
At Bronto, our contention is simple:
In an AI world, you need your observability data. All your observability data.
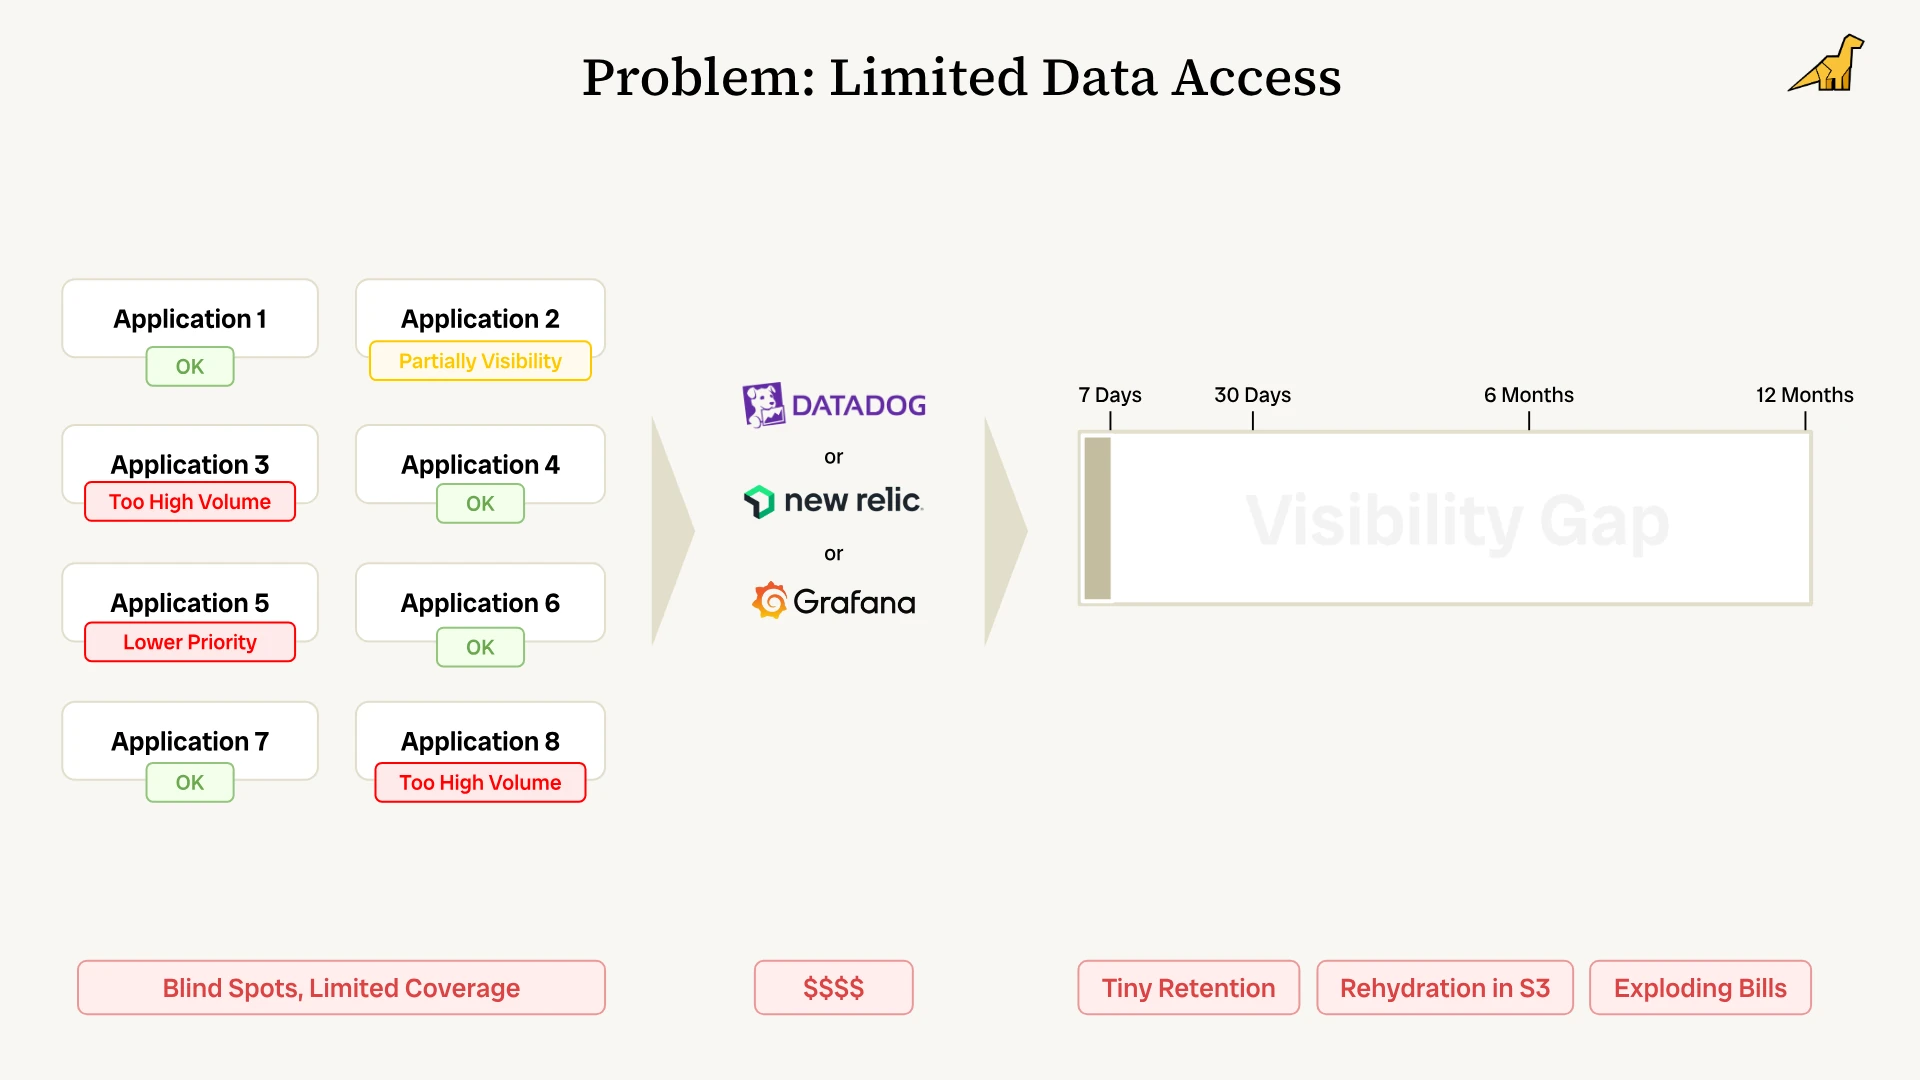
However when it comes to observability data, the standard pattern is for teams to have access to a small subset of this. Typically teams may only keep days' worth of data to manage costs - after that, it's archived and requires rehydration to use or they may lose fidelity by only keeping samples of the data. In some cases, data never makes it to storage. It's simply dropped.
This pattern is often represented as a cost problem as observability costs can run as high as 20-30% of infra spend - but that actually completely minimises it - it's much bigger than that.
Many teams are actually over-paying for only a sliver of their observability data and so have limited ability to find faults or monitor their services and systems. We’ve been told this is normal and so we’ve largely accepted it. It's time to rethink observability.
In reality, this is not a cost problem... It's a data problem.
What's possible with 100-1000X more data, enriched & served any way you like
If you had instant access to an order of magnitude more data, it fundamentally changes how you work.
What could you do if you had 100 to 1000X more telemetry data than you do today?
What if the data was automatically parsed, structured and enriched with context?
What if you could search and analyse it with sub-second response at petabyte scale?
Would you have to sample, rehydrate data, or shorten retention windows to 3, 15, or 30 days?
You would effectively eliminate blind spots and expand monitoring coverage to new areas.
Instead of bottlenecks of sluggish search and slow analysis, a single engineer could get answers 100X faster. You could spin up dozens of parallel analyses via AI SREs during an incident.
With this new scale of data access, you could also surface deeper insights:
What if patterns and confidence-scored anomalies were automatically identified?
What if that context compounded as you used the system - getting richer and more valuable?
What if all of this was made available via an MCP server and a rich and fully public API?
What if you could write a prompt to spin up a whole new observability UI on platforms like Lovable or v0?
And of course, you'd still be able to simply log into a traditional observability UI, search all this extra data, and interact with AI workflows to quickly perform Root Cause Analysis (RCA) on it.
The evolution of Bronto: from best-in-class logging to full-stack observability
When we started out, Bronto was focused squarely on fixing the data problem for logging.
Now, Bronto is a full-stack observability data platform that lets you keep 100 to 1000X more instantly searchable data (logs, traces, & metrics) compared to what teams are paying incumbents like Datadog or Grafana Labs.
This is based on both a disruptive technology & pricing model, not merely a retention setting. Datadog runs about $2.60 per GB at 30 days retention against roughly $0.20 per GB all-in with Bronto at 12 months retention. This is not a 2X or 3X improvement as with many of the newcomers in this space building on top of ClickHouse, but an order of magnitude difference.
Bronto also automatically applies data hygiene, structure, intelligence and enriches this data with compounding context that gets more valuable the more you use the system.
The more context you have, the more useful your telemetry data becomes - and the easier, faster and more efficient it is to perform root cause analysis and reduce mean time to resolution.
And Bronto makes ALL your data available to you any way you want it, e.g. through our platform UI, MCP server, REST APIs, via AI SREs, or even via your own custom UI.
At Bronto, we believe in this simple equation:
All your data + intelligence applied = better outcomes
The age-old observability problem
In recent years we've seen the open source OpenTelemetry (OTel) movement do an amazing job at largely solving the data collection problem. OTel has removed the need for vendor lock-in via proprietary data collection agents and has provided a standard for how to collect the three common signals in observability - logs, traces, & metrics.
By the way, Bronto is fully OTel native as we believe you should be free to send your data wherever you get the most value. However if you have non OTel data we’ll accept that too and automatically parse it - we’re an equal opportunity data platform.
Observability vendors have not held up their side of the bargain however and have failed to innovate around data ingestion, storage and search.
Why? Observability vendors have relied on repurposed data stores that were not purpose built for telemetry data. These datastores can be "configured" to work with observability data, but typically break or become troublesome when something changes whether that’s the shape of your data, queries or scale of the data they have to deal with. This burden, and in particular the associated costs get passed onto the customer.
More specifically, vendors have failed to address the specific issues related to each signal type:
Logs - Logging at scale was typically expensive or slow or both. Under the hood this was a result of limited technology choices of the vendor. In the old days Elasticsearch was typically the data store of choice where inverted indexing blew up with high cardinality and costs blew up alongside that - these days it’s typically ClickHouse (almost all new vendors build on this today) - which is a better choice, especially if you know the structure of your data. But running ClickHouse as a general purpose observability store is well documented as an engineering project rather than a product: it works, and it costs you engineers to keep it working. There are also tech issues under the hood e.g. the deep separation of compute and storage only arrives with the paid cloud product, so open source deployments stay tightly coupled, replicating metadata to every server. If you are an observability vendor built on that, you inherit all of it. It means you get it a little cheaper and a little faster than what you were used to but not the orders of magnitude difference that you require to rethink your stack for an AI era.
Metrics - Metrics vendors have relied on limited time series databases that were great until you had high-cardinality metrics - then the cost exploded. Pair that with per host costs and you’ll find yourself rolling your own solution pretty quickly.
Tracing - Tracing relied on technologies that tried to handle the volume by indexing only certain fields - meaning you were limited in the analysis you could typically perform. Vendors also encouraged sampling as they just couldn’t handle the volumes without handing you a colossal bill.
These problems have resulted in a myriad of issues starting with the biggest and most familiar - high observability costs running at up to 20-30% of your infra spend… which in turn leads to lack of coverage (blind spots), and then complexity as teams turn to building and running their own solutions to try to alleviate budgetary pressures.
Workarounds and compromises
Instead of tackling the core issue, vendors continue to perform cartwheels, trying to talk around the issue or slap on band-aids in the form of "capabilities" - think rehydration, sampling, pipelines etc. - all so they can maintain their margins and outdated business models.
The latest one we've seen is a nice bit of innovation by two of the big guys where you use Datadog on the front - wire ClickHouse in at the back and stick them together with pipelines. Now you have two solutions instead of one - somehow that doesn't seem like a solution a customer would design. It isn't a unified solution yet: you can route your logs to ClickHouse today, but searching them from inside Datadog, the half that would make the two feel like a single product, is still a private preview you apply for.
Another approach is to just accept that things are going to be slower, as per Grafana’s approach with Loki for logs and Tempo for traces, essentially index less and accept a slower analytics experience.
More recently we see BYOC pushed as the answer, so vendors can move costs onto the customer's infra. Grafana's own CTO concedes the point: BYOC "isn't designed to solve privacy concerns. It isn't designed to solve data sovereignty issues." What it is designed to do is be cheaper than SaaS. The claim is that SaaS economics don't work, so instead of innovating to make it work for the customer the suggested approach is a regression where you have to take some of the load and operational management in your own environment.
In all cases the customer is required to compromise on behalf of the vendor. At Bronto, our stated goal is to innovate on behalf of the customer.
It’s the data, stupid
Enter BrontoDB, where you get 100-1000X more data.
BrontoDB is a purpose-built polymorphic datastore designed to store all your observability data.
BrontoDB efficiently stores all your telemetry signals (logs, traces & metrics) in one place, providing a seamless experience across all data types. It’s lightning-fast at any scale and tackles the datastore problem head on.
Forget all the supposed capabilities (sampling), hacks (rehydration) and even industries (pipelines) that have sprung up because no observability vendor dared to innovate and tackle the biggest customer problem head on.
Bronto uses a single ingestion pipeline for all data signals, and addresses data explosion (whether that’s through indexing or high-cardinality metrics) combining a range of storage and indexing techniques, maintaining the speed of data access for all signals while reducing costs by orders of magnitude.
Observability data is multi-dimensional in nature - both in terms of its shape and also in terms of how it can be queried. The shape of your data can also change over time as can your queries as well as the volume and scale of data.
A polymorphic approach to observability data
Instead of a one-size-fits-all approach Bronto adapts how it treats your data based on its signal type, shape of the signal and how you query it. Your data is dynamic so your backend needs to be also. Think of Bronto as an adaptive datastore and search engine that dynamically adapts based on the shape of your data and queries.
More specifically BrontoDB was designed to meet the known challenges with indexing, storing and searching observability data no matter the cardinality or volume, so we can provide a low cost, high performing platform for our customers at any scale.
Our architecture is not based on other text search or database technologies. We have introduced specific innovations in storing and searching data (such as adaptive indexing and time based file partitioning for logs, custom search algorithms, columnar storage specific to the type of data with optimised encoders/decoders) and have combined these with the best open source software available (e.g. Kafka, Redis, etc.) while following best in class engineering practices (e.g. stateless computing, decoupled storage and compute, large scale parallelization and serverless computing) that allow us to both store the data efficiently at ingestion and enable cost-effective fast search and long term retention.
As such BrontoDB solves the following problems:
High-cardinality metrics cost issue
High-cost log ingestion and storage costs
Having to sample traces
Slow search or slow data access at any scale
A need for rehydration
Short data retention to save on costs (3 days, 7 days, 15 days)
Self hosting/managing open source solutions to save $$$
In other words, BrontoDB achieves the 4 Ls of observability across all telemetry signals (logs, traces, & metrics):
Low cost
Low latency
Large scale
Long-term retention
Add compounding context, an intelligence layer that gets more intelligent over time
Now that you have ALL your data in one place… what can you do? In an AI age, eating your vegetables matters a lot more than it did when you had a small team of DevOps folks looking at your data.
It’s now even more important to follow best observability practices and for your data to be parsed, structured, clean, with the right metadata and tags and with the right context applied.
If you do this part right - applying AI will give infinitely better results as it’s only as good as the data it's referencing. Bronto adds an intelligence layer to your raw observability data.
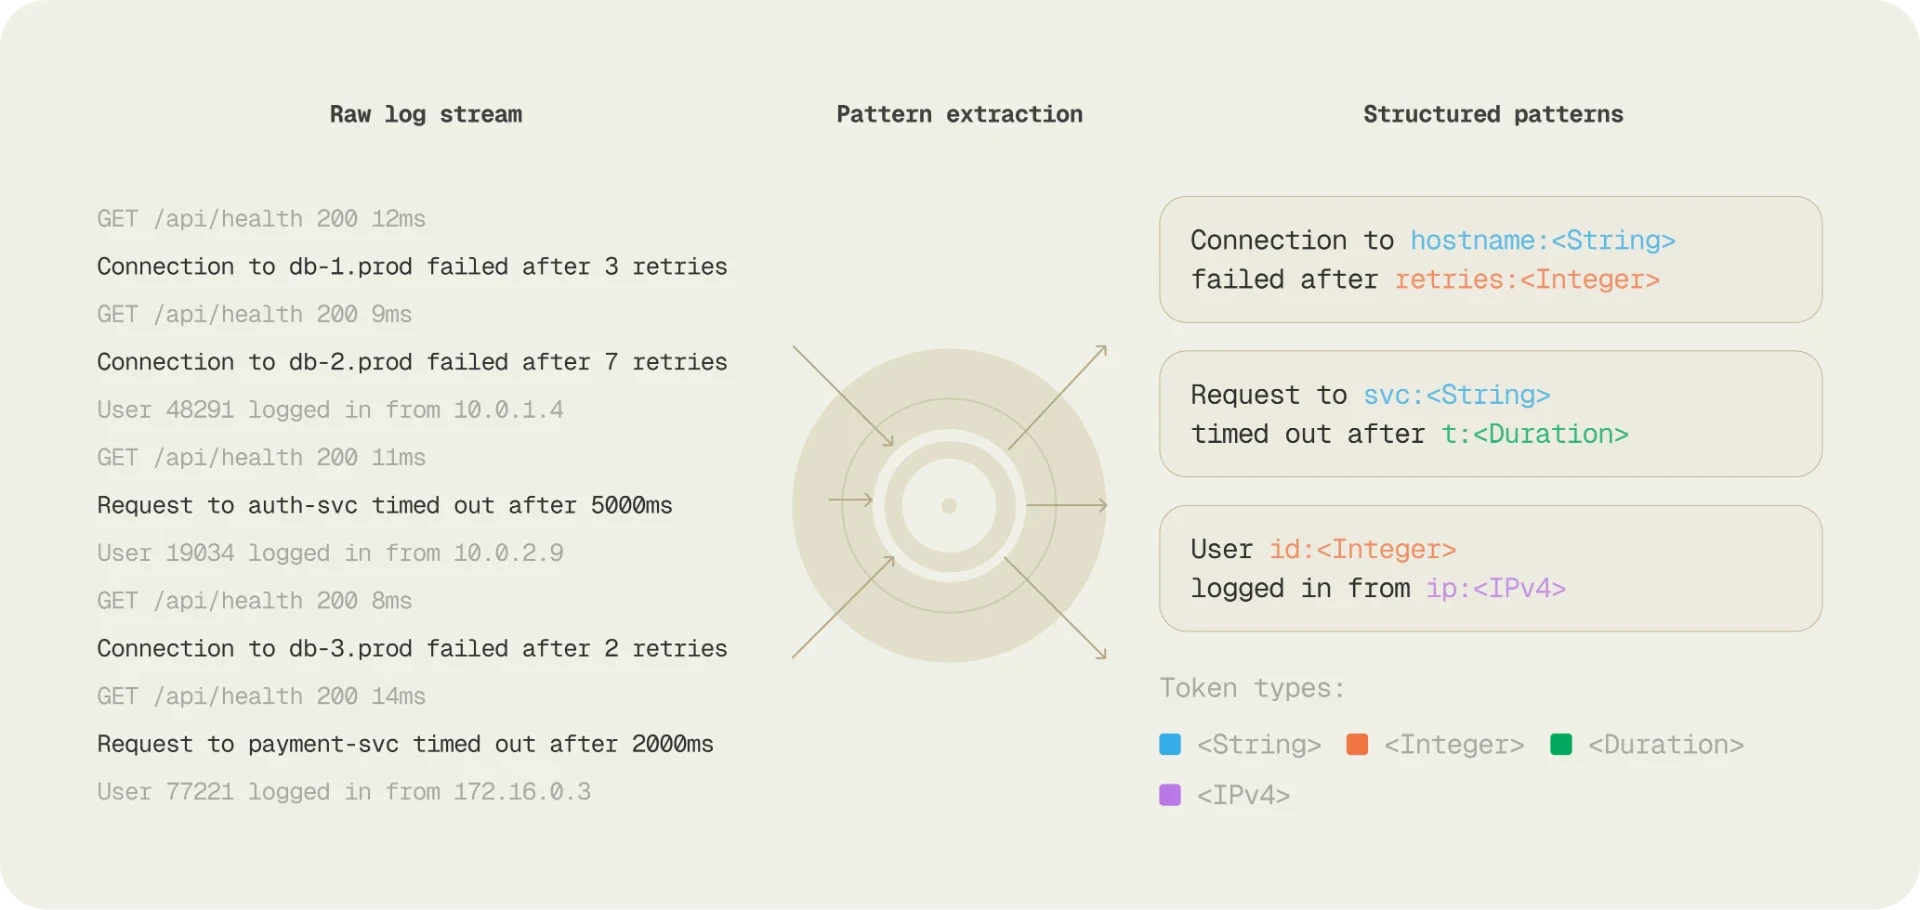
The Bronto intelligence layer structures your data as it arrives: parsing, partitioning, performing coverage analysis, and extraction of unique events and patterns, with anomaly scoring arriving on top of that. This ultimately builds a rich tapestry of meaning on top of your raw data, resulting in better outcomes, reduced MTTR, and more comprehensive RCA.
We're also adding memory to Bronto, so that a history of your previous actions is recorded. Everyone's agent remembers now, and some vendors already re-derive parts of the environment: Elastic expires a learned fact if it stops appearing in the logs, and Grafana rebuilds its topology memory every week. Nobody re-derives the conclusion, and when a memory says this is how the outage happened and the evidence behind it is gone, there is no way to tell whether it was ever right. Twelve months hot data retention is not what lets you learn from an incident, it is what keeps the evidence around long enough to check the conclusion you drew from it is actually correct.
Our context is also compounding with each layer building on the next. Structure is applied as data arrives and makes it more useful immediately, to humans and especially to agents operating at scale. Operational memory is the half that compounds: what your team and its agents searched, what fired, and what they concluded accumulates, and that is what makes the next investigation faster than the last.
We recently asked the AWS DevOps agent what it looks for in a telemetry layer. It came back with characteristics like trust, discovery, context & consistency and ranked Bronto 9.4/10 vs Grafana’s 4.6/10.
It’s a pretty simple concept - the more meaning you can extract from your data by doing things like adding structure, identifying patterns, finding anomalies, adding context etc. the easier it is to find problems and do more comprehensive and accurate root cause analysis.
It also means you're going to search your data less per investigation which will reduce your AI's token usage as more and more tasks get automated.
Have it any way you want it - fit for an AI era
At Bronto, we've opened up our API so that anything we can do in our UI, you can do yourself, whether that’s using our MCP server (local or remote) or directly talking to our API with your co-pilots, AI SRE or even vibe coding platforms.
In an AI era, we believe the following patterns will hold in terms of how people access their data and as such we will support them all:
Observability platform: Engineers are accustomed to having a dedicated platform for reviewing telemetry data, setting up monitors & dashboards, and running investigations. Teams still want a platform to log into and to be able to search their logs, navigate traces and view dashboards in a traditional way - albeit paired with in-platform AI first capabilities. Bronto makes this a better experience with logs, traces, & metrics available in the same UI (with easy navigation from trace to logs etc.). And because everything is stored in a single DB the UX is seamless and you don’t feel like you are hopping between three separate data stores (e.g. Loki, Tempo, Prometheus).
In-platform AI-first experience: As much as teams still want a platform to use in the way they are used to, there is now an ‘AND’ here - i.e. the expectations have changed and teams now also require an AI first experience available if they want it - one that’s dynamic, can do setup for you, and can run investigations on your behalf. AI workflows should fit seamlessly into standard observability use cases. A good example is our BrontoScope capability - where AI led investigations can be kicked off while reviewing errors in your logs/traces, performing a full triage and root cause of the issue, along with evidence in the form of queries run as part of the investigation which can be easily reviewed.
Co-Pilots, AI workflows and AI SREs: While platform experience is important, many teams now prefer to mostly work in a headless API-first mode - ie. where they interrogate telemetry data via Claude Code and bypass the traditional UI. Bronto was designed for this paradigm and our MCP server brings reliable data and capabilities to any agentic workflow that teams want to run. Similarly, AI SREs are becoming more and more capable at diagnosing and remediating issues and require what Bronto provides, an MCP server, rich context, consistency, trust and obviously access to ALL the data.
Bring Your Own (Telemetry) UI: It’s now easier to write a one line prompt to build a custom UI or workflow than it is to write a ‘group by’ SQL query. Sometimes you may want such a custom user interface on top of your observability data e.g. you want to give your support team an easy to use, tailored and limited view of specific data to resolve particular customer issues. It’s why we built BrontoVibe where teams can quickly remix our UI on platforms like Lovable or v0, or simply build their own and adapt it to the organisation’s unique needs. Backed by reliable, well-documented APIs, Bronto lets teams dream big and build fast.
Imagine what could you do if you had 100-1000X more telemetry data, enriched and immediately available for your agents to interrogate...
All your data + intelligence applied = better outcomes
Get started with Bronto today with a 2 week free trial or by scheduling a demo with our team.


Try Bronto free for 14 days
Centralize your agent and infrastructure telemetry in one platform with sub-second search and 12-month hot retention. No credit card required.